• Application Note

Analysis of Busulfan in Plasma for Clinical Research

Analysis of Busulfan in Plasma for Clinical Research

  • Stephen Balloch
  • Lisa J. Calton
  • Gareth Hammond
  • Waters Corporation

For research use only. Not for use in diagnostic procedures.

Abstract

In this application note analysis of plasma busulfan has been developed by an analytically sensitive and selective clinical research method. 

Benefits

  • Analytical selectivity afforded by chromatography and highly selective mass detection
  • Wide (200 fold) dynamic range
  • Simple and inexpensive sample preparation using low sample volumes
  • Speed of analysis

Introduction

Busulfan is a bifunctional alkylating agent whose bioavailability varies greatly between individuals due to factors such as age, underlying diseases and drug-drug interactions.1 An accurate, analytically sensitive and selective analytical method may play a role in researching the pharmacokinetic and pharmacodynamic effects of busulfan administration.

In this application note, we describe a clinical research method using deproteination of plasma with busulfan-2H8 internal standard in methanol. Chromatography was achieved within 2.5 minutes using a Waters ACQUITY UPLC HSS T3 Column, on an ACQUITY UPLC I-Class System followed by detection on a Xevo TQD Mass Spectrometer (Figure 1).

Figure 1. The Waters ACQUITY UPLC I-Class System and Xevo TQD.

Experimental

Sample preparation

Busulfan certified reference solution and its stable labeled internal standard (2H8) were purchased from Qmx (Thaxted, Essex, UK). Calibrators were prepared in a surrogate matrix of pooled plasma purchased from Golden West Biologicals (Temecula, CA, USA). The calibration range for busulfan was 0.025–5 µg/mL. QC materials were prepared using this same pooled plasma at 0.05, 0.75, 1.5, and 3.5 µg/mL. 

Sample extraction

For every 50 µL of sample, 250 µL of 0.1 µg/mL internal standard (ISTD) of methanol was added, vortex mixed for 30 seconds and centrifuged for two minutes at 16,100 g. A 50 µL aliquot of supernatant was added to 950 µL water to prepare the final extract for analysis on the UPLC-MS/MS system.

LC conditions

System:

ACQUITY UPLC I-Class with FTN

Needle:

30 μL

Column:

ACQUITY UPLC HSS T3 1.8 μm, 2.1 mm x 50 mm (P/N 186003538)

Mobile phase A:

Water + 2 mM ammonium acetate + 0.1% formic acid

Mobile phase B:

Methanol + 2 mM ammonium acetate + 0.1% formic acid

Needle wash solvent:

80% aqueous methanol + 0.1% formic acid

Purge solvent:

Mobile phase A

Seal wash:

20% aqueous methanol

Column temp.:

35 °C

Injection volume:

10 μL

Flow rate:

0.60 mL/min

Run time:

2.5 min (3.0 min injection to injection)

Gradient

Table 1. Chromatographic elution timetable.

MS conditions

System:

Xevo TQD

Resolution:

MS1 (0.7 FWHM)

MS2 (0.7 FWHM)

Acquisition mode:

Multiple Reaction Monitoring (MRM) (See Table 2 for details)

Polarity:

ESI+

Capillary:

0.5 kV

Source temp.:

150 °C

Desolvation temp.:

500 °C

Dwell time:

0.05 s (busulfan), 0.02 s (ISTD)

Inter-scan delay:

0.02 s

Inter-channel delay:

0.01 s

Method conditions

Table 2. Guideline MRM parameters for busulfan and its internal standard, busulfan-2H8 used in this study.

Data management

MassLynx v4.1 with TargetLynx Application Manager

Results and Discussion

Under these chromatographic conditions, busulfan is separated chromatographically from phospholipids. Figure 2 shows a typical lowest concentration calibrator and internal standard. 

Figure 2. Example chromatograms of busulfan (0.025 µg/mL) and internal standard (busulfan-2H8) in plasma.

No system carryover was observed following analysis of plasma samples with busulfan levels of up to 10 µg/mL.

Analytical sensitivity investigations indicate that quantification (<20% RSD, <15% bias) at 0.020 µg/mL for busulfan is achievable. 

Precision experiments were performed, extracting and quantifying five replicates of four concentrations of QC material over five separate days (n=25). Repeatability was assessed by analysing five replicates at each QC level. Table 3 presents the results of these experiments, where total precision and repeatability at the four concentrations assessed was ≤7.3% RSD for busulfan.

Table 3. Total precision and repeatability for analysis of busulfan.

The method was shown to be linear over the range of 0.0175–6.51 µg/mL when different ratios of high and low concentration pools of busulfan were combined and analysed. 

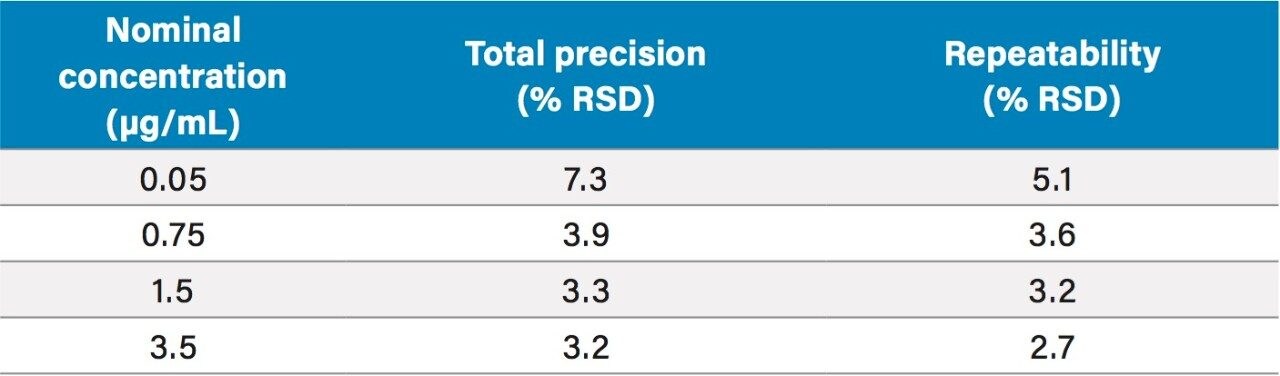
Matrix effects were evaluated at low (0.05 µg/mL) and high (3.5 µg/mL) busulfan concentrations in plasma (n=6). The matrix factor range was 0.92 to 1.06 (mean 0.99) for low concentrations compared with 0.99 to 1.12 (mean 1.08) for high concentrations. Use of busulfan internal standard adjusted response compensated for this enhancement with matrix factor ranges of 0.98 to 1.02 (mean 0.99) and 0.95 to 1.00 (mean 0.98) for low and high concentrations, respectively.

Potential interference from endogenous compounds (albumin, bilirubin, cholesterol, triglycerides, and uric acid) and the exogenous material intralipid (20% emulsion) spiked at high concentrations was assessed by determining the recovery of busulfan (n=3) from low and high pooled plasma samples (0.05 µg/mL and 3.5 µg/mL). Recovery ranged from 85.1–106.1%. Recovery ranged from 93.2–103.0% when assessing the effects of the presence of acetaminophen, fluconazole, ketoconazole, itraconazole, phenytoin, posaconazole, and voriconazole. A substance was deemed to interfere if a recovery range of 85%–115% was exceeded.

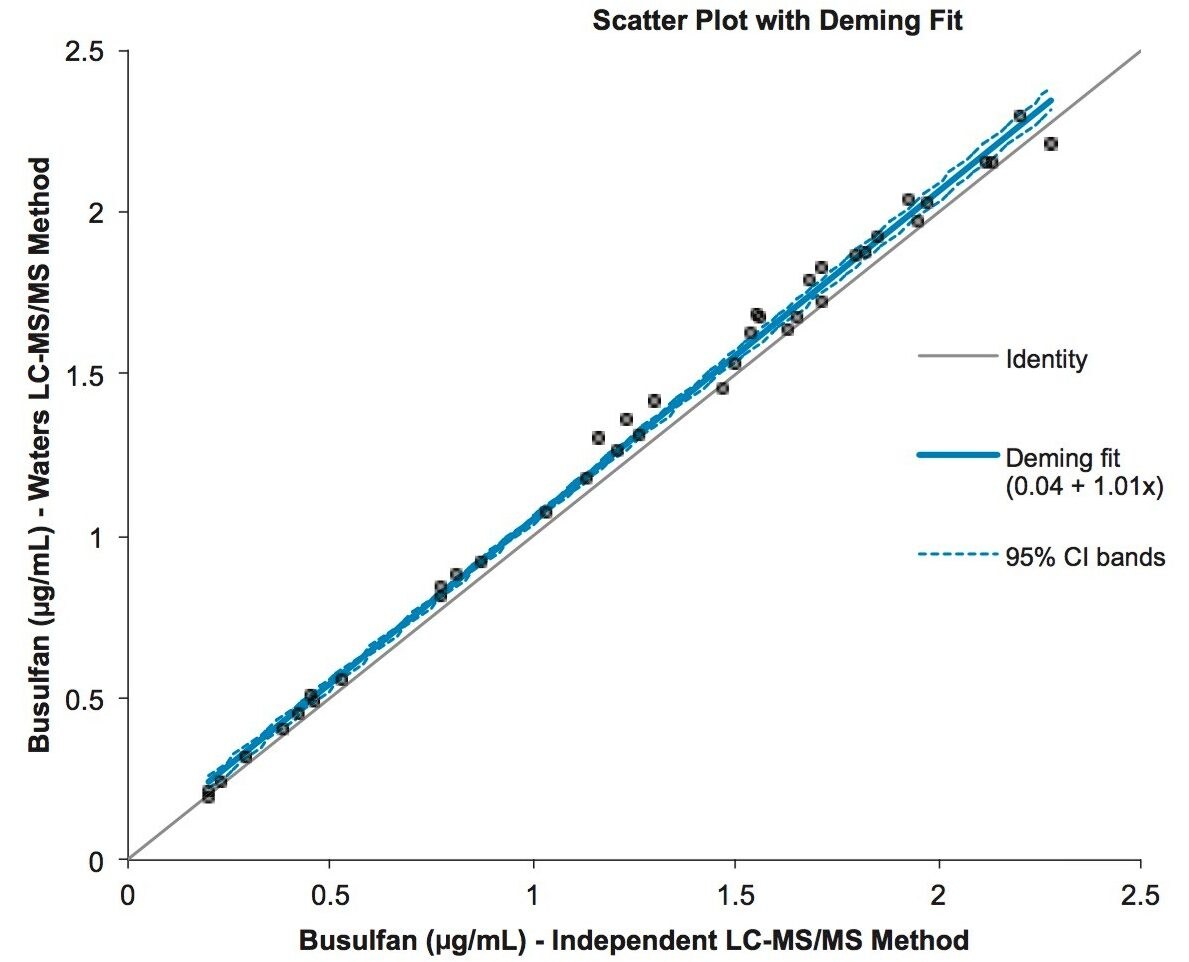
Good correlation between plasma sample concentrations and an independent, validated, LC-MS/MS method was achieved as described by the Deming equation y = 1.01x + 0.04 (n=40, range 0.02–2.28 µg/mL, Figure 3).

Figure 3. Scatter plot of Deming fit of an independent LC-MS/MS method versus Waters method for 40 plasma busulfan samples.

Conclusion

An analytically sensitive and selective clinical research method has been developed for the analysis of plasma busulfan.

Using only 50 µL of sample with fast and inexpensive sample preparation, this analytical method provides sufficient analytical sensitivity to analyze low levels of busulfan (0.025 µg/mL) with excellent precision performance.

The method has been demonstrated as linear whilst showing neither system carryover nor matrix effects. Agreement with an independent LC-MS/MS method was established.

The method may have utility in the research of the pharmacokinetics and pharmacodynamics of busulfan through use in determining cumulative area under the concentration-time curve (area under curve, AUC).

References

  1. Savic RM, Cowan MJ, Dvorak CC, Sung-Yun Pai MD, Pereira L, Bartelink IH, Boelens JJ, Bredius RGM, Wynn RF, Cuvelier GDE, Shaw PJ, Slatter MA, and Long-Boyle JR. Effect of Weight and Maturation on Busulfan Clearance in Infants and Small Children Undergoing Hematopoietic Cell Transplantation. Biol Blood Marrow Transplant. Nov 2013; 19(11).

Acknowledgements

Ed Hinchliffe at the Department of Clinical Biochemistry, Manchester Royal Infirmary, Manchester, UK, is thanked for the provision of anonymized plasma samples for this research. 

720005976, April 2017

Back To Top Back To Top