Cancer is one of the most pressing global health concerns, responsible for almost 10 million deaths worldwide in 2018 alone.1 A highly complex disease, cancer exists in many forms and emerges in a host of different bodily compartments. A combination of genetic and lifestyle factors, such as smoking, are known to increase the probability of cancer emerging, but the mechanisms of pathogenesis remain largely unknown. To improve prevention, diagnosis, and treatment, significant research and resources are being invested to better understand and characterize the complex biology underlying the emergence, propagation, and spread of cancer. One prominent outcome of the research to date is the appreciation that cancer is not a single disease and that a single type of cancer can take a very different course depending on the person affected. With an eye towards personalized medicine, more efficient early diagnosis, and increased surveillance, many research studies are relying on large study cohorts to generate statistically meaningful results. In order to empower these research studies, high throughput assays are required to process the large number of samples.
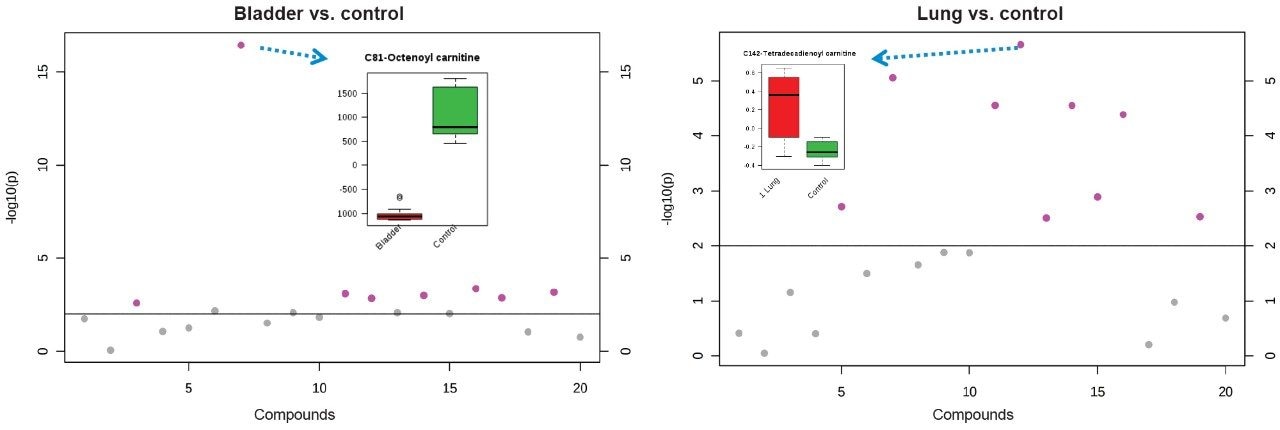
Cancers are characterized in part by an uncontrolled growth of cells, a phenomenon that is often associated with altered expression of proteins, lipids, and metabolites.2,3 These diverse classes of biomolecules have been shown to play a key role in cancer growth by providing energy to sustain rapid growth and higher mitotic rate. Recently, free fatty acid oxidations via carnitines and other derivatives have also been highlighted as another potential source of energy to fuel cancer cells.4
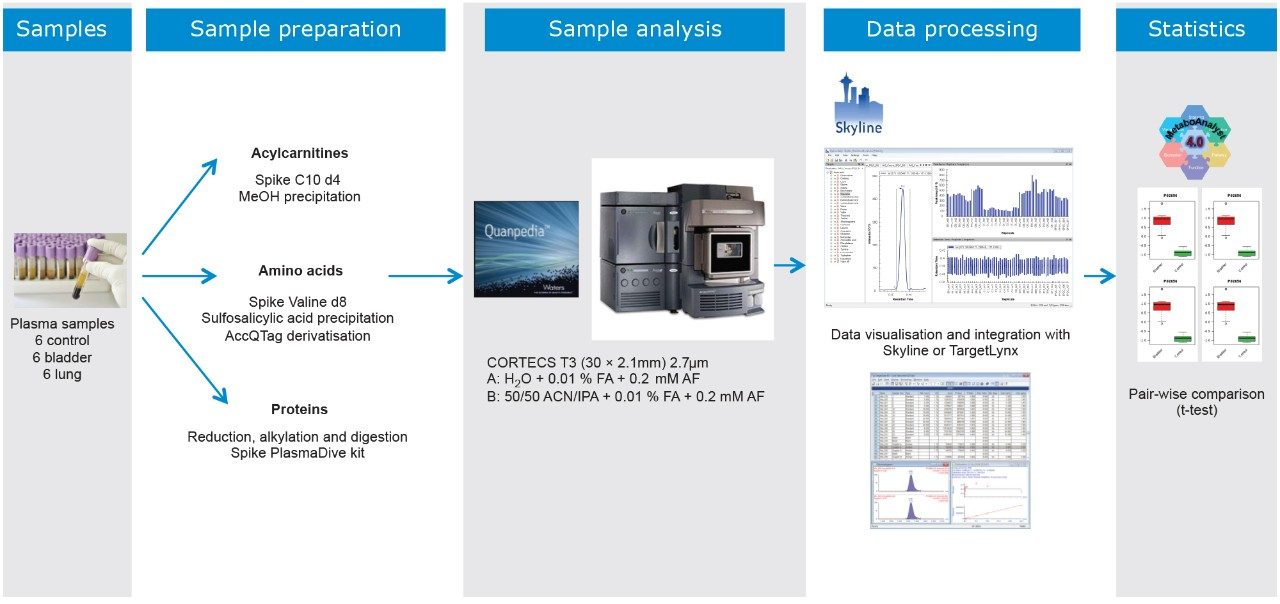
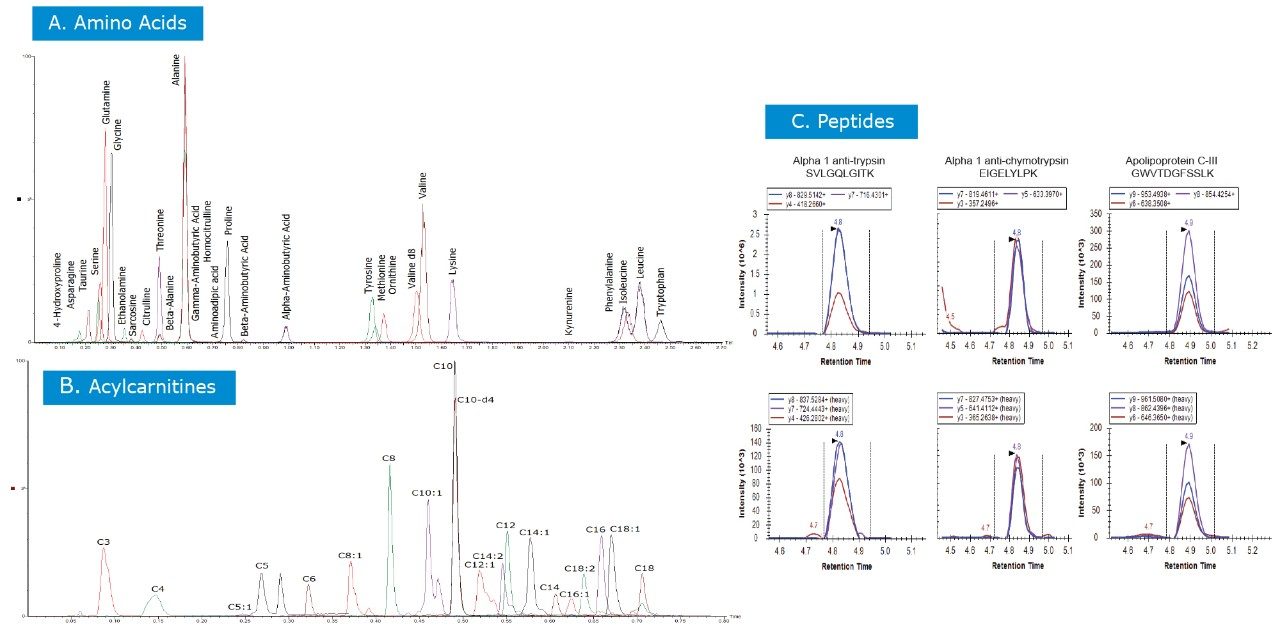
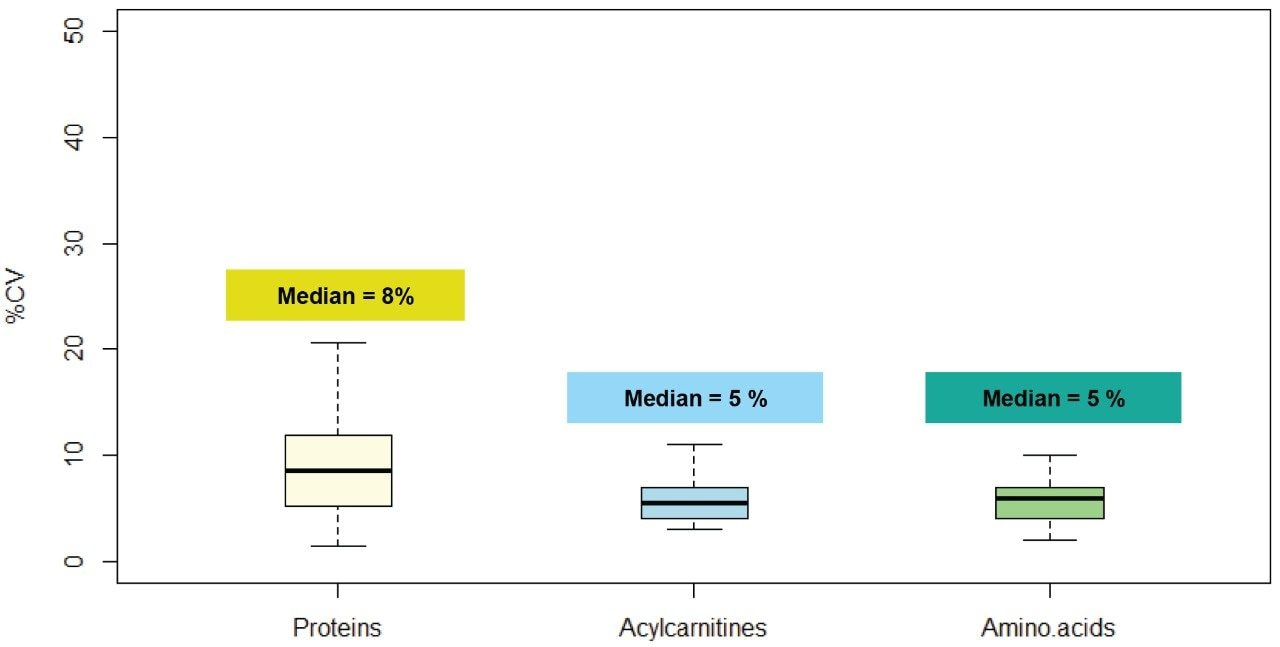
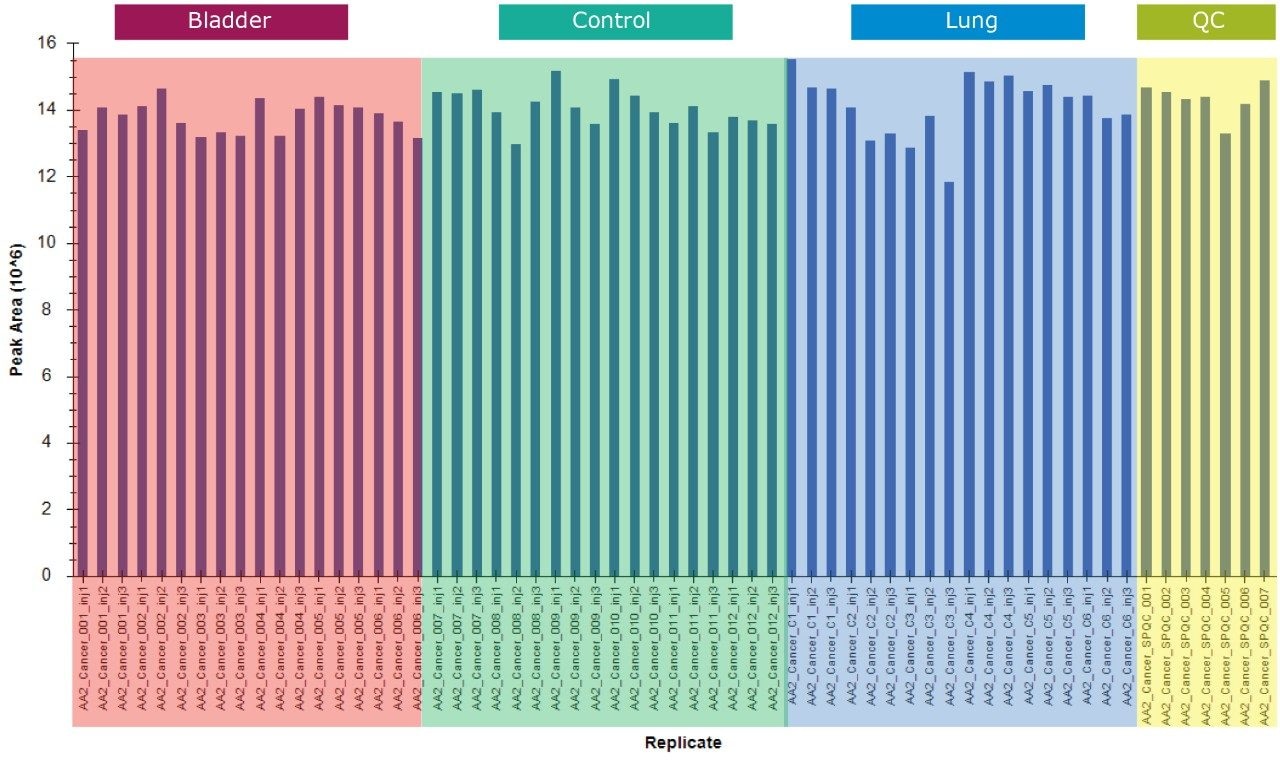
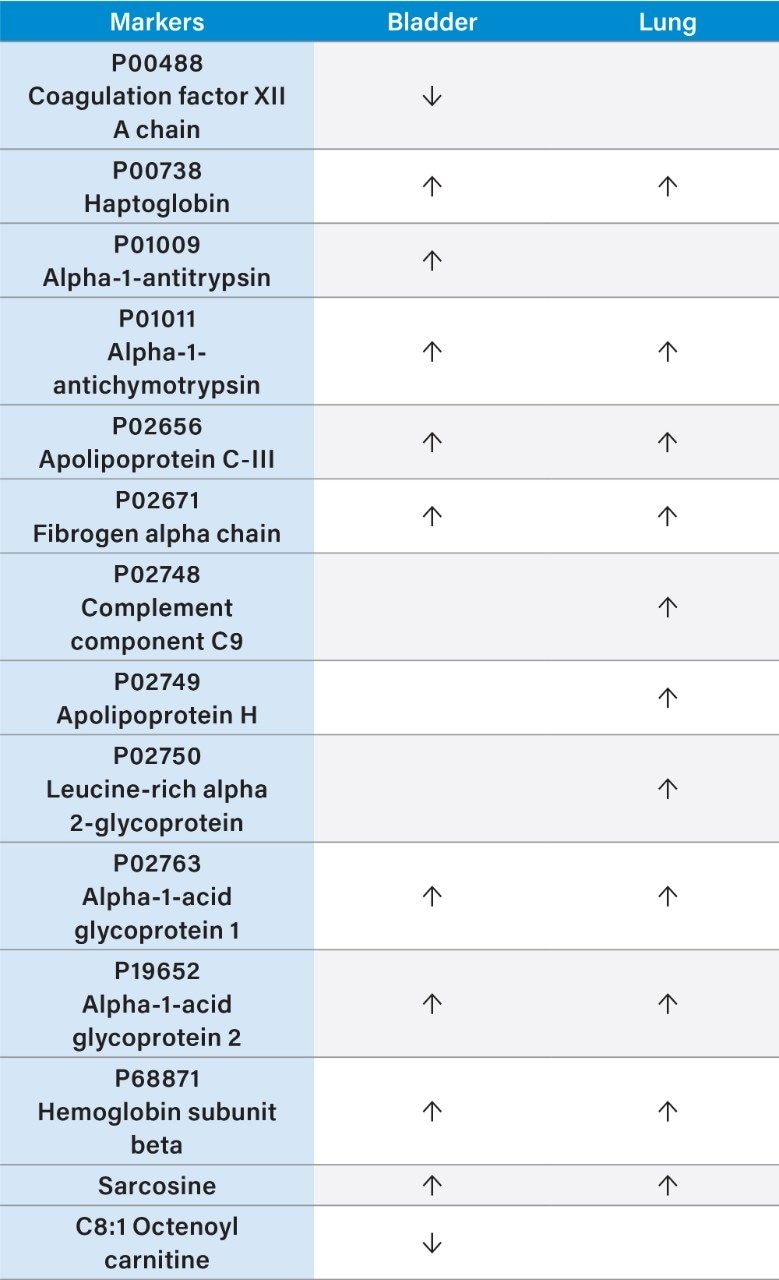
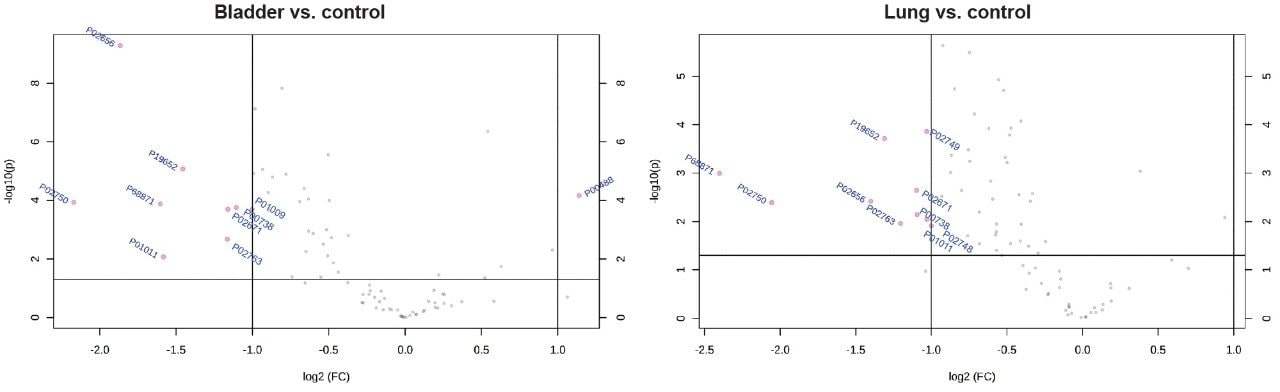
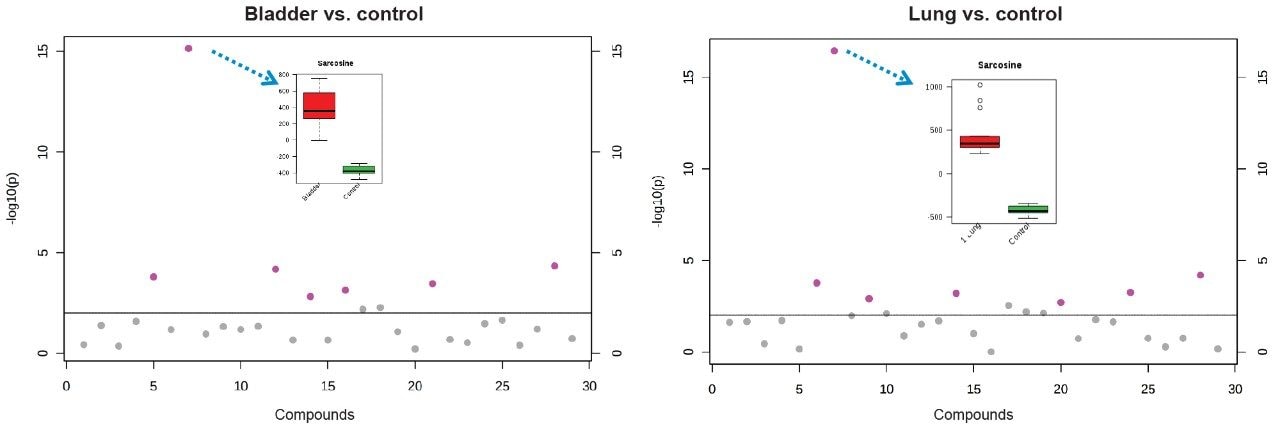
In this application note, we present a research study comparing plasma samples from bladder and lung cancer patients with healthy controls using MetaboQuan-R, a high-throughput targeted OMICS platform. This unique LC-MS platform allows for the rapid screening and semi-quantitative analysis of a variety of different compound classes (amino acids, bile acids, acylcarnitines, proteins, free fatty acids, triglycerides, etc). We demonstrate three of the available methods to highlight some of the putitive markers associated with these cancer subtypes. The three methods utilized include a protein method, which employs the Biognosys PlasmaDive Kit, and an amino acid methodology, which employs an acylcarnitine methodology. These last two classes of molecules were selected since they are known key energy sources in cancer biology.2,3,4