• Application Note

A Rapid UPLC-MS/MS Discovery Bioanalytical Method for the Quantification of Gefitinib and Four of Its Major Metabolites in Mouse Plasma

A Rapid UPLC-MS/MS Discovery Bioanalytical Method for the Quantification of Gefitinib and Four of Its Major Metabolites in Mouse Plasma

  • Billy J. Molloy
  • Ian D. Wilson
  • Robert S. Plumb
  • Waters Corporation

Abstract

This application note demonstrates the use of sub-2-μm UPLC and tandem quadrupole MS/MS for the quantification of gefitinib in mouse plasma following both oral and IV administration.

Benefits

  • Rapid analysis
  • Simple sample preparation
  • Multiple metabolites measured
  • Pharmacokinetics

Introduction

Understanding the pharmacokinetics (PK) and the concentration-response relationship of a candidate drug is key to successful drug discovery/development. This information is used in discovery to aid drug design and lead candidate selection, allowing poorly absorbed candidates to be either modified or replaced with others that are more reliably and extensively absorbed, even if these are less potent. In development, this information is used to monitor toxicology studies as well as predicting likely human exposure to the candidate, thus selecting the correct safe dosing range for Phase I studies.

The implementation of PK/PD evaluation in drug discovery and early development significantly reduces drug failure in late stage development/early clinical trials from lack of efficacy due to poor exposure. LC-MS/MS has become the dominant analytical methodology for PK determination, mainly due to its specificity, sensitivity, simple methods development, and multianalyte capability.

The large number of new molecules requiring evaluation that enter drug discovery each week means that methodologies need to be developed and implemented quickly, without the requirement for extensive method optimization. Therefore, rapid, simple LC-MS/MS methods are required to provide proper resolution of the target analyte from endogenous matrix and drug related metabolites. UltraPerformance Liquid Chromatography (UPLC) utilizing sub-2-μm particles, combined with tandem quadrupole mass spectrometry, is an enabling technology for this type of analysis. Due to the flat nature of the sub-2-μm particle LC van Deemter plot, these columns offer both high resolution and high throughput, thus significantly reducing the need for method development.

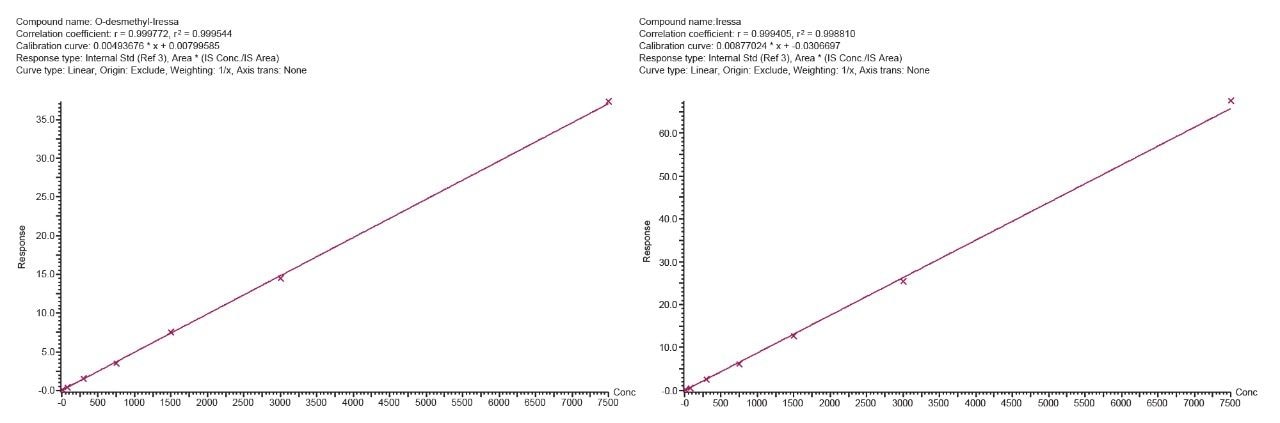
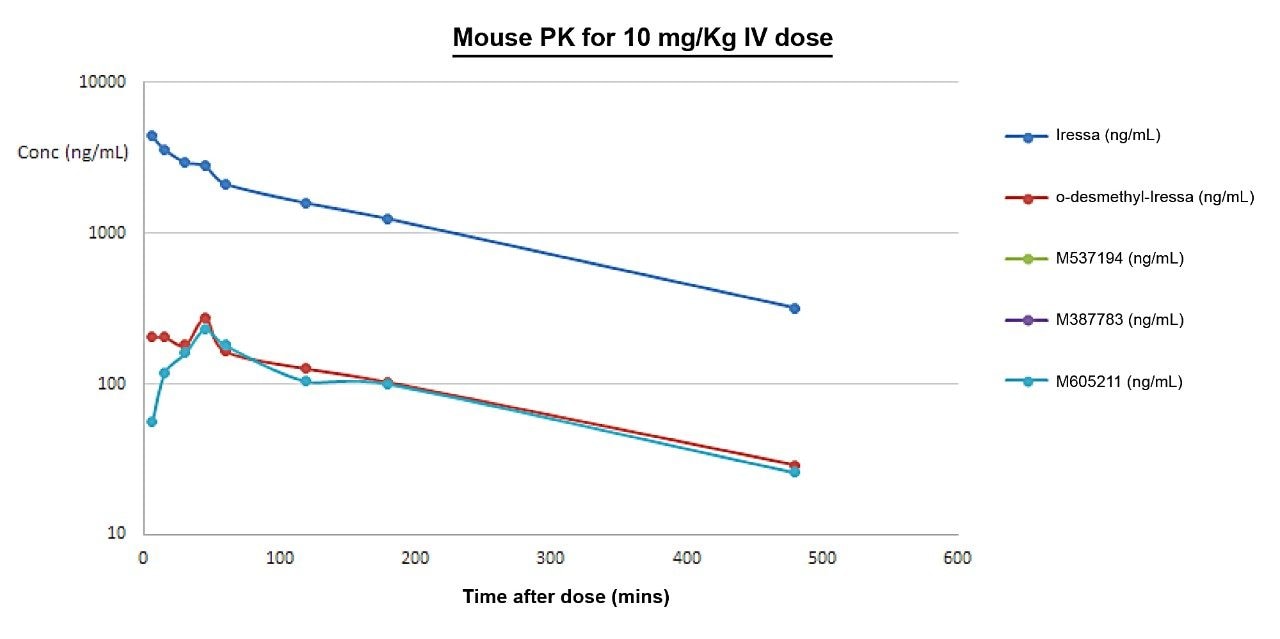
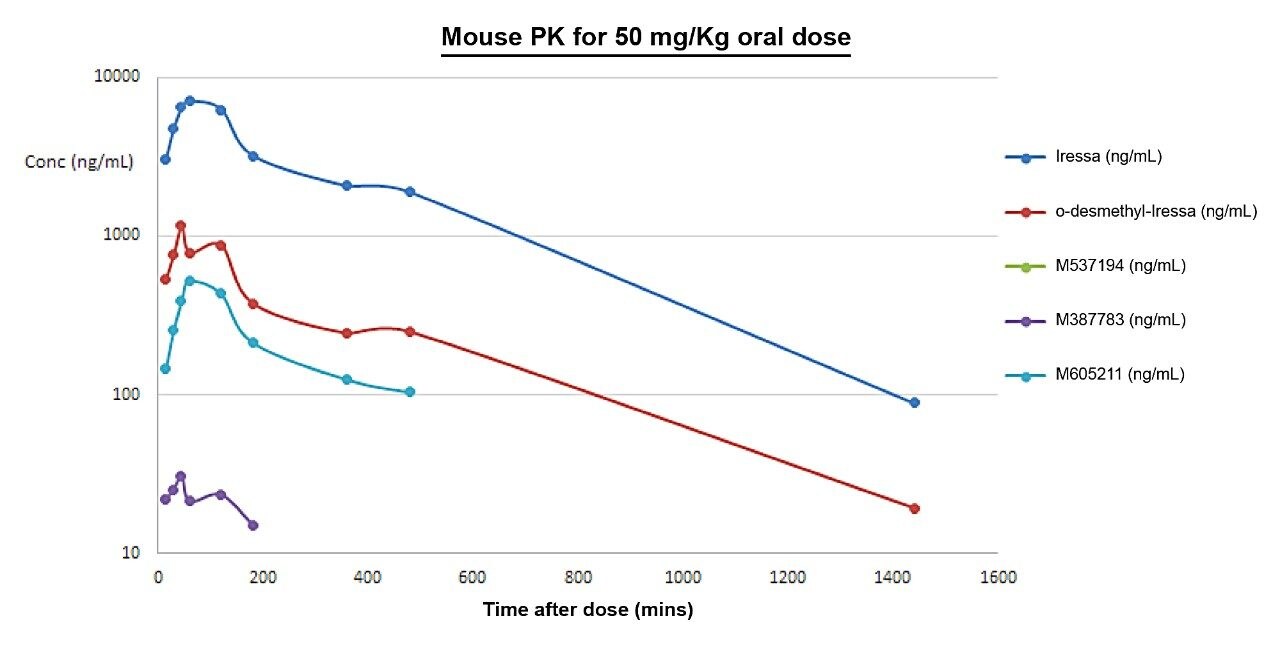
Here we demonstrate the use of sub-2-μm UPLC and tandem quadrupole MS/MS for the quantification of gefitinib (Figure 1) in mouse plasma following both oral and IV administration.

Figure 1. Gefitinib (ZD1839) and its major metabolites.

Experimental

Calibration curves for gefitinib and the O-desmethyl metabolite of gefitinib were produced in control mouse plasma using accurate weighing of the authentic standards dissolved in methanol. These methanolic standards were spiked into the control mouse plasma to produce calibration curves over the range of 15–7500 ng/ml for both analytes, as well as quality control samples (QCs).

Mouse plasma standards, QCs, and samples were prepared using protein precipitation by adding four times the volume of methanol containing the d6 stable labelled gefitinib internal standard. Ten microliters (10 μL) of plasma was mixed with 40 μL of methanol containing the stable labelled internal standard; the sample was then vortex mixed and centrifuged at 25,000 g for 5 min. The resulting supernatant was diluted one in 50 by adding 490 μL of 50:50 methanol:water to 10 μL of the supernatant.

LC conditions

LC system:

ACQUITY UPLC I-Class PLUS

Detection:

Tandem quadrupole MS (Xevo TQ-S micro)

Vials:

TruView LC-MS

Column:

ACQUITY UPLC BEH C18 2.1 × 100 mm, 1.7 μm

Column temp.:

60 °C

Sample temp.:

6 °C

Injection volume:

2 μL

Flow rate:

650 μL/min

Mobile phase A:

0.1% FA in water + 10 mM ammonium acetate

Mobile phase B:

0.1% FA in acetonitrile

Gradient:

Linear gradient from 5–50% B over 2.9 mins followed by 1.5 min flush with 95% B

MS conditions

MS system:

Xevo TQ-S micro

Ionization mode:

Positive ion ESI

MRM detection:

Iressa 446.60 → 128.23

MRM detection:

Internal standard (d6) 452.60 → 134.23

MRM detection:

O-desmethyl-Iressa Metabolite 432.60 → 128.23

MRM detection:

M537194 metabolite 421.60 → 320.30

MRM detection:

M387783 metabolite 444.60 → 128.23

MRM detection:

M605211 metabolite 460.60 → 142.23

Capillary voltage:

2.0 kV

Collision energy:

33 eV

Cone voltage:

30 V

Results and Discussion

Gefitinib

Gefitinib is an orally active and selective inhibitor of the epidermal growth factor receptor (EGFR; HER1) tyrosine kinase, used for the treatment of non-small cell lung cancer, which is marketed as Iressa.1,2 The medicine is administered orally and undergoes first pass metabolism in the liver to form multiple metabolites of which the O-desmethyl is the major one (Figure 1). For a 10-mg/Kg intravenous (IV) dose, the peak plasma levels are in the region of 3000–5000 ng/mL, falling to a lowest concentration of 50–100 ng/mL 24 hours after dosing. The major metabolite (O-desmethyl) has a peak concentration in the region of 300 ng/mL with a lowest concentration of 25 ng/mL 24 hours post-dose. Therefore, to accurately determine the pharmacokinetics of gefitinib in plasma, a rapid LC-MS/MS method is required that can resolve the active component from the metabolites with a linear dynamic range capable of measuring the peak and trough concentrations of both gefitinib and the O-desmethyl metabolite.

LC-MS Methodology

A reversed-phase UPLC-MS/MS method was developed, employing an ACQUITY BEH C18 1.7 μm Column with gradient elution. The overall analysis time was 5.2 min with gefitinib eluting at 1.88 min. The O-desmethyl metabolite was clearly resolved from gefitinib and eluted at 1.76 min. This resolution is particularly important as both of these analytes fragment to give the same MRM product ion at m/z=128.23. The other three metabolites, M605211, M537194, and M387783, eluted with retention times of 2.45, 1.80, and 1.16 min respectively. A representative chromatogram for the analysis of gefitinib and its major metabolites is shown in Figure 2; the data shown illustrates chromatographic resolution of gefitinib and its metabolites. The increased retention time of the M605211 metabolite compared to gefitinib can be attributed to an increase in the molecule’s lipophilicity as a result of the metabolic process.

Figure 2. Typical chromatogram for gefitinib and four of its major metabolites.

Bioanalytical Assay Performance

The bioanalytical assay was determined to be linear over the range of 15–7500 ng/mL for both gefitinib and the O-desmethyl metabolite; the regression coefficient (r2) using 1x weighting was determined at be 0.9994 for gefitinib and 0.9998 for the O-desmethyl metabolite (as shown in Figure 3). QC samples were prepared at 30, 1000, and 6000 ng/mL for both gefitinib and the O-desmethyl metabolite. The QCs were analyzed in duplicate with each of the four batches of samples processed. The data in Tables 1 and 2 summarizes the mean determined concentration and %CV data obtained for gefitinib and the O-desmethyl metabolite. Each batch had at least four QC, one at each concentration level, with a back calculated value within 15% of the nominal concentration. As authentic standards were not available for the M537194, M387783, and M605211 metabolites, their concentrations were determined using the gefitinib calibration curve.

Figure 3. Typical calibration curves produced for gefitinib and its main metabolite (O-desmethyl).
Table 1. Summary of gefitinib QC data from four replicate batches.
Table 2. Summary of O-desmethyl gefitinib QC data from four replicate batches.

Gefitinib and Metabolite Concentrations

Analysis of the samples showed that, following IV administration of the gefitinib at 10 mg/kg, the maximum concentration of gefitinib was 4960 ng/mL, the O-desmethyl metabolite peak concentration was determined to be 280 ng/mL at the one-hour time point, and the M605211 metabolite showed a peak concentration of 230 ng/mL at the one-hour time point. The 50-mg/kg PO dose samples gave a gefitinib peak concentration of 8600 ng/mL at the one-hour time point and the O-desmethyl metabolite, M387783 metabolite, and M605211 metabolite concentrations peaked at the one-hour time point with peak concentrations of 1100ng/mL, 33.9 ng/mL, and 613 ng/mL respectively. The derived pharmacokinetics curves for the IV and PO are shown in Figures 4 and 5, respectively.

Figure 4. Pharmacokinetic profile in mouse for gefitinib (Iressa) and four of its metabolites after a 10-mg/kg IV dose.
Figure 5. Pharmacokinetic profile in mouse for gefitinib (Iressa) and four of its metabolites after a 50-mg/kg oral dose.

Pharmacokinetics

Following the 10-mg/kg IV dose, the gefitinib concentration showed a first-order elimination profile with a slight increase in concentration at the 45-min time point. The O-desmethyl metabolite showed a similar elimination profile with a more pronounced increase in concentration between 45 min and one hour. The M605211 metabolite showed a gradual increase in concentration peaking at the 45-min time point, before showing a similar elimination profile to gefitinib and the O-desmethyl metabolite. No concentration was observed for the M537194 and M387783 metabolite following dosing. The half-life was determined to be 2.6 (3.8 orally) hours and the clearance was 14.4 mL/min/Kg, which is in line with previous publications.3 The derived pharmacokinetic data is summarized in Table 3.

Table 3. Derived pharmacokinetics data.

The oral dose-response curve for gefitinib showed an absorption phase with a peak concentration occurring at one hour after dosing followed by an elimination phase. A similar profile was observed for the O-demethyl, M387783, and M605211 metabolites. The M387783 and M605211 metabolites were detected up to three hours and eight hours after administration. The gefitinib and O-desmethyl metabolite showed a secondary concentration maximum at the four-hour time point; this observation was also reported by McKillop et al.3 and could be due to compound re-adsorption from the bile.

Conclusion

A simple and rapid UPLC-MS/MS methodology was developed for the quantification of gefitinib and four of its metabolites in mouse plasma. The methodology showed excellent separation between gefitinib and its major metabolites. The bioanalytical assay had a limit of quantification of 15 ng/mL for both gefitinib and the O-desmethyl metabolite of gefitinib, with an upper limit of quantification of 7500 ng/mL. The assay was shown to be reliable and reproducible with the QC concentrations coefficient of variation ranging from 3.8% to 7.8% for gefitinib and 2.9% to 9.9% for the O-desmethyl metabolite. The assay was employed for quantification in plasma following IV and PO administration of gefitinib to the mouse. The derived PK data showed good correlation with the published literature.

References

  1. McKillop, D. et al. Tumor penetration of gefitinib. Mol. Cancer Ther., 2005, 4(4).
  2. Zhang, Q. et al. Effect of weekly or daily dosing regimen of Gefitinib in mouse models of lung cancer. Oncotarget, 2017, 8, (42), 72447–72456.
  3. McKillop, D. et al. Pharmacokinetics of gefitinib, an epidermal growth factor receptor tyrosine kinase inhibitor, in rat and dog. Xenobiotica, 2004, 34 (10) 901–915.

720006832, April 2020

Back To Top Back To Top