• Application Note

Advanced HPLC Size-Exclusion Chromatography for the Analysis of Macromolecular Proteins Using 3.5 μm Ethylene Bridged Hybrid (BEH) Particles

Advanced HPLC Size-Exclusion Chromatography for the Analysis of Macromolecular Proteins Using 3.5 μm Ethylene Bridged Hybrid (BEH) Particles

  • Stephan M. Koza
  • Susan Serpa
  • Hua Yang
  • Edouard Bouvier
  • Kenneth J. Fountain
  • Waters Corporation

Abstract

This application note highlights the performance characteristics of both the 200Å and 450Å pore-size versions of these columns, designed for the separation of macromolecular proteins, with respect to resolution, column-to-column reproducibility, and column stability.

Benefits

  • Improved resolution of macromolecular proteins by SE-HPLC
  • Outstanding column stability and reliable column-to-column reproducibility
  • Both 200Å and 450Å pore sizes provide a broad protein size separation range
  • 2-fold increased sample throughput with minimal compromise in resolution compared to traditional HPLC separation

Introduction

In 2010 Waters first introduced a 200Å pore-size size-exclusion chromatography (SEC) based on UPLC Technology.1 These size-exclusion UPLC (SE-UPLC) columns consist of sub-2-μm diameter ethylene bridged hybrid (BEH) particles, which are more structurally and chemically stable than pure silica-based particles. It is the enhanced structural stability of these particle that has indeed enabled the advent of SE-UPLC. However, the small particle-size and narrow 4.6 mm internal diameter of SE-UPLC columns are not optimal for use with an HPLC system. As a result, Waters has introduced HPLC-compatible, 3.5 μm particle diameter and 7.8 mm internal diameter size-exclusion HPLC columns (SE-HPLC) based on the robust BEH chemistry. This provides laboratories with HPLC instrumentation a means to take advantage of the benefits provided by this unique particle technology including its capability to withstand higher back pressures as compared to silica-based SEC particles. This note will highlight the performance characteristics of both the 200Å and 450Å pore-size versions of these columns, designed for the separation of macromolecular proteins, with respect to resolution, column-to-column reproducibility, and column stability. Additionally, the distinct advantages in terms of resolution and sample-throughput that these sub-4-μm packing material offers over larger (5 and 8 μm) standard HPLC particle sizes for the separation of large proteins will also be shown.

Experimental

Sample description

All samples were diluted in mobile phase unless otherwise noted. Proteins were purchased as individual standards or as mixtures (Waters and Sigma-Aldrich). Sample concentrations were 1.0 mg/mL (nominal) unless noted otherwise.

Method conditions

LC conditions

LC system:

Alliance HPLC or ACQUITY UPLC H-Class Bio System with 30 cm Column Heater

Detection:

Alliance HPLC TUV Detector ACQUITY UPLC TUV Detector with 5 mm titanium flow cell

Wavelength:

280 or 214 nm

Columns:

Waters XBridge Protein BEH SEC, 200Å, 3.5 μm, 7.8 x 150 mm (p/n 176003595) and 7.8 x 300 mm (p/n 176003596) XBridge Protein BEH SEC, 450Å, 3.5 μm, 7.8 x 150 mm (p/n 176003598) and 7.8 x 300 mm (p/n 176006599)

Comparator

Columns:

250Å, 5 μm, Silica-DIOL SEC, 7.8 x 300 mm Silica-DIOL SEC, 450Å, 8 μm, 7.8 x 300 mm

Column temp.:

Ambient

Sample temp.:

10 °C

Injection volume:

10 μL

Flow rate:

0.84 mL/min

Mobile phases:

25 mM sodium phosphate, 150 mm sodium chloride, pH 7.2 (prepared using Auto•Blend Plus Technology)

Gradient:

Isocratic

Standard:

BEH200 SEC Protein Standard Mix (p/n: 186006518) BEH450 SEC Protein Standard Mix (p/n: 186006842) Intact mAb Mass Check Standard (p/n: 186006552)

Sample vials:

Deactivated Clear Glass 12 x 32 mm Screw Neck Total Recovery Vial, with cap and preslit PTFE/Silicone Septa, 1 mL (p/n: 186000385DV)

Data management


Chromatography software: Empower Pro (v2 and v3)

Results and Discussion

The benefits provided by BEH Technology when used in the manufacturing of size-exclusion UPLC (SE-UPLC) packing materials for the analysis of peptides and proteins; have been previously described.2,3 However, the diameter of these UPLC particles precluded their use in column dimensions applicable to HPLC instrumentation. In order to take advantage of the chemical and structural capabilities of BEH particle technology for the SEC separation of proteins and other macromolecules on HPLC instrumentation 7.8 mm ID columns packed with 3.5 μm BEH particles with pore sizes of either 200Å or 450Å have been introduced. These two column types provide a broad molecular weight range of SE-HPLC separations to include biological macromolecules with large radii of hydration (Rh), ranging from approximately 10 KDa to nearly 2 MDa. As part of this evaluation, the separation efficiency advantages of this packing material with respect to larger particle-size (5 and 8 μm) HPLC packing materials, and the critical performance characteristics of column-to-column reproducibility and lifetime stability will be demonstrated. In addition, this note will define the protein size-separation range of these two columns.

Advantages of reduced BEH particle size

Due to the significantly higher extra-column dispersion volumes and lower pressure limits of HPLC systems relative to UPLC Systems the resolution benefits provided by UPLC size-exclusion particles have not been available to laboratories that currently use HPLC instrumentation. In an effort to provide optimal resolutions for the SE-HPLC separation of proteins, a series of columns have been introduced based on BEH particle technology. To demonstrate their performance, protein molecular weight standards and a monoclonal IgG standard were separated on 250Å pore-size silica-based SEC column (5 μm, 7.8 x 300 mm) and  on a 200Å pore-size BEH-based SEC column (3.5 μm, 7.8 x 300 mm) using the same Alliance HPLC System and aqueous mobile phase conditions (Figure 1).

Figure 1. Shown is a comparison of separations of Waters BEH200 SEC Protein Standard Mix (p/n: 186006518) and Intact mAb Mass Check Standard (p/n: 186006552, diluted to 1 mg/mL) on 250Å, silica-based 5 μm (Frames A and C) and 200Å, BEH 3.5 μm (Frames B and D) SEC columns. Both columns were the same dimensions (7.8 x 300 mm) and separations were performed with the same flow rate (0.84 mL/minute) and the same sample loads. Peak identities for chromatograms A and B are: 1) thyroglobulin (669 KDa), 2) IgG (150 KDa), 3) BSA (67 KDa), 4) myoglobin (14 KDa), and uracil (112 Da). For the chromatograms C and D the molecular weights of the IgG monomer and dimer are approximately 150 KDa and 300 KDa, respectively.

The flow rates and injection volumes used were equivalent. Improved sensitivity and narrower peak widths were observed on the 3.5 μm packing material across the separation range of the molecular weight standards. USP resolution values (half-height measurement) calculated for the separation between the IgG monomer (MW=150 KDa) and dimer (MW=300 KDa) forms demonstrated an improvement of over 40% for the 3.5 μm particle over the resolution observed for the 5 μm particle size column. This improvement in resolution approaches the improvement that would be predicted by doubling the column length (Rs ∝ √L). Similar results comparing the chromatograms generated for the 450Å pore-size, silica-based, SEC column (8 μm, 7.8 x 300 mm) to the 450Å pore-size BEH-based SEC column (3.5 μm, (7.8 x 300 mm) ) were observed (Figure 2). However, in this comparison the relative improvement observed for the separation between the IgG monomer and dimer is approximately 75%. This is due to the greater decrease in particle size between these two columns as compared to the smaller pore size 250Å silica-based and BEH 200Å particles. As a general observation, it should be noted from these data that the BEH 450Å SEC column provides an outstanding separation of both the dimeric and multimeric aggregate forms in this IgG sample.

Figure 2. Shown is a comparison of separations of Waters BEH450 SEC Protein Standard Mix (p/n: 186006842) and Intact mAb Mass Check Standard (p/n: 186006552, diluted to 1 mg/mL) on 450Å, silica-based 5 μm (Frames A and C) and 450Å, BEH 3.5 μm (Frames B and D) SEC columns. Both columns were the same dimensions (7.8 x 300 mm) and separations were performed with the same flow rate (0.84 mL/minute) and with the same sample loads. Peak identities for chromatograms A and B are: 1a) thyroglobulin dimer (1.3 MDa), 1b) thyroglobulin (669 KDa), 2) IgG (150 KDa), 3) BSA (67 KDa), 4) myoglobin (14 KDa), and uracil (112 Da). For the chromatograms in frames C and D the molecular weights of the IgG monomer, dimer, and multimer are approximately 150 KDa ,300 KDa, and ≥450 KDa, respectively.

Advantages of BEH Particle Strength

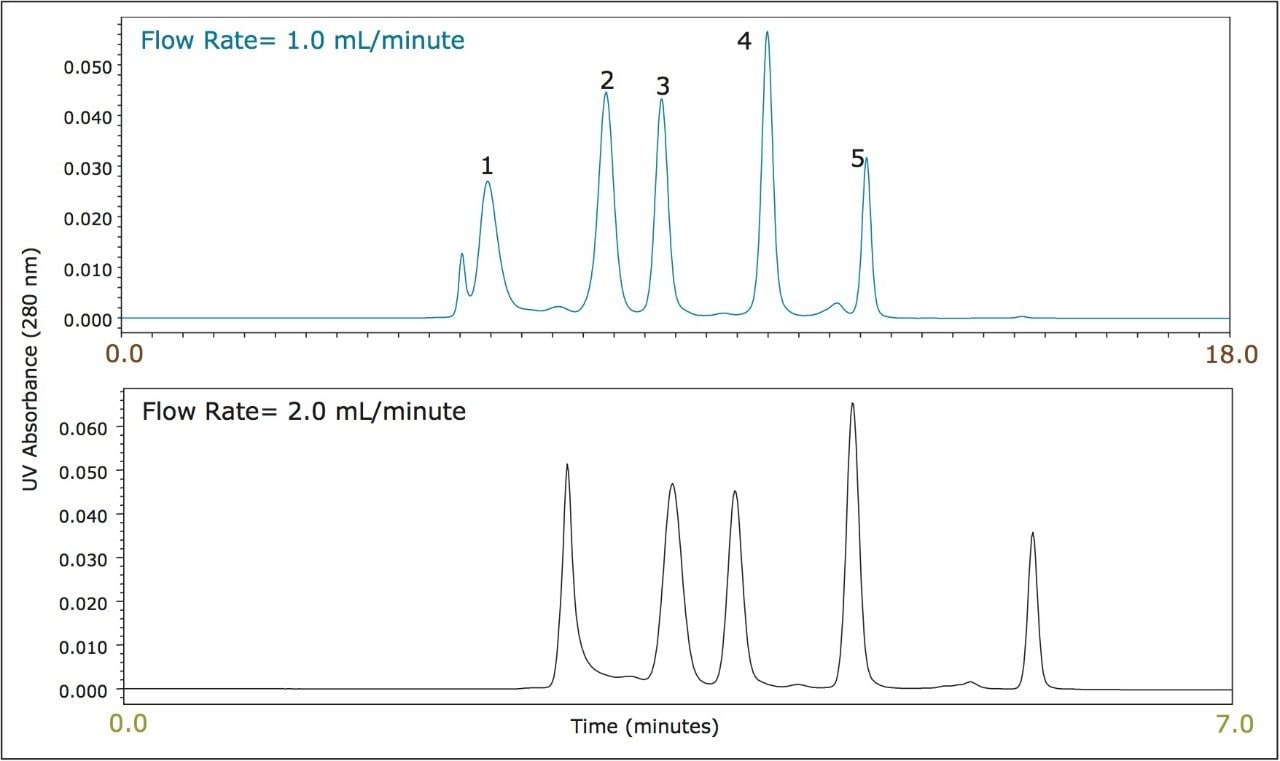
BEH SEC particles have improved mechanical strength in comparison to silica based particles. An opportunity presented to the analyst due to this characteristic is the ability to run at higher flow rates and pressures than can be tolerated by traditional SE-HPLC columns. By increasing the flow rate, the analysis time can be reduced proportionally in SEC, however, it should be noted that SEC resolution decreases as a function of flow rate. Taking these characteristics under consideration, if higher SE-HPLC sample throughput is an essential requirement the 3.5 μm BEH SE-HPLC can accommodate this demand. In this study a comparison (Figure 3) was made between a traditional 250Å, 5 μm silica based SE HPLC column (7.8 x 300 mm). and a 3.5 μm BEH-based SE-HPLC column (7.8 x 300 mm). The 5 μm silica-based SE-HPLC column flow rate was set to 1.0 mL/minute (maximum flow rate: 1.2 mL/minute) and the 3.5 μm BEH SE-HPLC column was set to 2.0 mL/minute (maximum flow rate: 2.7 mL/minute). Comparable molecular weight standard profiles are observed, with the exception that the larger pore-size of the 250Å, 5 μm silica-based particle provides improved resolution of the thyroglobulin dimer peak (1.3 MDa) than what is observed on the 200Å, 3.5 μm BEH-based particle. While increasing the flow rate by a factor of two decreases the analysis time proportionally there will be a concomitant loss of resolution. As an example, the resolution observed between IgG and BSA was 2.5 on the 3.5 μm BEH based column as compared to 2.0 on the 250Å, 5 μm silica based column (data not shown) at a flow rate of 1.0 mL/minute. However, at a flow rate of 2.0 mL/minute, the resolution on the 3.5 μm BEH-based column decreased approximately 25% to a resolution of 1.9.

 Figure 3. Shown is a comparison of separations of Waters BEH200 SEC Protein Standard Mix (p/n: 186006518) on 250Å, silica-based 5 μm SEC column, separated at 1.0 mL/minute (Frame A) and on a 200Å, BEH 3.5 μm (Frame B ) SEC column separated at 2.0 mL/minute. Both columns were the same dimensions (7.8 x 300 mm)  and the same sample loads were used. The time axis for the main chromatograms have been normalize, the actual times of the separations are provided in the inset. Peak identities for chromatograms A and B are: 1) thyroglobulin (669 KDa), 2) IgG (150 KDa), 3) BSA (67 KDa), 4) myoglobin (14 KDa), and uracil (112 Da).

Note: Comparable molecular weight standard profiles are observed, with theexception that the larger pore-size of the 250Å, 5 μm
silica-based particles provide improved resolution of the thyroglobulin dimer peak (1.3 MDa) than what is observed on the 200Å,
3.5 μm BEH-based particle. Use of Waters XBridge Protein BEH SEC, 450Å, 3.5 μm is recommended for the analysis of proteins,
such as thyroglobulin and its dimer, whose molecular weights exceed those recommended be analyzed on the XBridge Protein BEH
SEC, 200Å, 3.5 μm Column.

XBridge Protein BEH SEC 200Å, and 450Å, 3.5 μm Columns: reproducibility and stability

Major concerns that an analyst has when selecting an SEC column for method development or use in a validated method are column-to-column and batch-to-batch reproducibility as well as obtained column lifetime when used in methods. Shown in Figure 4 is an overlay of the chromatograms for a  series of molecular weight standards for both the 200Å and 450Å, 3.5 μm SEC columns in a (7.8 x 300 mm). These chromatograms demonstrate the reproducibility of 6 SEC columns packed from 3 different production lots of packing material. For these standards, and at a flow rate of 0.84 mL/minute, the retention time standard deviations for the 200Å pore size, SEC column ranged from a minimum of 0.037 minutes to 0.084 minutes with an average standard deviation of 0.064 minutes for all components labeled in Figure 1. For the 450Å pore size, SEC column the retention time standard deviations ranged from a minimum of 0.045 minutes to 0.068 minutes with an average standard deviation of 0.060 minutes.

Figure 4. Shown are overlays of the separations of Waters BEH200 SEC Protein Standard Mix (p/n: 186006518) and BEH450 SEC Protein Standard Mix (p/n: 186006842) on 200Å and 450Å BEH 3.5 μm SEC columns. Two columns (7.8 x 300 mm) were packed from 3 individual manufacturing batch of particles to evaluate both column-to-column and batch-to-batch reproducibility. Peak identities are: 1a) thyroglobulin dimer (1.34 MDa), 1b) thyroglobulin (669 KDa), 2) IgG (150 KDa), 3) BSA (67 KDa), 4) myoglobin (14 KDa), and uracil (112 Da). Separations were performed on an ACQUITY UPLC H-Class Bio System.

The stability of the 200Å and 450Å, 3.5 μm SEC columns (7.8 x 300 mm) was evaluated by injecting a series of standards over the course of over 600 total injections. Given that the stability of silica-based SEC columns can be deleteriously altered by mildly basic pH levels, the pH of the mobile phase was set to 7.2, equivalent to that of phosphate buffered saline (PBS) buffer. Shown in Figures 5 and 6 are comparisons of the profiles obtained for the molecular weight standards and the IgG standard from the start to the finish of the study for both columns. The resolution between two of the critical peak pairs, IgG and BSA, and IgG Dimer and IgG monomer were determined for each column. Both columns demonstrated remarkable stability with only modest depreciation of the calculated resolutions as highlighted in the Figure caption. These data demonstrate that XBridge Protein BEH SEC columns containing 3.5 μm particles can provide the reproducibility and stability needed to develop reliable assays and run them routinely in a quality control environment.

Figure 5. Shown are comparisons of column lifetime study separations of Waters BEH200 SEC Protein Standard Mix (p/n: 186006518) and Intact mAb Mass Check Standard (p/n: 186006552, diluted to 1 mg/mL) on 200Å BEH 3.5 μm SEC column (7.8 x 300 mm). Peak identities for chromatograms A and B are:  1) thyroglobulin (669 KDa), 2) IgG (150 KDa), 3) BSA (67 KDa), 4) myoglobin (14 KDa), and uracil (112 Da). For the chromatograms of the mAb standard the molecular weights of the IgG monomer and dimer are approximately 150 KDa and 300 KDa, respectively. Separations were performed on ACQUITY UPLC  H-Class Bio System.
Figure 6. Shown are comparisons of column lifetime study separations of Waters BEH450 SEC Protein Standard Mix (p/n: 186006842) and Intact mAb Mass Check Standard (p/n: 186006552, diluted to 1 mg/mL) on 450Å BEH 3.5 μm SEC column (7.8 x 300 mm). Peak identities are: 1a) thyroglobulin dimer (1.34 MDa), 1b) thyroglobulin (669 KDa), 2) IgG (150 KDa), 3) BSA (67 KDa), 4) myoglobin (14 KDa), and uracil (112 Da). For the chromatograms of the mAb standard the molecular weights of the IgG monomer and dimer are approximately 150 KDa and 300 KDa, respectively. Separations were performed on an ACQUITY UPLC H-Class Bio System.

Molecular weight range

Comparisons were made between the XBridge Protein BEH SEC 450Å and 200Å, 3.5 μm columns for their ability to resolve a series of defined standards. The protein molecular weight calibration curves are shown in Figure 7. For proteins, the linear molecular weight range for the 200Å pore-size column is estimated to be from approximately 10 KDa to 450 KDa, whereas the 450Å pore-size column is estimated to be from approximately 50 KDa to over 1.3 MDa. This upper limit is based on the chromatographic separation observed (Figure 2) for thyroglobulin (669 KDa) and it dimer (1.3 MDa). The 450Å column separation of IgM pentamer (900 KDa) and IgM dipentamer (1.8 MDa) as shown in Figure 8 shows partial resolution between these two forms, which is indicative that the pore volume accessible to the dipentamer is limited, thereby demonstrating that 1.8 MDa is beyond the linear molecular weight range of this column and close to practical upper molecular weight limit for this column. This higher molecular weight range may be of use when analyzing multimeric protein aggregates or proteins conjugated to compounds that have relatively large radius of hydration values such as long chain polyethylene glycols or when running proteins under denaturing SEC conditions.

Figure 7. Shown are calibration curves of various proteins, peptides, and uracil generated for both the BEH 200Å and 450Å, 3.5 μm SEC columns.
Figure 8. Shown is the separation of IgM pentamer, IgM dipentamer, and the multimeric forms of pentameric IgM separated on a BEH, 450Å, 3.5 μm SEC column. The molecular weight of the proteins are: IgM pentamer (900 KDa), IgM dipentamer (1.8 MDa), and IgM multimers (≥2.7 MDa). Separation was performed on an ACQUITY UPLC H-Class Bio System.

Conclusion

A reliable, high resolving, size-exclusion method is often an integral part of the quality assessment of a protein biopharmaceutical and also has a key role in the evaluation of protein samples in other areas of research. The introduction of HPLC-compatible, XBridge Protein BEH SEC 200Å and 450Å, columns containing 3.5 μm particles provide improved component resolution in LC-based SEC separations compared to use of traditional silica-based SEC columns containing 5 μm particles. In addition, higher throughput analyses are possible due to the structural strength of the BEH particle. This critical particle strength characteristic in combination with use of stable diol-bonded particles work to deliver outstanding column lifetimes. As part of the Waters’ quality manufacturing guidelines, these columns are produced to rigorous tolerances and quality tested with relevant analytes. Although not presented within this report, these HPLC separations are also directly scalable to SE-UPLC separations using ACQUITY UPLC Protein BEH SEC Columns containing 1.7 μm or 2.5 μm diameter particles and narrower column internal diameters (4.6 mm I.D.) which can proved even greater resolution and sample-throughput when coupled with UPLC capable chromatographic systems.4

The XBridge Protein BEH SEC, 200Å and 450Å, 3.5 μm Columns provide:

  • HPLC-based SEC resolution of proteins from 10–1,500K Daltons with higher throughput capability
  • Outstanding SEC column life
  • Less non-desired, protein/column interactions than silica-based SEC columns
  • Comprehensive testing to provide unmatched column consistency and increased confidence in validated methods
  • Complement ACQUITY UPLC-based SEC columns for seamless method transfer based on application needs

References

  1. Fountain KJ, Hong, P, Serpa, S, Bouvier, ESP and Morrison, D. Analysis of Biomolecules by Size-Exclusion UltraPerformance Liquid Chromatography. Waters Corporation, Application Note [serial on the Internet]. 2010; (WA64226 ). 
  2. Paula Hong, Stephan Koza, and Kenneth J. Fountain. Advances in Size- Exclusion Chromatography for the Analysis of Small Proteins and Peptides: Evaluation of Calibration Curves for Molecular Weight Estimation. Waters Corporation, Application Note [serial on the Internet]. 2012; (720004412EN). 
  3. Stephan Koza, Matthew Lauber, and Kenneth J. Fountain. The Analysis of Multimeric Monoclonal Antibody Aggregates. Waters Corporation, Application Note, [serial on the Internet]. 2013; (720004713EN).
  4. Stephan Koza, and Kenneth J. Fountain. Successful Transfer of Size-Exclusion Separations between HPLC and UPLC. Waters Corporation, Application Note, [serial on the Internet]. 2014; (720005193EN).

720005202, October 2014

Back To Top Back To Top