• Application Note

Polymer Analysis by MALDI-Tof MS

Polymer Analysis by MALDI-Tof MS

  • Henry Shion
  • Nicholas Ellor
  • Waters Corporation

Abstract

Molecular weight is an important parameter for synthetic polymers because it relates directly to their physical properties. 

The most commonly used techniques to characterize synthetic polymers, such as osmometry, cryscopy, end-group titration and light scattering, only yield an average molecular weight and do not yield any information about chemical structure or chain branching, etc. 

Other methods, such as gel permeation chromatography (GPC) and high performance liquid chromatography (HPLC), separate the oligomeric components of the polymer system with limited resolution. 

Furthermore, the accuracy of molecular weight values is limited by the need to calibrate against reference compounds. 

Thus these techniques are not suitable for the determination of absolute molecular weight distributions of the individual components of the polymer distribution. 

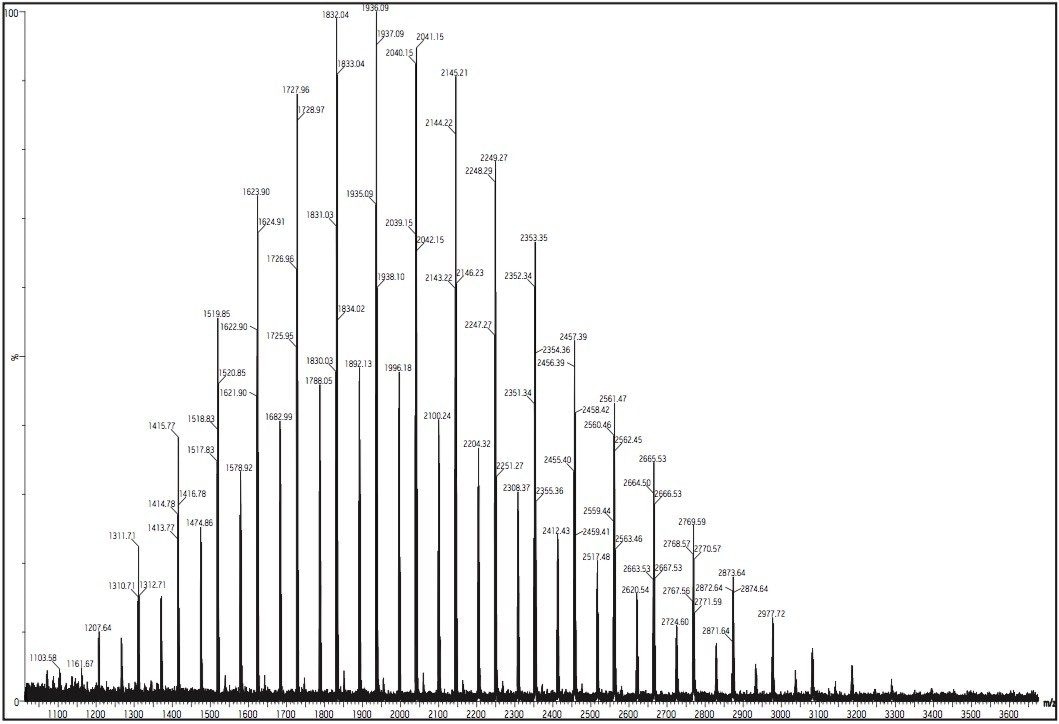
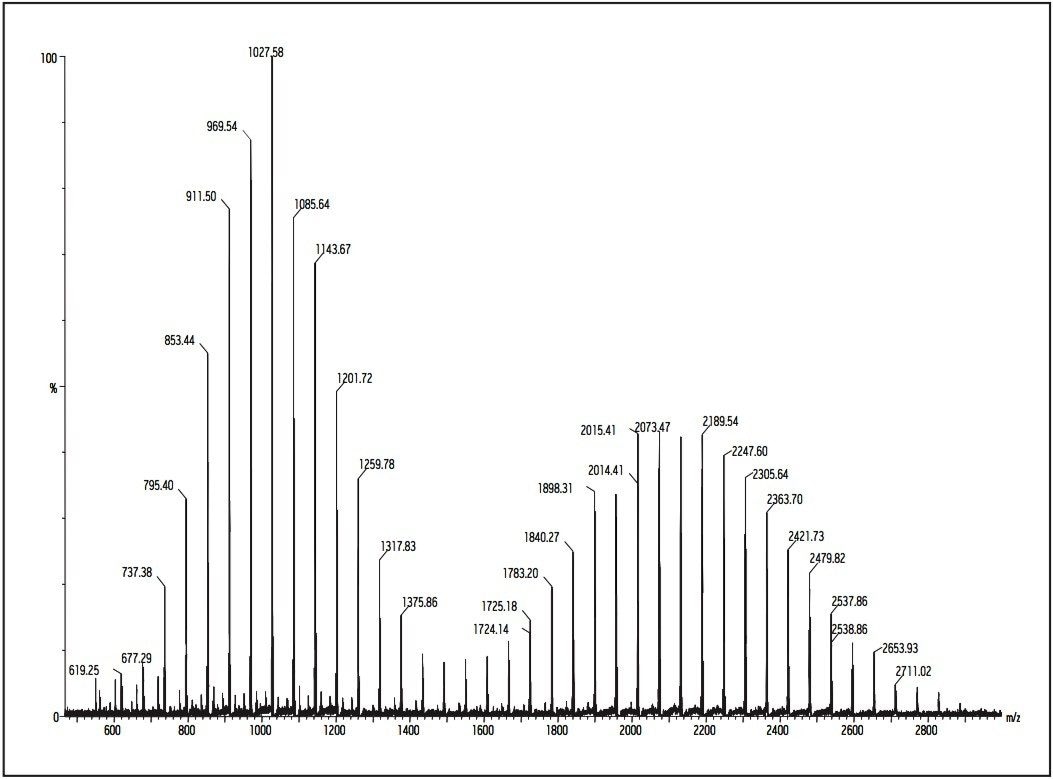
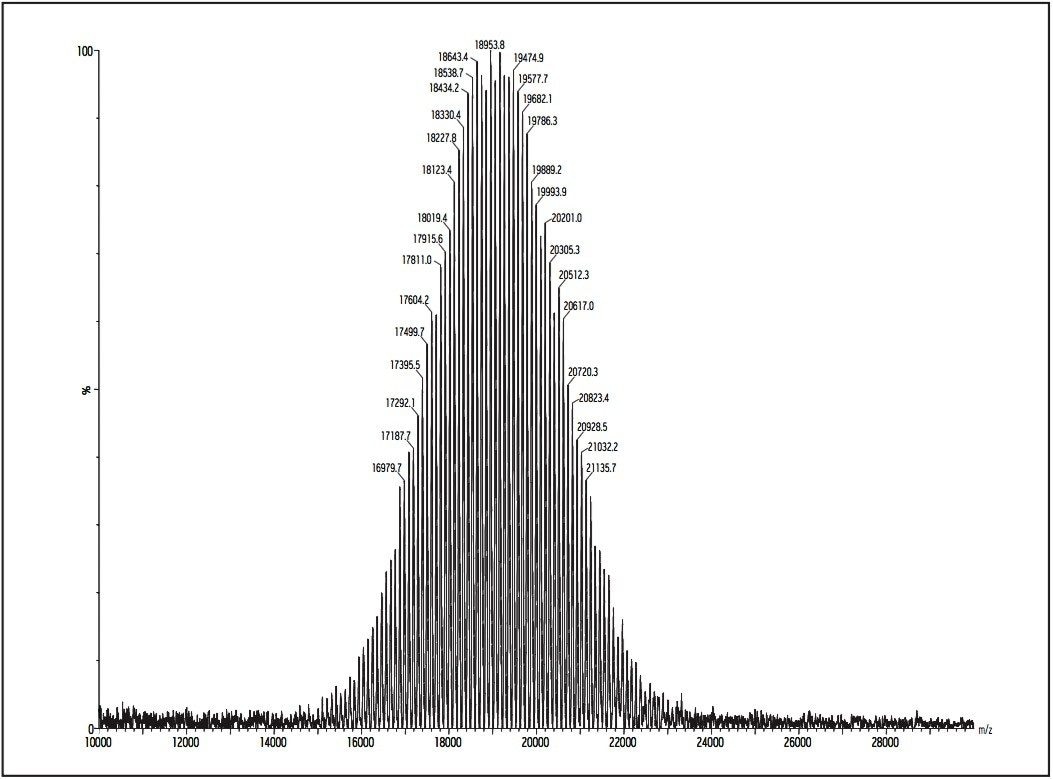
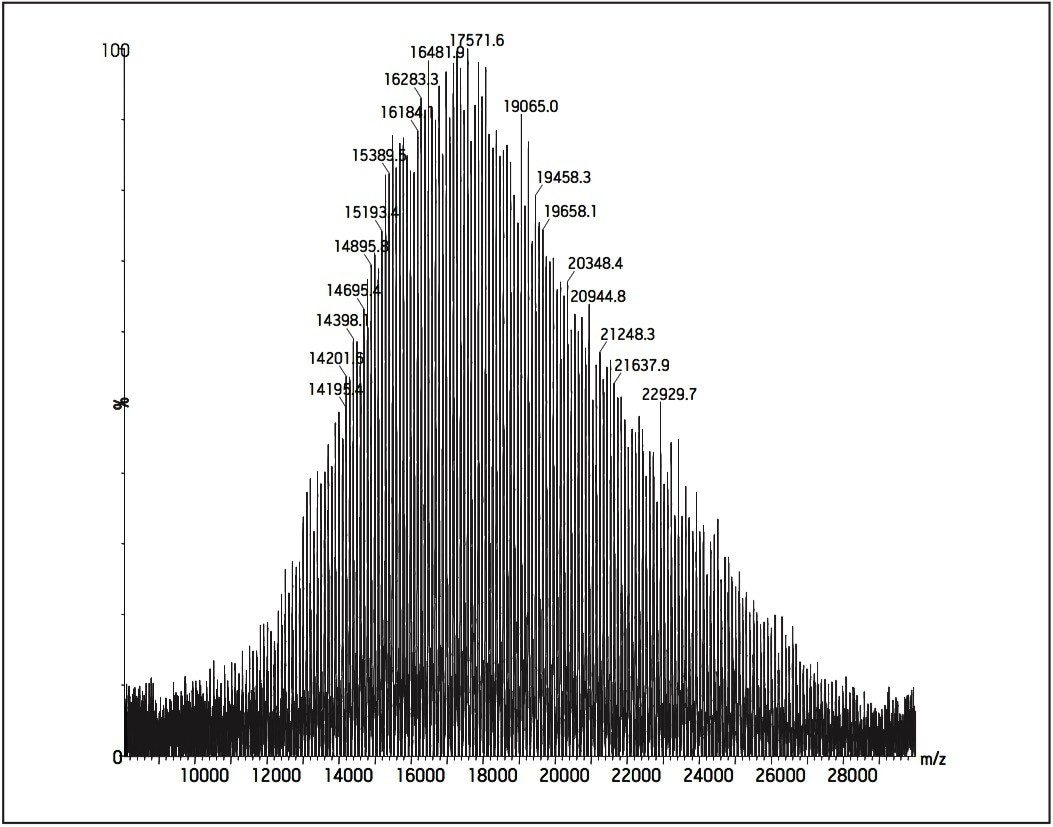
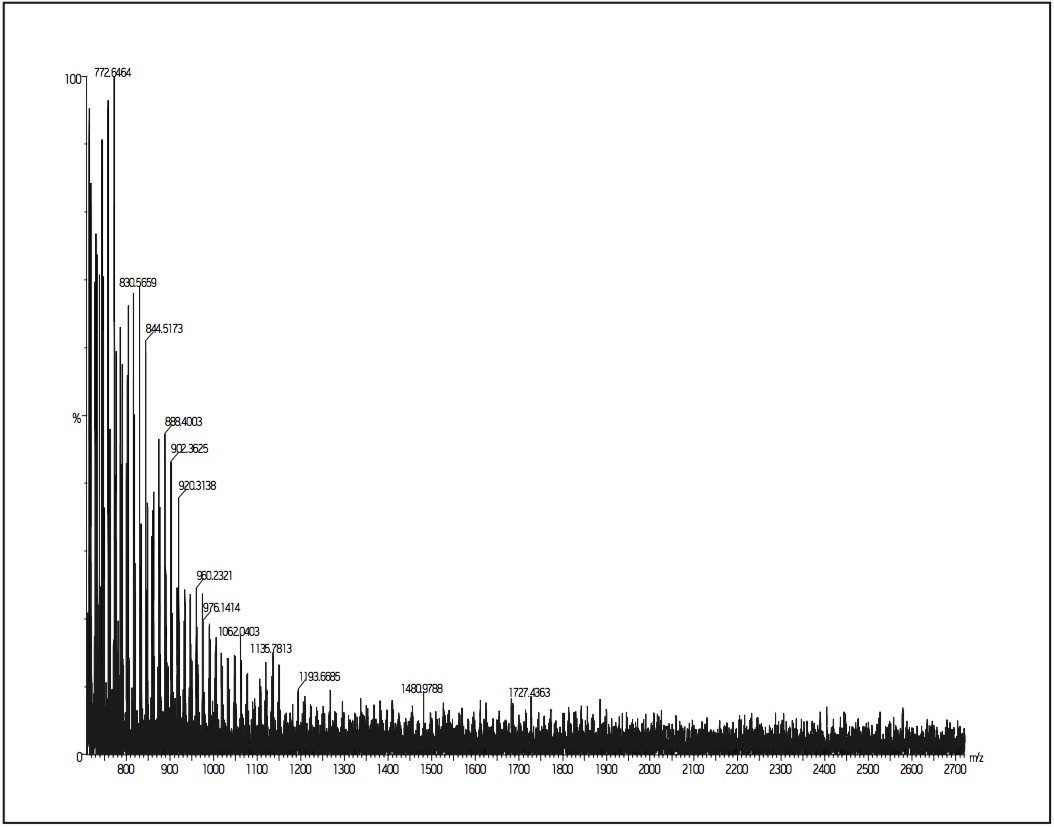
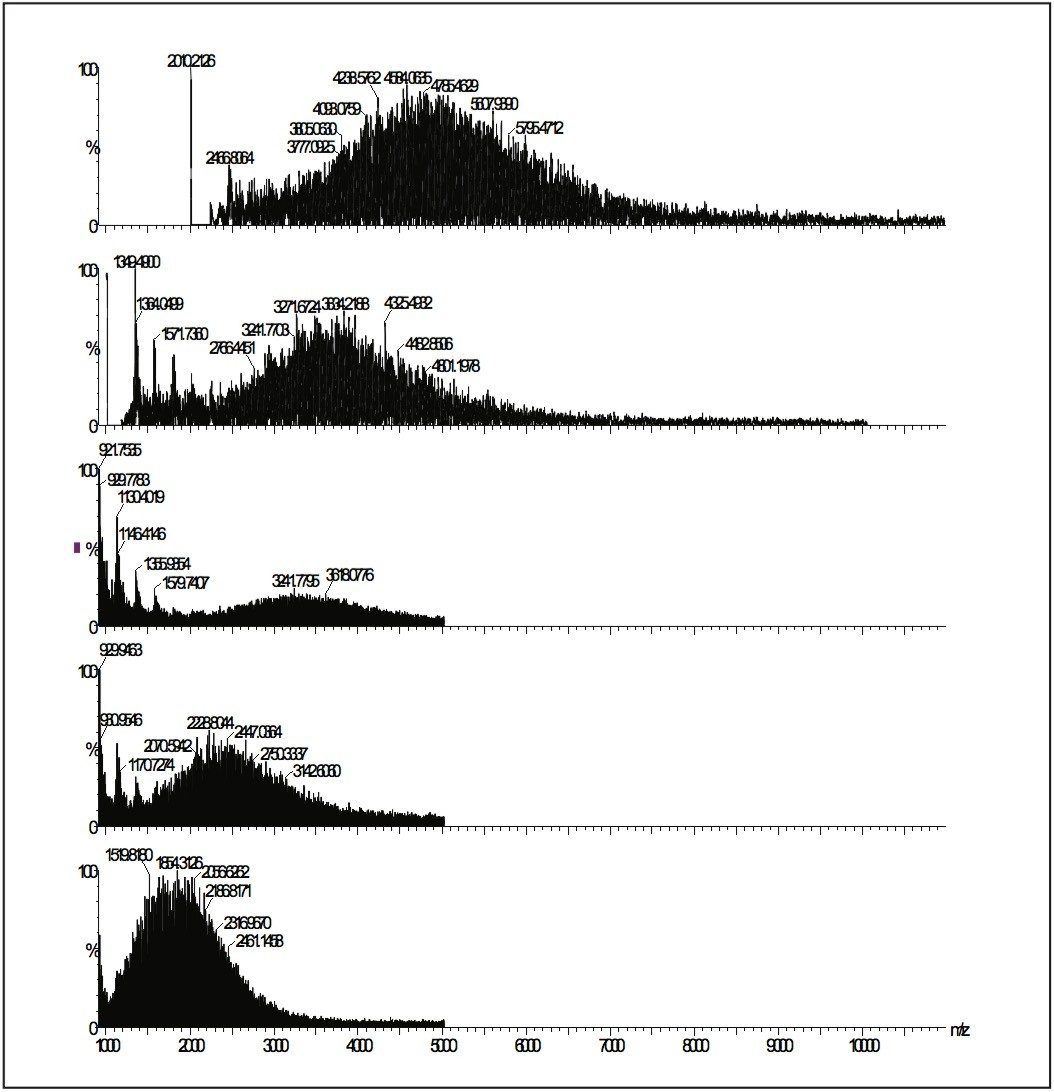
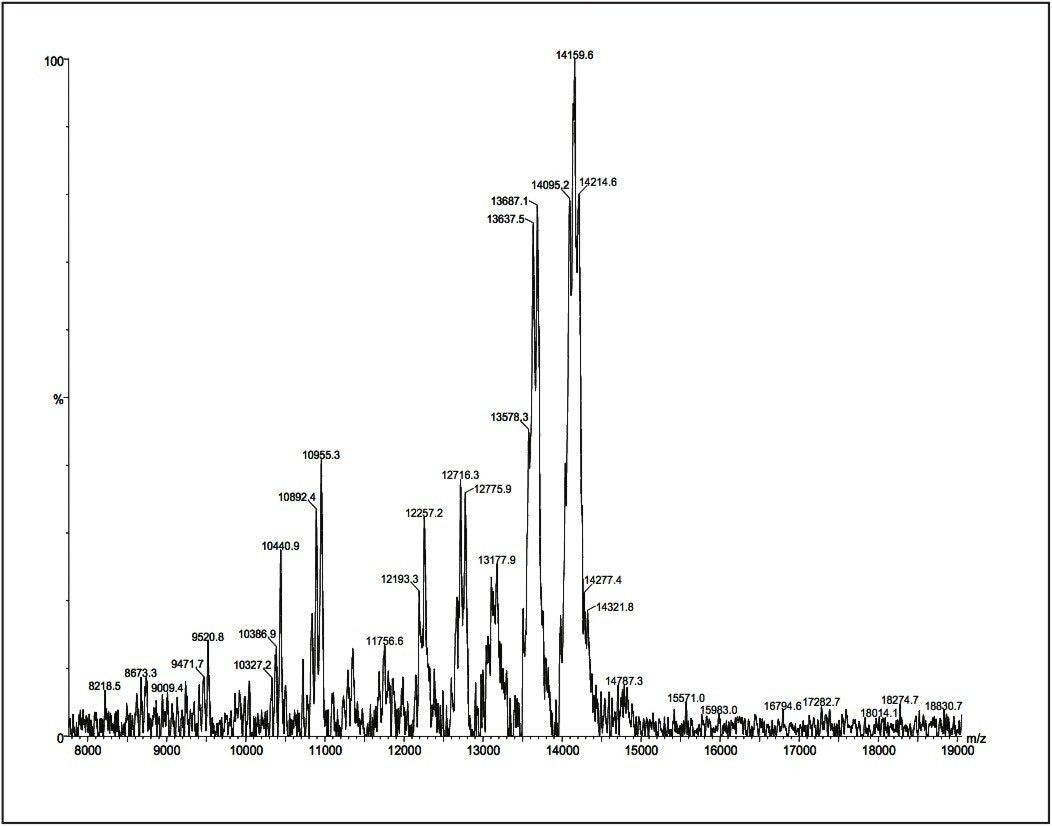
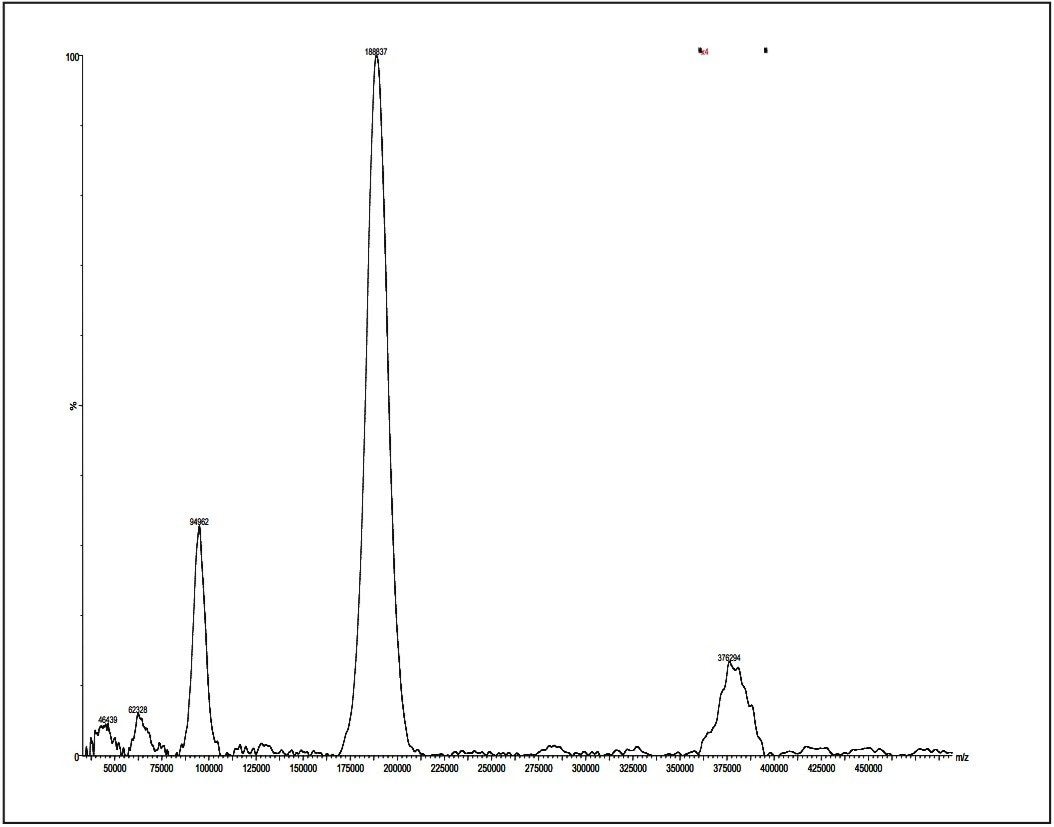
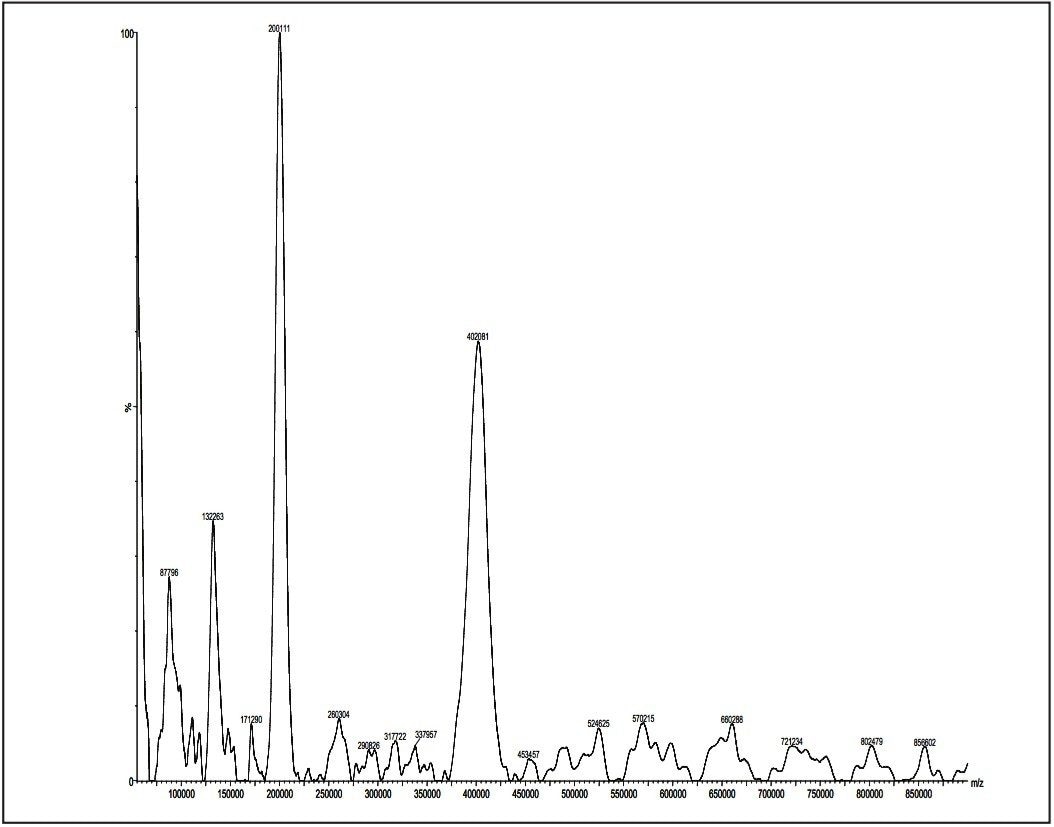
MALDI MS has an important advantage in synthetic polymer analysis: absolute molecular weights of oligomers can be determined, as opposed to obtaining relative molecular weights by chromatographic techniques. MALDI polymer analysis permits accurate determination of molecular weights from narrowly distributed polymers (polydispersity <1.2). 

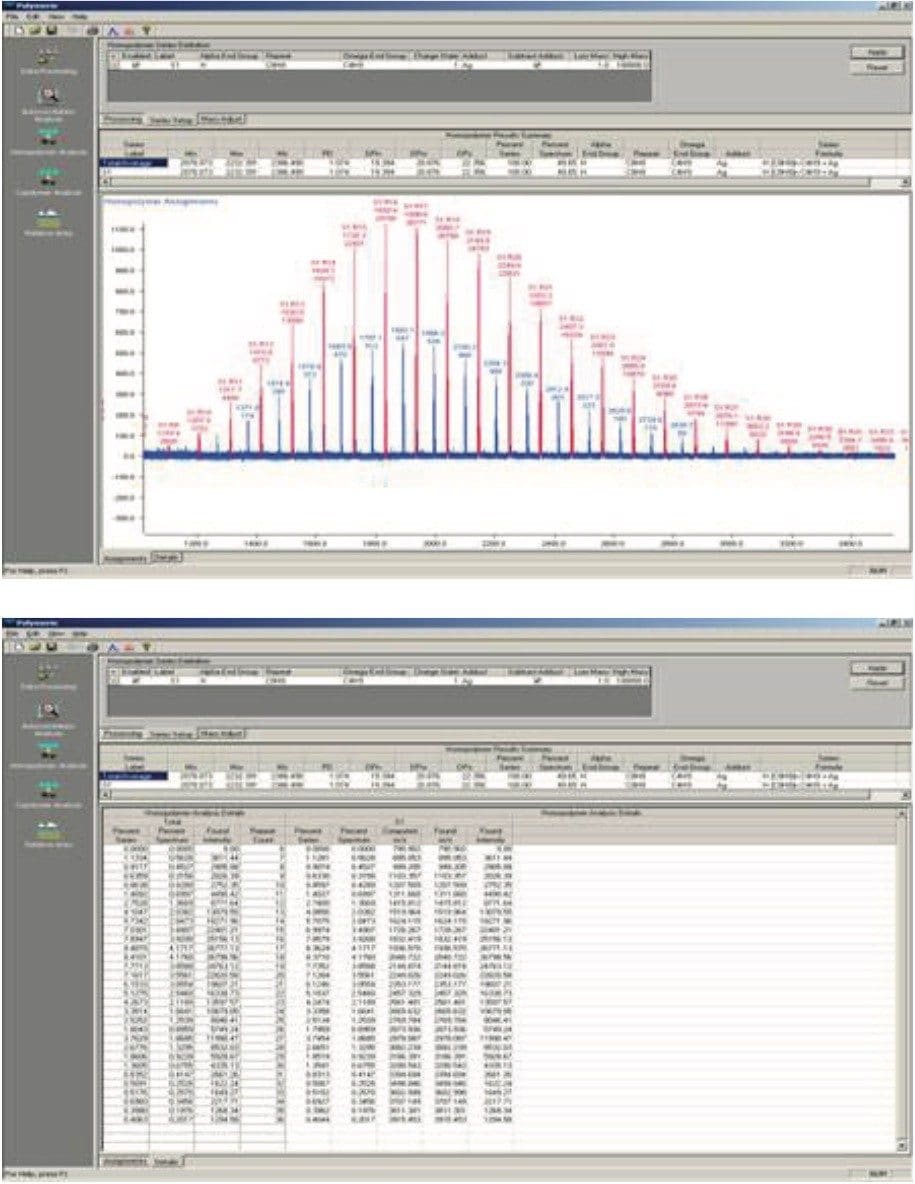
This application note demonstrates the use of the Waters MALDI micro MX for polymer characterization. This includes molecular weight averages (both the number [Mn] and weight [Mw] averaged molecular weights), polydispersity, mass of repeat units and end-group mass structure. 

Introduction

Polymer distributions are typically characterized by Mn and Mw, which are calculated from the formula: 

Mn = (NiMi)/Ni and Mw = (NiMi2)/NiMi

Ni and Mi are the abundance and mass of the ith oligomer, respectively. For the polystyrene 2000 MALDI MX spectrum (Figure 1), the molecular weight averages can be calculated directly from the spectrum: Mn = 2079, Mw = 2232, and polydispersity (D = MwMn) = 1.07, using programs such as Polymerix (Sierra Analytics, Modesto, CA, Figure 2 and 3) 

Figure 1. Polystyrene 2000 MALDI micro MX spectrum. 
Figures 2 and 3. Polymerix (Sierra Analytics) is used for molecular weight distribution measurement for Polystyrene 2000. 

The repeating mass unit of 104.063 confirms that the analyte is a styrene-based polymer. For the peak at m/z = 1934.083, it can easily calculate that the peak is a PS with 17 repeat styrene units (mass = 1769.071 Da). The difference of 165.012 mass units (1934.083 – 1769.071) is made up by the addition of 107.913 and 57.099 with 107.913 is the average mass of the silver atom (from silver-cationized PS ions). Mass 57.099 is the butyl end group. 

In this case, MALDI results provide good confirmation of the polymer structure. The technique can accurately determine the masses of oligomers, confirming that MALDI is a useful tool for end-group analysis as well as product confirmation. 

Experimental

The major difference between MALDI analysis of proteins/peptides and synthetic polymers is in the ionization process. For protein/peptide MALDI analysis, most samples are ionized through protonation; for synthetic polymer MALDI experiments most samples are ionized by cationization. 

Some polymers, such as polyethylene glycols and polymethylmethacylate form ions with alkali metals (added to the sample or simply present as an impurity) in the form of MLi+, MNa+, and MK+, etc. Others, such as polystyrene, undergo a cationization process which preferentially involves transition metal ions, such as silver and copper.1 The actual mechanism of the cationization process remains unclear, but it appears that as the result of a gas phase collision between cation and polymer chain, the cation will link itself in some fashion to an electron-rich site on the polymer chain. 

Therefore, it is more challenging to analyze unknown polymer samples by MALDI MS than unknown peptides and proteins samples because of the sample preparation issues. Very often different MALDI MS sample preparation methods (matrices, solvents, adding/removing salts, etc.) are employed for different types of polymers. Here are some of the examples from MALDI polymer analysis experiments.

Figure 4. Polypropylene glycol 1000 and 2000 (1 mg/mL) mixture MALDI micro MX spectrum. DHB (10 mg/mL) was used as the matrix. Data was acquired in reflectron mode. All major peaks are sodiated peaks. 
Figure 5. Polystyrene 19K (5 mg/mL in THF) MALDI micro MX spectrum. Dithranol (50 mg/mL) was used as the matrix. AgTFA (5 mg/mL) was added to the matrix and sample. Data was acquired in linear mode. All major peaks are silver cationized peaks. 
Figure 6. Polymethyl methacrylate 20K (1 mg/mL) MALDI micro MX spectrum. Dithranol (25 mg/mL) was used as the matrix. Data was acquired in linear mode. All major peaks are sodiated peaks. 

Results and Discussion

GPC MALDI Polymer Analysis

Although MALDI MS has been used widely to provide molecular weight and structural and compositional information of synthetic polymers, one limitation of the technique is that it fails to provide correct molecular-weight values for polydisperse polymers (polydispersity, Mw/Mn >1.2). 

To overcome this limitation, the output of GPC can be coupled to the MALDI micro MX system by collecting GPC fractions and performing MALDI analysis off-line. The average molecular weight of each fraction is then determined, allowing calibration of the GPC curve against absolute molecular weight. The calibrated GPC trace can then be used to compute average molecular weight and molecular-weight distribution of the unfractionated polymer samples.

Here is an example of GPC MALDI analysis for Poly-(DL-Lactideco- glycolide) (PLG). OLG polymers are biocompatible and biodegradable polyesters used in drug delivery. Molecular weight data for these polymers is of importance as it relates to performance characteristics. PLG polymers are usually highly polydisperse (Pd >1.5), thus present a challenge for MALDI analysis. Figures 7 and 8 show MALDI data obtained before and after GPC (Waters Styragel HR2 4.6 x 300 mm on a Waters 616 pump with 600S controller) separation. 

Figure 7. Poly-(DL-Lactide-co-glycolide) (1 mg/mL) MALDI micro MX spectrum before GPC separation. Dithranol (10 mg/mL) was used as the matrix. Data was acquired in reflectron mode. All major peaks are sodiated peaks. The spectrum does not reflect the real molecular distribution of the polymer sample. 
Figure 8. Poly-(DL-Lactide-co-glycolide) (1 mg/mL) MALDI micro MX spectrum after GPC separation. Dithranol (10 mg/mL) was used as the matrix. Data was acquired in reflectron mode. All major peaks are sodiated peaks. The molecular weight distribution of the polymer sample can be calculated by combining the spectra. 

MALDI analysis of polyamidoamine (PAMAM) dendrimers PAMAM dendrimers represent an exciting new class of macromolecular architecture called “dense star” polymers. Unlike classical polymers, dendrimers have a high degree of molecular uniformity, narrow molecular weight distribution, specific size and shape characteristics, and a highly-functionalized terminal surface. The manufacturing process is a series of repetitive steps starting with a central initiator core. Each subsequent growth step represents a new generation of polymer with a larger molecular diameter, twice the number of reactive surface sites, and approximately double the molecular weight of the preceding generation. 

First discovered in the early 1980s by Dr. Donald A. Tomalia2 at Dow Chemical, these polymers were called dendrimers to describe their tree-like branching structure. Figure 9 shows the polymerization process of dendrimers. 

Figure 9. Polymerization of polyamidoamine (PAMAM) dendrimer. 

Because of the structure, dendrimer samples tend to grasp as much salt as possible from the surroundings; thus better results are obtained by desalting the samples before mixing with the matrix. The common matrix used for dendrimer samples is DHB (2,5-dihydroxybenzoic acid). 

Figure 10 is a MALDI spectrum for polyamindoamine 3 (PAMAM3, third generation). Fragmentations from the branches of the intact dendrimer molecule are often observed in MALDI spectrum. 

Figure 10. Polyamidoamine 3 (PAMAM3) (1 mg/mL) dendrimer MALDI micro MX spectrum. DHB (10 mg/mL) was used as the matrix. Data was acquired in linear mode. All major peaks are sodiated peaks. 

Post acceleration detector (PAD) Higher molecular weight samples have less sensitivity in MALDI experiments. This is especially true when the molecular weights (distributions) of polymer samples are more than 50K Dalton. Therefore, a post acceleration detector (PAD) is equipped for all MALDI micro MX, to increase sensitivity for higher molecular weight analytes. 

Figures 11 and 12 show two examples for polystyrene 190K and 410K, using PAD on the MALDI micro MX for the improvement of sensitivity.

Figure 11. Polystyrene 190K (5 mg/mL) MALDI micro MX spectrum. All-trans retinoic acid (75 mg/mL) was used as the matrix. AgTFA (5 mg/mL) was added to the sample. Data was acquired in linear mode with PAD on. All major peaks (including dimer at m/z of 380K and doubly charged peak at m/z of 95K) are silver cationized peaks. 
Figure 11. Polystyrene 410K (75 mg/mL) MALDI micro MX spectrum. All-trans retinoic acid (75 mg/mL) was used as the matrix. AgTFA (5 mg/mL) was added to the sample. Data was acquired in linear mode with PAD on. All major peaks (including doubly charged peak at m/z of 205K and triply charged peak at m/z of 137K) are silver cationized peaks. 
Waters MALDI micro MX 

Conclusion

Excellent data acquired from the MALDI micro MX have been shown for polar polymers such as polypropylene glycol; non-polar polymer, such as polystyrene; poly-dispersed polymer, such as poly-(DL-lactide-co-glycolide); dendrimer, such as polyamidoamine; and higher mass polymers such as polystyrene 189K and 410K. This application note has demonstrated that MALDI micro MX is an ideal instrument for polymer analysis.

Acknowledgment

Thanks to Marten Snel (Waters MS Technologies Centre, Market Development Proteomics, Manchester, UK) for constructive discussions and Martin Palmer (Waters MS Technologies Centre, Validation, Manchester, UK) for PMMA data. 

References

  1. Karas, M., Hillenkamp, F. Anal. Chem. 60, 2299, 1988. 
  2. Dow Patent 4,289,872 (published 1981, filed 1979). 

720002100, February 2007

Back To Top Back To Top