Lubricants are widely used in industrial, automotive, aviation, and marine applications and are critical in the performance of engines, turbines, gears, or other machines. Traditional lubricants are mineral oil-based. Today, synthetic lubricants are gaining more attention because of their superior properties under extreme operating conditions.1 Antioxidants are major components in the lubricant additive package and have the strongest influence on the useful life of the lubricant.
Analytical techniques that have been applied to analyze antioxidants in lubricants include Liquid Chromatography (LC), Gas Chromatography (GC), Thin-Layer Chromatography (TLC), and Fourier Transform Infrared spectroscopy (FTIR).2 Using these techniques, analysts can obtain the type and concentration information of antioxidants, which is important in quality control and lubricant monitoring applications. Currently available LC analytical methods are based on large particle size columns (≥5 μm) and were developed more than a decade ago.3,4 These methods have long analysis times of more than 20 min, and may not provide accurate antioxidant quantification.5
Thus, it is desirable to improve this analysis for faster runtime and more accurate quantification. With new solvent delivery design, sub-2-μm column particles, and innovative detector designs, Waters UPLC Technology offers better separation efficiency than HPLC and more sensitive detection. It is an ideal solution for this application.
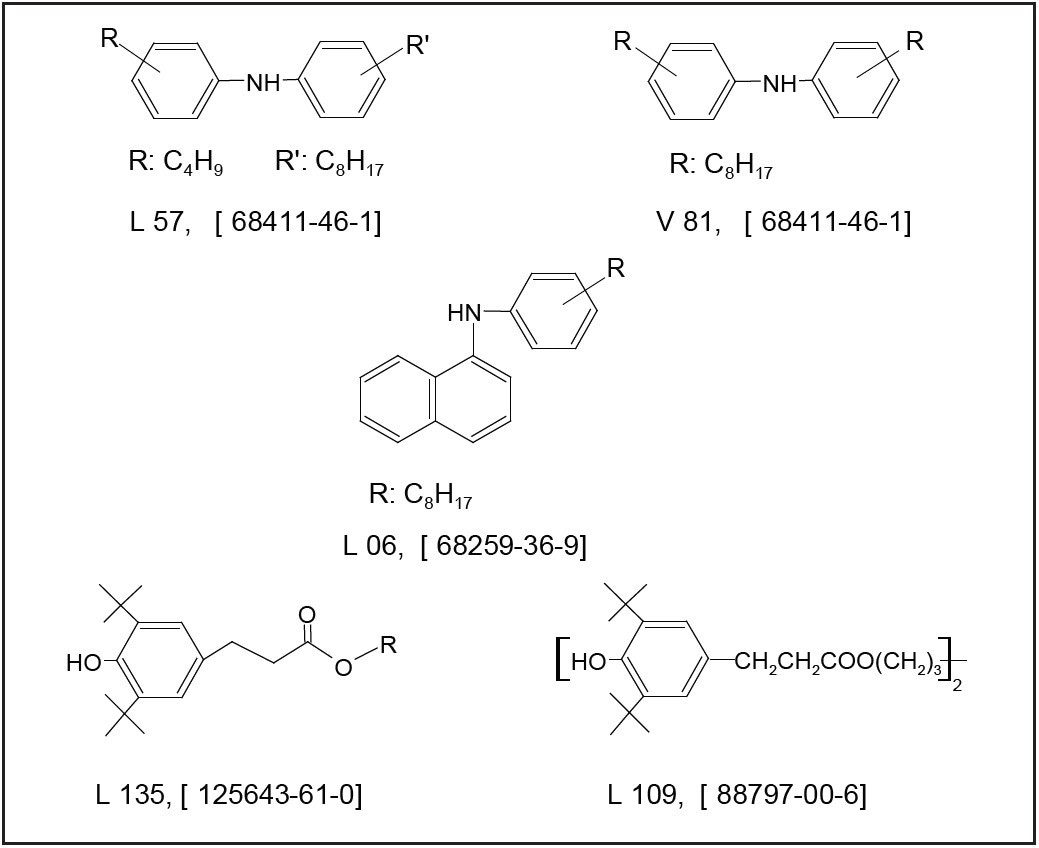
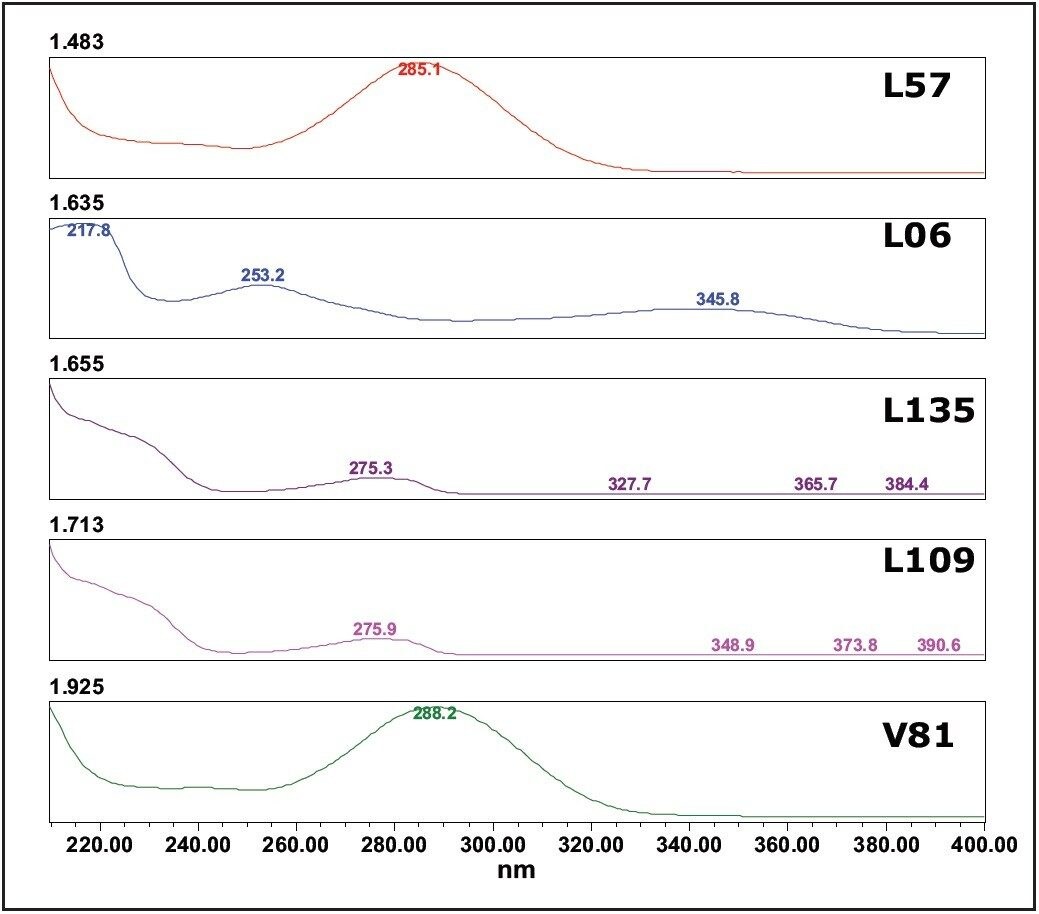
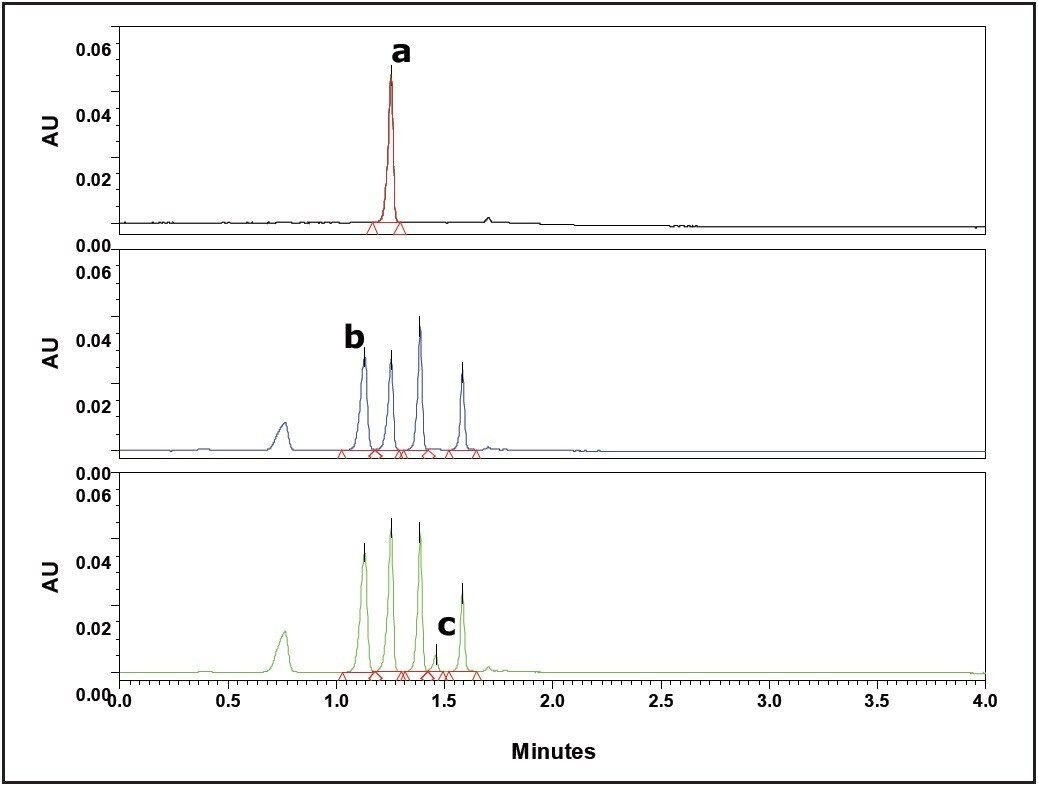
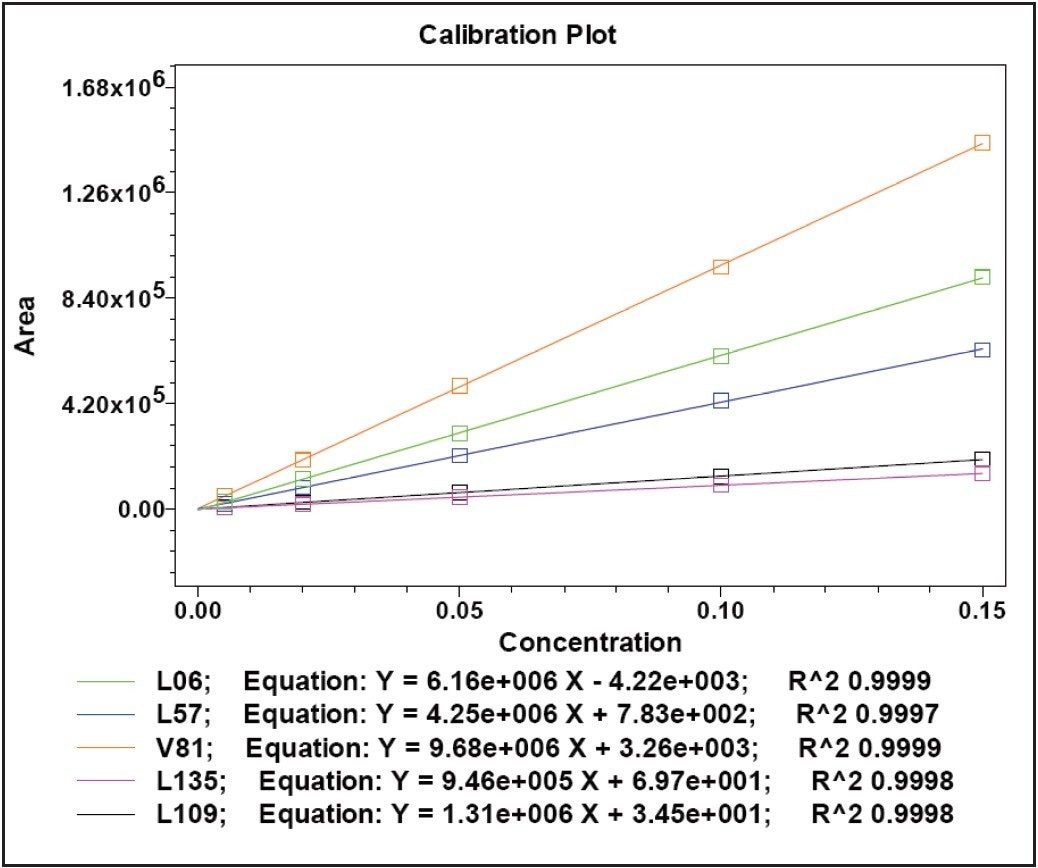
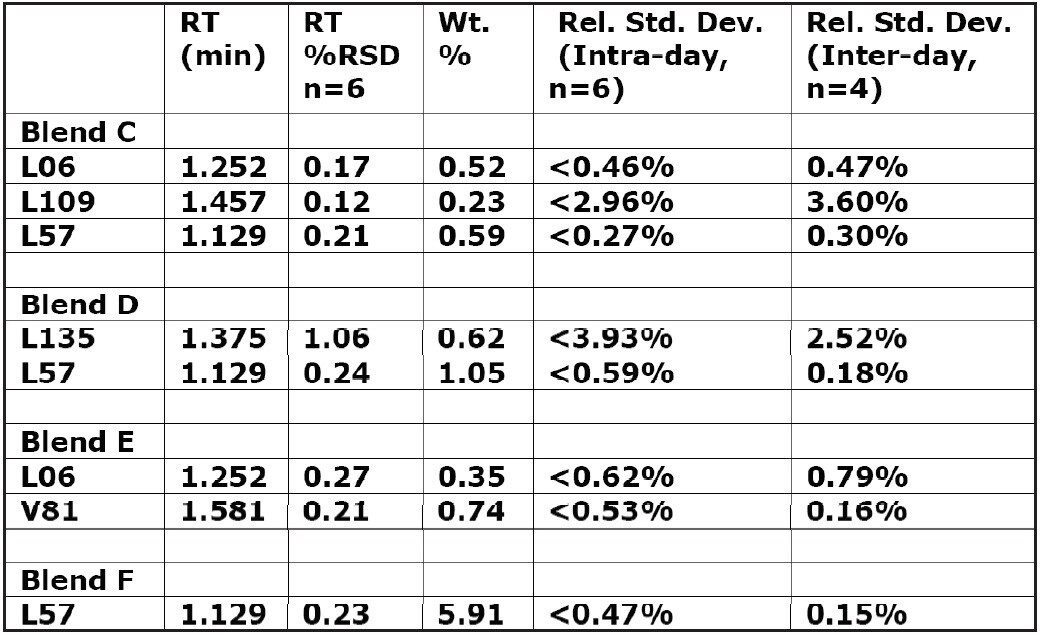
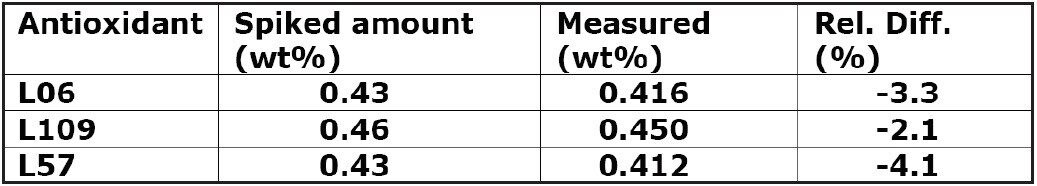
This application note describes a rapid analysis of phenolic and diphenylamine antioxidants in synthetic lubricants using the Waters ACQUITY UPLC System with the PDA Detector. This methodology provides accurate and reproducible quantification of antioxidant packages with a 6 min total runtime per sample. This reliable and rapid method can assist the antioxidant package QC, and has the potential to be used as a complementary method for determining the remaining useful life of lubricants. In addition, the use of environmentally-friendly solvents,6 methanol and 2-propanol, combined with fast runtimes and low flow rate, provide additional safety benefits and cost savings in hazardous waste solvent disposal.