This is an Application Brief and does not contain a detailed Experimental section.
DESI imaging represents a significant enhancement in the capabilities of mass spectrometers to analyze and determine spatial localization and molecular distribution of target molecules within a variety of samples. Use of DESI imaging has the advantages of requiring minimal sample preparation to collect a wealth of molecular information. When optimized, the technique allows for either multiple analyses of a single sample (with different MS polarities if desired) or enables additional visualization techniques (i.e. staining) to be performed on the sample after DESI imaging is complete. As seen is these examples, DESI imaging has been shown to be very effective in analyzing small molecules such as lipids or other small molecule cellular metabolites.
DESI imaging provides effective and meaningful molecular spatial localization within a variety of samples with minimum sample preparation.
In the past few years, mass spectrometry imaging (MSI) has seen a rapid increase in interest and utilization in areas such as proteomics, biomarker discovery and validation, drug distribution, and clinical research. MSI was originally developed using a matrix assisted laser desorption ionization (MALDI) mass spectrometer, where the sample is prepared by first coating it with an ionizable matrix. Then, the sample is placed under vacuum and a rastering laser is used to ioninze molecules in the sample for analysis by a TOF mass spectrometer.
More recently, an ambient ionization technique called desorption electrospray ionization (DESI) was introduced and applied to MSI to allow for the direct analysis of surfaces at atmospheric pressure. DESI imaging uses a charged jet of solvent to deposit micro-droplets onto a surface where analytes are extracted and desorbed into the gas phase at ambient pressure and temperature. Subsequently, they are drawn into the MS inlet where they can be analyzed using a TOF-MS. This technique is compatible with Waters SYNAPT G2-Si or Xevo G2-XS Mass Spectrometers.
To perform a DESI imaging experiment, a fresh frozen thin tissue section is mounted onto a glass slide directly from the cryostat or freezer. The slide is placed onto the 2D linear moving stage of the DESI source without any other pre-treatment. An optical image is taken and co-registered with the High Definition Imaging (HDI®) Software (Figure 1B). This optical image is then used to define the rectangular area to be imaged. The surface of the tissue section is rastered line-by-line using the DESI sprayer with a mass spectrum collected at predefined X,Y coordinates. The pixel size in the X-direction is defined by the speed of the stage movement and acquisition rate of mass spectra. The pixel size in Y-direction is defined by the distance between two lines of acquisition. Typically, DESI imaging experiments are acquired with pixel sizes of 50 μm or more.
Raw imaging data is subsequently processed and visualized within the HDI Software (Figure 1D). When using optimized DESI imaging conditions, the sample is preserved to such an extent that the tissue section can be haemotoxylin and eosin (H&E) stained directly after MS acquisition (Figure 1E). This allows the H&E stained optical image to be overlaid with the DESI molecular images from the same tissue section.
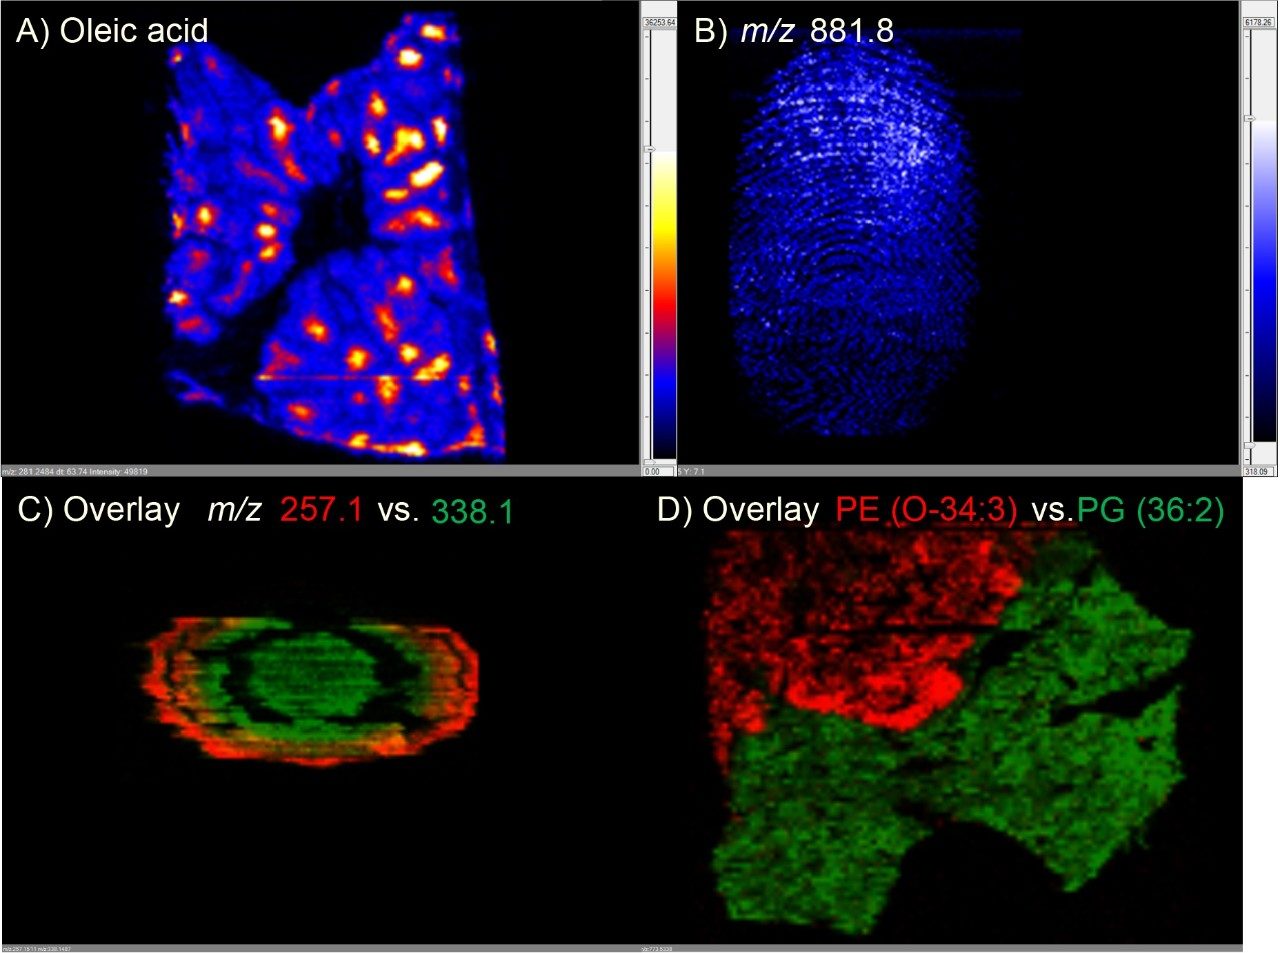
Figure 2 displays ion images of lipids species from consecutive mouse brain sections;1 one acquired in positive (green) ionization mode and one acquired in negative (red) ionization mode, using a solvent of 90:10 methanol: water, at a pixel size of 100 μm. Both polarities provide DESI MS spectra very rich in small molecules and phospholipid species that localize into specific features within the mouse brain.
DESI imaging, being a surface analysis technique, can be applied to numerous types of samples, varying from animal and human tissue samples, to plant material, pharmaceutical tablets, and even isolated bacterial colonies on agar. Figure 3 shows a selection of ion images from a variety of samples acquired using a range of pixel sizes from 100 to 200 μm, measured either in positive or negative ionization mode. Figure 3A is an ion image of oleic acid in porcine liver, highly concentrated in the center of the liver lobules co-localized with the central vein. Figure 3B shows the potential to apply DESI imaging to forensic trace evidence analysis by capturing molecular images from a fingerprint. Figure 3C displays the overlay of two small molecules, differentially distributed within a bacterial colony grown on agar1. Figure 3D illustrates the analysis of a human tissue sample2 that contains both normal tissue and a secondary tumor tissue. The distribution of two lipids m/z 698.51 (PE (O-34:3)) and m/z 773.53 (PG (36:2)) specifically correlates to the identity of the tissue type. In this example PE (O-34:3) is specifically localized within the tumor region.
DESI imaging represents a significant enhancement in the capabilities of mass spectrometers to analyze and determine spatial localization and molecular distribution of target molecules within a variety of samples. Use of DESI imaging has the advantages of requiring minimal sample preparation to collect a wealth of molecular information. When optimized, the technique allows for either multiple analyses of a single sample (with different MS polarities if desired) or enables additional visualization techniques (i.e. staining) to be performed on the sample after DESI imaging is complete. As seen is these examples, DESI imaging has been shown to be very effective in analyzing small molecules such as lipids or other small molecule cellular metabolites.
The advantages of DESI imaging include:
720005297, February 2015