• Application Note

Comparison of Sub-3-µm HP-SEC Columns for the Analysis of IgG Antibody Aggregates (HMWS) and Fragments (LMWS)

Comparison of Sub-3-µm HP-SEC Columns for the Analysis of IgG Antibody Aggregates (HMWS) and Fragments (LMWS)

  • Stephan M. Koza
  • Weibin Chen
  • Waters Corporation

This is an Application Brief and does not contain a detailed Experimental section.

Abstract

The performance of the Waters BioResolve SEC mAb, 200 Å, 2.5 µm, 7.8 x 300 mm Column was compared to three commercially available SEC sub-3-µm, 7.8 x 300 mm columns, for the separation of the aggregates (HMWS), monomers, and fragments (LMWS) of cetuximab, a therapeutic mAb. Comparisons were made using the mobile phase each column manufacturer has previously reported on for the separation of cetuximab on either the same SEC column or a column presumed to have similar particle surface chemistry but different particle or column size. The BioResolve SEC mAb Column provided the most efficiency (USP plates) and possessed one of the lowest USP tailing values among the columns tested. Comparable resolutions were observed between the monomer and the dimeric HMWS between the columns tested, while two of the larger pore-diameter columns provided slightly more separation between the multimeric and dimeric HMWS. Lastly, the BioResolve SEC mAb Column produced superior resolution between the mAb monomer (150 kDa) and LMWS (50 kDa and 100 kDa). 

Benefits

  • Improved performance using the Waters BioResolve SEC mAb Column for mAb (cetuximab) fragment analysis while providing comparable aggregate analysis in comparison with several commercially available SEC columns.
  • A column (7.8 x 300 mm) and particle size (2.5 µm) with previously demonstrated compatibility with HPLC, UHPLC, and UPLC LC systems.
  • Improved efficiency and peak tailing performance versus commercially available SEC, sub-3-µm, 7.8 x 300 columns for improved separations of mAbs and other comparable-sized therapeutic proteins. 

Introduction

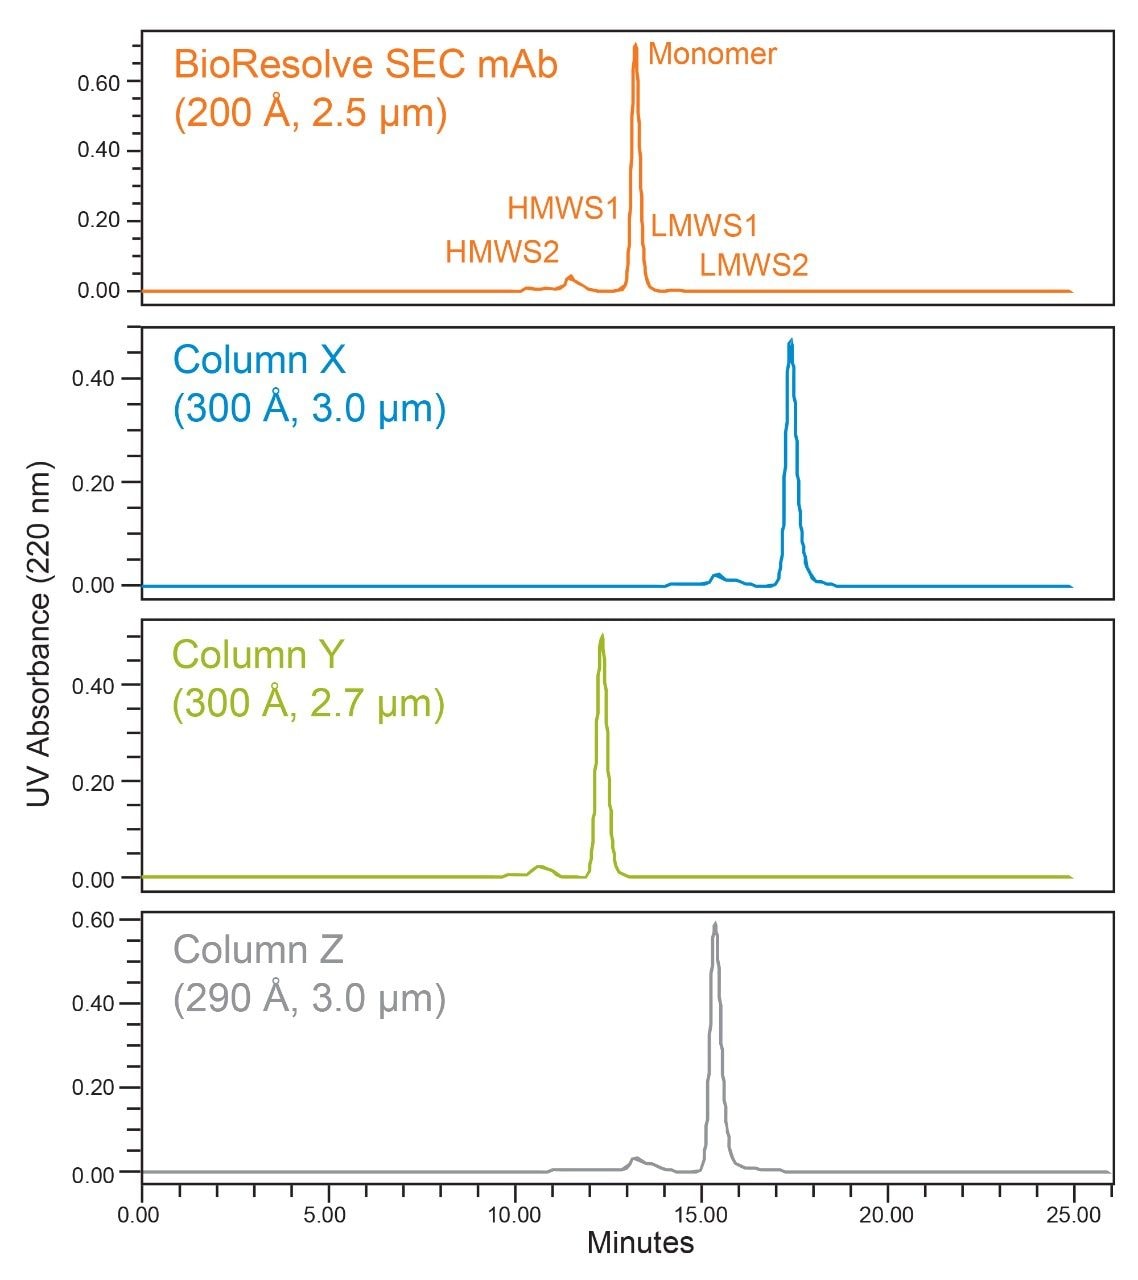
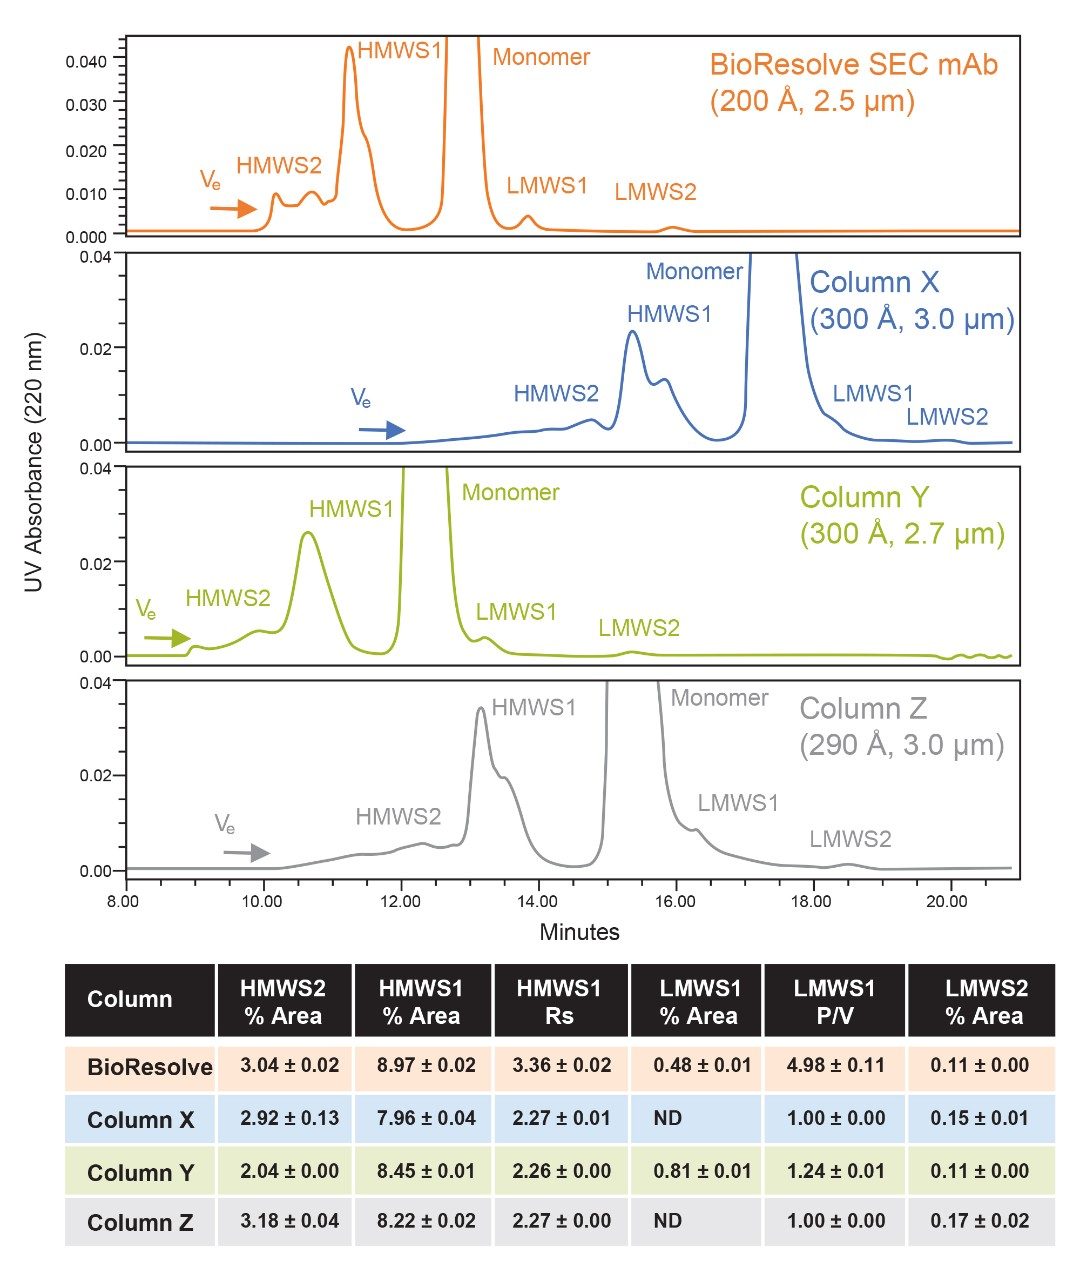
Size-exclusion chromatography (SEC) has been the method of choice for the routine assessment of protein aggregation (high molecular weight species, HMWS) and has also been used for the non-denatured analysis of protein fragments (low molecular weight species, LMWS).1 LMWS for many mAb biotherapeutics are the result of proteolytic cleavage at the IgG hinge region resulting in an Fab-Fc LMWS (LMWS1, ~100 kDa) and Fab and Fc domains (LMWS2, ~50 kDa).2

While multiple HPLC SEC (HP-SEC) columns in series or reduced linear velocity can be used to provide the efficiencies needed to reliably separate LMWS1 from the mAb monomer, this separation has generally been performed using higher efficiency UPLC-SEC (UP-SEC) columns with particle diameters of 2 µm and smaller to enable reasonable analytical throughput.3 While SEC columns packed with sub-2-µm particles can provide the highest sample throughputs for the analysis of HMWS, these columns are typically manufactured with internal diameters (I.D.) of 4.6 mm, and as a result when used for the analysis of LMWS1, UPLC systems with exceedingly low and well-controlled dispersion volumes must be employed in order to obtain consistent separations and reproducible relative LMWS1 peak areas.3,4

As a result, an HP-SEC column with a 200 Å pore diameter and 2.5 µm BEH particles packed in larger format 7.8 mm I.D. column hardware (XBridge Protein BEH SEC, 200 Å, 2.5 µm Column, p/n: 186009164) was developed to effectively bridge the performance gap between the UPLC-SEC columns. This column provides for more robust and easily transferred analyses with less dependency on the extra-column dispersion of the LC systems being used while increasing analysis time by 50% or less.5 This general purpose column has since been reoptimized with respect to column packing to specifically improve upon the separation of IgG mAb monomer and LMWS1 to produce the BioResolve SEC mAb, 200 Å, 2.5 µm, 7.8 x 300 mm Column (p/n:186009441).

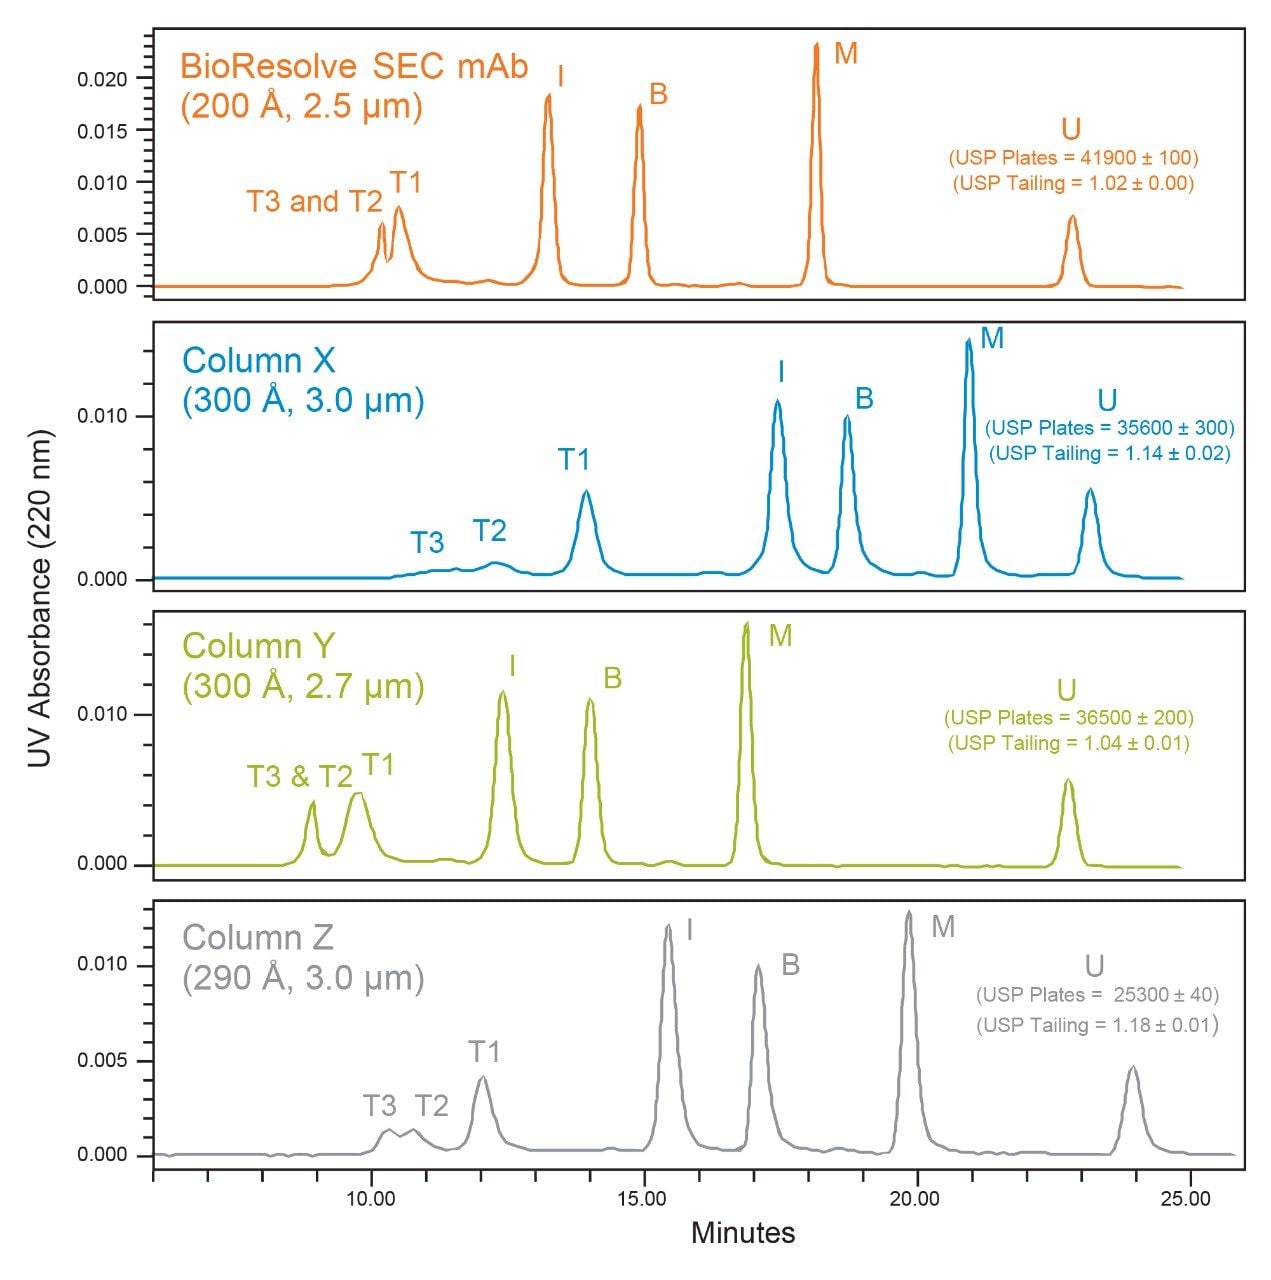
The goal of this study was to demonstrate the performance of the BioResolve SEC mAb, 7.8 x 300 mm Column in comparison to three commercial SEC, sub-3-µm, 7.8 x 300 mm columns. The performance fundamentals of efficiency and peak shape, and the separation of the HMWS and LMWS of a mAb were compared. Almost invariably, SEC vendor column comparisons are made using the same mobile phase that a vendor has optimized for their column to evaluate other manufacturer’s columns. To avoid the potential bias that this approach presents, we identified a therapeutic mAb (cetuximab) for which several column vendors have published their SEC separation method details (i.e., mobile phase composition) for either the same column tested in this study or for a column that appears to have the same SEC particle chemistry with either a change in particle size or column hardware. 

Results and Discussion

The Waters BEH200 SEC Protein Standard Mix (p/n: 186006518) was used for the comparison of the BioResolve SEC mAb, 200 Å, 2.5 µm, 7.8 x 300 mm Column and the three commercial SEC, sub-3-µm, 7.8 x 300 mm columns. A visual comparison of the respective chromatograms and the separation conditions used for each column are presented in Figure 1. We observed that all four columns had comparable pore volumes (within 10%, data not shown) based on the difference between the elution volumes of thyroglobulin multimer (T3) and uracil (U). However, it was noted that the relative elution volumes of the individual protein standards varied. We observed the most similarities between the BioResolve Column and Column Y, while the separations on Column X and Column Z appeared relatively similar. These differences related predominantly to the average pore diameter of the packed particles and are most clearly observed in the separations between thyroglobulin monomer (T1) and the HMWS of thyroglobulin (T2 and T3) that are more resolved on Column X and Column Z due to their larger pore diameters. Conversely, we observed more separation between IgG (I) and BSA (B) for the BioResolve Column and Column Y due to their smaller pore diameters. We will later see how these pore diameter differences are manifested in the mAb separations.  

Figure 1. Shown are the separations of Waters BEH200 SEC Protein Standard Mix (injection volume 3 µL) on a BioResolve SEC mAb, 200 Å, 2.5 µm, 7.8 x 300 mm Column, and three equally sized commercial SEC columns, containing sub-3-µm particles. Peak identifications are: thyroglobulin multimer (T3, ≥1.98 MDa), thyroglobulin dimer (T2, 1.32 MDa), thyroglobulin monomer (T1, 660 KDa), IgG (I, 150 KDa), BSA (B, 66 KDa), myoglobin (M, 17 KDa), and uracil (U, 112 Da). USP plate counts for uracil are based on tangent method, and USP tailing is measured at 5% peak height (n = 2). Mobile phases were: 50 mM sodium phosphate pH 7.0, 200 mM potassium chloride for the BioResolve Column; 200 mM sodium phosphate, pH 6.7 (NaOH) for Column X; 50 mM sodium phosphate, 150 mM sodium chloride, pH 7.4 (NaOH) for Column Y; and 50 mM potassium phosphate, 250 mM potassium chloride, pH 6.8 (KOH) for Column Z. Flow rate was 0.50 mL/min, at-column temperature was 25° C. Analysis was performed in duplicate on an Empower 3 controlled ACQUITY UPLC H-Class Bio System with a 5σ dispersion volume of 14 µL. Value uncertainties represent the range.

As one measure of relative SEC column performance, we compared separation efficiencies using the tangential USP plate count (N) method for uracil (U)which is the total included SEC marker. The measured plate count was higher for the BioResolve Column as was predicted due to that column having the smallest sized particles of the SEC columns tested. If plate height (H = L/N, where L is column length) is normalized for particle size (reduced plate height, h = H/dp, where dp is particle diameter) we saw that Column X (h = 2.81) and Column Y (h = 3.04) were more comparable to the BioResolve Column (h = 2.87) indicating that Column X and Column Y are also packed efficiently.

We then looked at USP tailing as a measure of column packing quality. As USP tailing approached a value of 1.0, the peak was more symmetrical. USP tailing is a measure of peak symmetry at 5% peak height. Here we saw that the BioResolve Column and Column Y produce relatively symmetrical peaks, while Column X and Column Z produced peaks that tail slightly more. For the SEC separation of proteins, columns packed to tail slightly will result in improved separation of HMWS and monomer while degrading the separation of LMWS, and columns with more symmetrical peaks will provide a more consistent separation of both HMWS and LWMS.

The full-scale and expanded-view chromatograms for cetuximab are presented in Figures 2 and 3. In the full-scale chromatograms, we observe the same general trend in retention time as observed for the protein standards with sharp and relatively symmetrical peak shapes for the mAb monomer on all four columns. In the expanded view (Figure 3), we observe that the chromatographic profiles are well behaved with the baseline returning to its origin before the elution of LMWS2 for the BioResolve Column and Column Y, and immediately following LMWS2 for Column X and Column Z. This indicates that the mobile phases used for each column are reasonably appropriate. 

Figure 2. Shown are the full-scale separations of stressed Erbitux (cetuximab) drug product samples at a concentration of 2 mg/mL (injection volume 10 µL) using a BioResolve SEC mAb, 200 Å, 2.5 µm, 7.8 x 300 mm Column, and three equally sized commercial SEC columns containing sub-3-µm particles. Peak identifications are provided in the text, and additional experimental conditions are provided in Figure 1.
Figure 3. Shown are the expanded-scale separations of stressed Erbitux (cetuximab) drug product samples presented in Figure 2, and relevant tabulated percent area and separation quality results. Peak identifications are provided in the text. Ve represents the excluded volume of the column. Resolution (Rs) is determined based on USP half-height method. Peak-to-valley ratio (P/V) is based on LMWS1 peak height divided by the Monomer-LMWS1 valley height. HMWS1 resolution was determined in relation to the monomer. ND indicates that the value could not be determined. Samples were analyzed in duplicate, and listed uncertainties represent the range of the values.

We observe comparable separation between HMWS1 and the monomer for the four columns. While the USP half-height resolution for HMWS1 was 26-50% greater for the BioResolve Column, this value is confounded by the increased separation of a second HMWS1 size variant by the larger pore diameter columns. We also observe that the multimeric HMWS2 forms had an increased degree of separation on Column X and Column Z, consistent with the results observed for thyroglobulin in the SEC Protein Standard. The relative amounts of HMWS1 and HMWS2 were found to be variable, which is likely the result of sample instability following several freeze-thaw cycles, which is not recommended for this liquid formulation drug product. While they are provided (Figure 3), the relative amounts of HMWS1 and HMWS2 were not deemed to be critical for this comparison.

When considering the separation of the 50 kDa LMWS2 fragment, we observe that all four columns provide this separation. The percent peak area of this fragment is exceedingly low (~0.1%), and as a result, UV absorbance was monitored at 220 nm to improve signal-to-noise. The BioResolve Column and Column Y produced baseline resolution of LMWS2 and identical percent peak areas (0.11%). Column X and Column Y produced low-level tailing of the monomer peak resulting in partial resolution and ultimately artificially higher integrated HMWS2 percent peak areas.

For the separation of monomer and LMWS1, a discernable valley was only observed on the BioResolve Column and Column Y. The extent of this separation, as measured by the peak-to-valley ratio (P/V) for LMWS1, is significantly greater for the BioResolve SEC mAb Column with a P/V of 4.98 as compared to 1.24 for Column Y. This is likely the result of a more optimal pore diameter, increased plates, and decreased low level peak tailing for the BioResolve Column. The marginal resolution observed on Column Y also resulted in an artificially increased LMWS1 percent peak area (0.81%) versus the BioResolve Column (0.48%). As the abundance of LMWS1 decreases, it becomes more challenging to separate from the monomer and reliably quantify due to low-level tailing of the predominant monomer peak that can be caused by either the column or the LC system. Although not evaluated in this study, all four of the tested SEC columns appear to partially separate LMWS1 from monomer. As a result, reliable quantification may possibly be obtained, if the relative abundance of LMSW1 were higher in the sample. Otherwise, the separation efficiency would need to be improved by increasing column length or decreasing flow rate for these columns.

Conclusion

Currently, there are several commercially available SEC columns containing sub-3-µm particles and a 7.8 x 300 mm column geometry that can be effectively used for the analysis of HMWS and LMWS product-related impurities in mAb samples. These modern sub-3-µm SEC columns deliver significantly greater separation efficiencies than the previous generation of SEC columns containing 5 to 8 µm particles. Also, while 4.6 mm I.D. SEC columns containing sub-2-µm particles provide the greatest sample throughput for the separation of HMWS and LMWS, the reproducible analysis of LMWS1 can only be realized on extremely low dispersion UHPLC and UPLC systems. In contrast, an optimized modern 7.8 mm I.D., sub-3-µm SEC column can be used effectively on a wide range of HPLC system platforms while resulting in only a 33% or lower decrease in sample throughput.

The Waters BioResolve SEC mAb, 200 Å, 2.5 µm, 7.8 x 300 mm Column provided comparable separations of mAb HMWS1 (dimer) and monomer when compared to the commercially available and appropriately evaluated SEC columns. All of the evaluated SEC columns provided adequate and reliable separation between mAb HMWS1 and HMWS2 (multimer) with the smaller average pore diameter of the BioResolve SEC mAb Column and SEC Column Y generating less separation versus Column X and Column Z (which have greater average pore diameters).

For fragment analysis, the smaller average pore diameter of the BioResolve Column and Column Y provided comparable baseline separation of LMWS2 (50 kDa) and a discernable valley between LMWS1 (100 kDa) and mAb monomer. The BioResolve Column provided more separation of LMWS1 with an average P/V of 4.98 versus a P/V of 1.24 for Column Y. The reduced resolution of LMWS1 on Column Y and LMWS2 on Column X and Column Z resulted in the integrated relative areas of these impurities being artificially high in comparison to the values observed on the BioResolve Column.

The high efficiency and symmetrical peak shape of the BioResolve SEC mAb, 200 Å, 2.5 µm, 7.8 x 300 mm Column can provide high resolution separations of HMWS and LMWS for mAb-based therapeutics and similarly sized proteins on HPLC, UHPLC, and UPLC platforms.

References

  1. Hong, P.; Koza, S.; Bouvier, E. S. Size-Exclusion Chromatography for the Analysis of Protein Biotherapeutics and their Aggregates. J. Liq. Chromatogr. Relat. Technol. 2012, 35, 2923-50.
  2. Cordoba, A.J.; Shyong, B-J.; Breen, D.; Harris, R. J. Non-Enzymatic Hinge Region Fragmentation of Antibodies in Solution. J. Chromatogr., B. 2005, 818, 115-21.
  3. Koza, S. M.; Reed, C.; Chen, W. Impact of LC System Dispersion on the Size-Exclusion Chromatography Analysis of Monoclonal IgG Antibody Aggregates and Fragments: Selecting the Optimal Column Configuration for your Method. Waters Application Note, 720006336EN, 2018.
  4. Fekete, S.; Guillarme, D. Influence of Connection Tubing in Modern Size Exclusion Chromatography and its Impact on the Characterization of mAbs. J. Pharm. Biomed. Anal. 2018, 149, 22-32.
  5.  Koza, S. M.; Chen, W. High Resolution and High Throughput Size-Exclusion Chromatography Separations of IgG Antibody Aggregates and Fragments on UHPLC and HPLC Systems with 2.5 μm BEH Particles. Waters Application Note, 720006522EN, 2019.

Acknowledgements

We would like to thank Pamela Iraneta, Steve Shiner, and William Warren for their contributions toward this work.

720006985, August 2020

Back To Top Back To Top