Comparing ELSD and CAD Performance on Polysorbate Quantification in Infliximab Drug Products
Abstract
This application note reports a baseline subtraction processing method in Empower 3 achieving 0.01 mg/mL limit of detection (LOD) in polysorbate analysis via an evaporative light scattering detector (ELSD). A previously reported elution gradient is modified to successfully quantify polysorbate concentration in four Infliximab drug products (innovator and three biosimilars). Charged aerosol detector (CAD) was evaluated using the same method, which demonstrated comparable limits of detection and dynamic range to the ELSD.
Benefits
- Baseline subtraction improves limit of detection for intact polysorbate analysis in ELSD-based techniques
- ELSD is capable of quantifying intact polysorbate at formulation levels for biopharmaceuticals
- ELSD under Empower control offers a seamlessly integrated, easy-to-use platform with a powerful data processing solution
- ELSD provides comparable performance to CAD in polysorbate analysis
Introduction
Polysorbate (PS), due to its low toxicity and biocompatibility, is a common excipient for drug products with a wide variety of applications: as an emulsifier and solubilizer for small molecules, as a coating for drug delivery nanoparticles, as well as a stabilizer to prevent denaturing, aggregation, and adsorptive loss of protein in biopharmaceuticals. As an excipient, PS can be subjected to degradation in formulated drug products through oxidation, hydrolysis, and/or enzymatic pathways.1-3 To ensure PS-containing drug products are safe to administer and efficacious as designed over their shelf life, accurate quantification of PS is desired.
Polyoxymethylene sorbitan monooleate (PS80) and polyoxymethylene sorbitan monolaurate (PS20) are two polysorbates commonly used in biotherapeutics (Figure 1). Both types share a common ethoxylated sorbitan base structure that acts as a polar head group and differ by the hydrophobic ester tail presented in each (PS80 = oleate ester tail, PS20 = laurate ester tail). Due to its molecular structure, PS does not have chromophores that respond efficiently to ultraviolet-visible absorbance detection, which presents a challenge for intact analysis. Alternative methods employing a hydrolysis-based approach have proven to be successful in detecting free fatty acids via mass spectrometry (MS). While these methods offer a high degree of specificity and sensitivity, they may not always be suitable for manufacturing environments where MS accessibility can be limited and throughput is critical to maintain productivity.4 In this respect, there is a need for methods with alternative detection technologies that can be readily deployed in the analysis of PS80 to support the manufacturing process of biopharmaceuticals.
 Figure 1. Structure of polysorbate. Polysorbate is comprised of a hydrophobic ester tail (PS20 lauric acid, PS80 oleic acid) and a polar head.
ELSD is a popular option for analytes without UV-absorbing chromophores (e.g. sugars, alcohols). ELSD is an aerosol-based detection technology where the eluent is aerosolized by nitrogen and the subsequent droplets are heated to evaporate the mobile phase. The remaining dry analyte particles are then monitored for the amount of the light they scatter.5 CAD represents an alternative aerosol-based detection technology. Similar to ELSD, CAD starts with mobile phase entering the nebulizer, and a stream of nitrogen gas forms aerosol drops. These drops then enter an evaporative chamber, solvents are removed, then only dry analyte particles are left. Positively charged nitrogen ions transfer charge to the dry particles which are subsequently measured by an electrometer producing signals proportional to the analyte quantity.
To facilitate the deployment of these detectors in an industrial setting, it is critical that assays can accurately detect and report analytes at therapeutic levels in a consistent manner. In this study, both ELSD and CAD, controlled by Waters Empower 3 Chromatographic Data System, are evaluated under optimized conditions and the same chromatographic method for their ability to detect and accurately report the concentration of polysorbate in a panel of four therapeutic drug products prepared at therapeutic dosage levels.
Experimental
Sample Preparation
PS80 was purchased from Sigma Aldrich. PS80 stock solution was prepared in water at 1 mg/mL. PS80 standards were prepared by diluting the stock with water to 0.01, 0.03, 0.05, 0.07, 0.1, 0.3, 0.5, 0.7, and 1 mg/mL. Infliximab drug products, innovator Remicade, and three biosilimars, Avsola, Inflectra, and Renflexis, were purchased from Amerisource Bergen and prepared at the dosage concentration (10 mg/mL) as per manufacturer’s instructions. ELSD and CAD were serviced prior to the start of experiments to ensure both detectors were operating within the manufacturer’s specifications. The CAD was interfaced with Empower 3 via the SII software provided by the manufacturer.
LC Conditions
|
LC system: |
ACQUITY UPLC H-Class PLUS Bio System |
|
Vials: |
Waters TruView (p/n: 186005662CV) |
|
Columns: |
Oasis Max, 30 µm, 2.1 x 20 mm (p/n: 186002052) |
|
Column temp.: |
30 °C |
|
Sample temp.: |
5 °C |
|
Injection volume: |
10 µL |
|
Flow rate: |
1 mL/min |
|
Mobile phase A: |
Water (MS-grade), 2% formic acid v/v |
|
Mobile phase B: |
Isopropanol (MS-grade), 2% formic acid v/v |
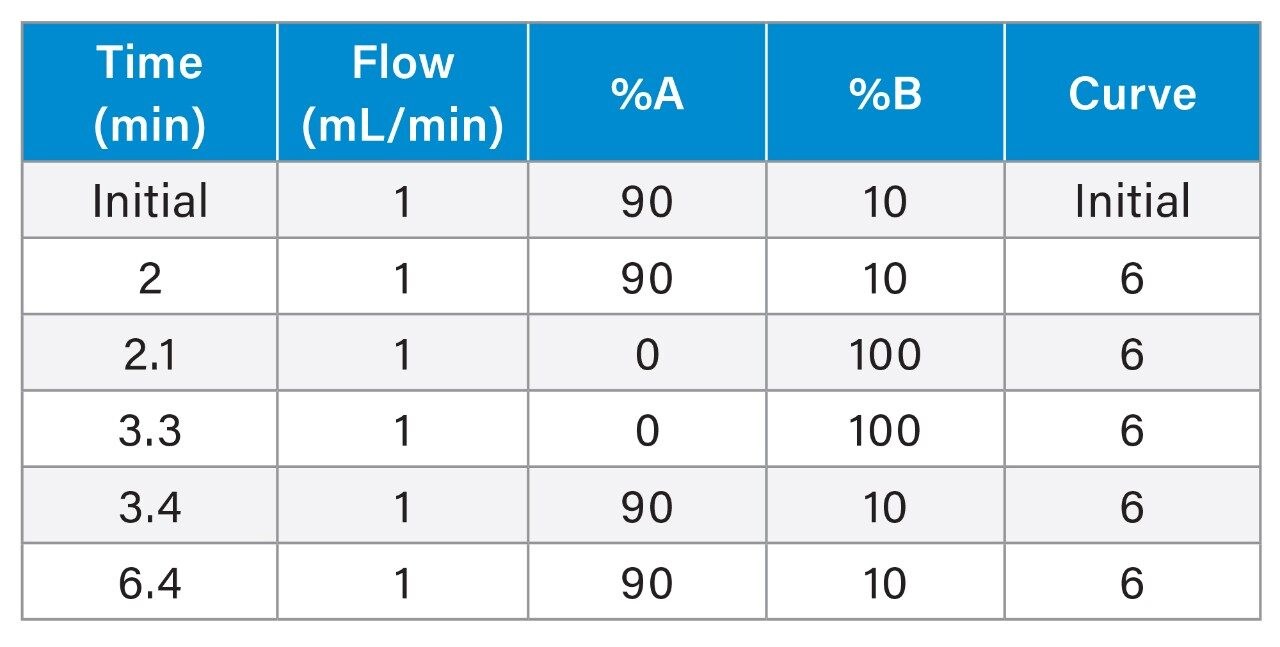
Gradient table
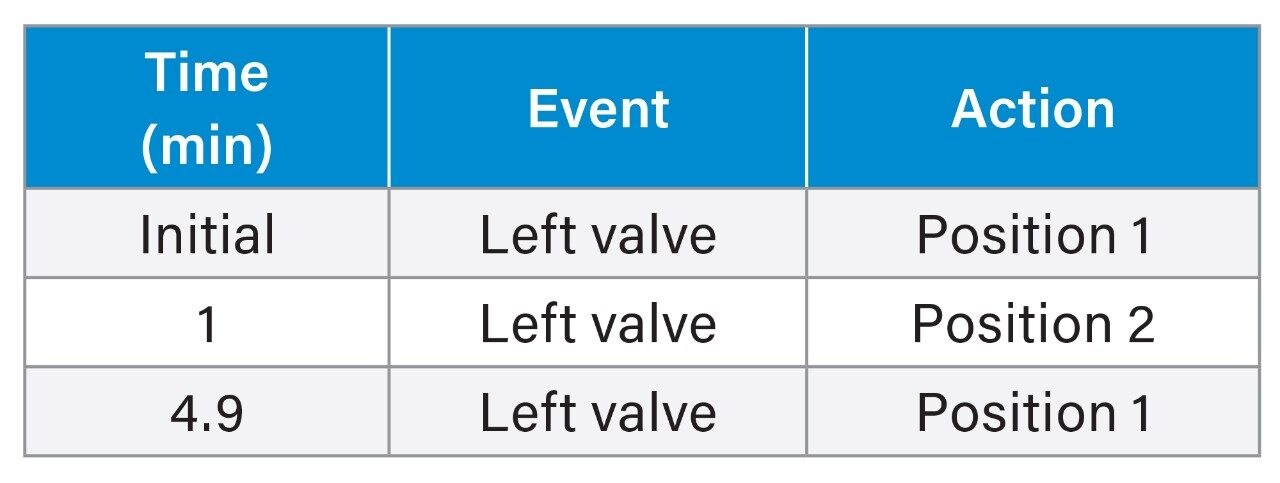
CM-A Events
ELSD Settings
|
Gain: |
100 |
|
Data rate: |
2 Hz |
|
Time constant: |
Slow |
|
Mode: |
Heating |
|
Power level: |
75% |
|
Drift tube temp.: |
80 °C |
|
Gas pressure: |
20 psi |
CAD (Corona Veo) Settings
|
Power function: |
1.2 |
|
Evaporation temp.: |
Low |
|
Data rate: |
2 Hz |
Results and Discussion
Using ELSD, it was previously shown that polysorbate could be monitored at an intact level in PS solutions spiked with protein.6 Briefly, a trap-and-elute method (Figure 2) was developed using a Waters column manager (CM-A) configured with a 6-port, 2-position valve. In this configuration, PS is adsorbed onto the stationary phase of an Oasis Max Column (anion exchange and reversed-phase sorbent) at a low pH, while the unretained protein and remaining excipients are directed to the waste (Figure 2A). Following the adsorption step, the valve position is switched, and the PS is eluted to the ELSD using organic solvent (Figure 2B). This proof-of-concept work showed that this method yields a linear relationship between the peak area and PS concentration when plotted on a log-log axis. This robust and fast method is used in this evaluation.
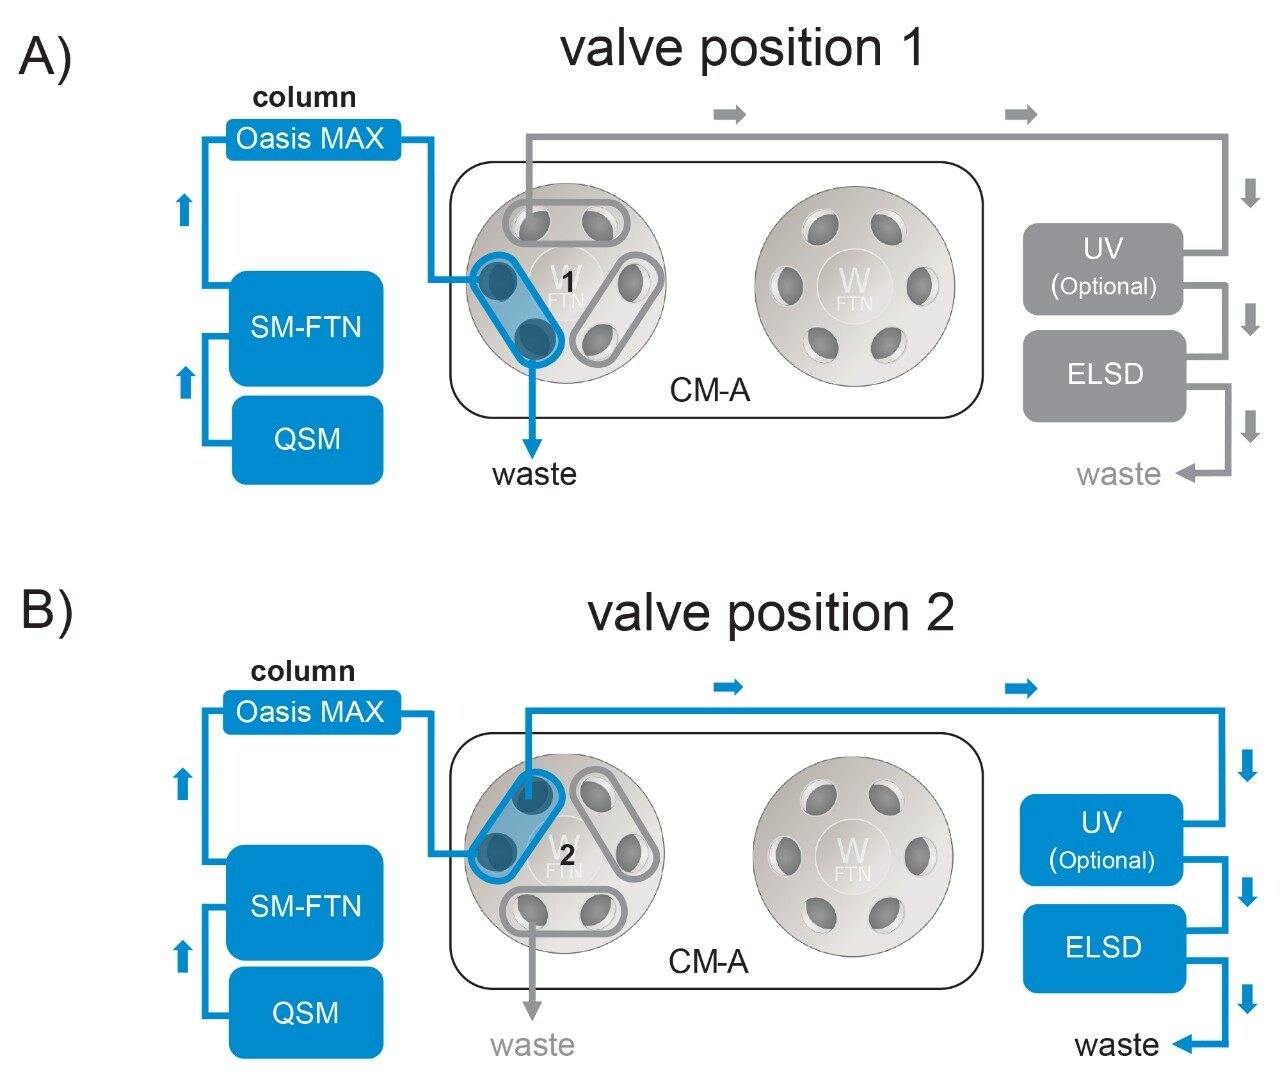 Figure 2. Fluidic diagram of the column manager.
A) At position 1, polysorbate is adsorbed onto the column, unretained protein and remaining excipients are directed to the waste.
B) Then the valve is switched to position 2, and the eluted PS is directed to the ELSD for quantification.
To facilitate the application of this method for biopharmaceutical formulations, where the PS concentration may be as low as 0.003% w/v (0.03 mg/mL), some considerations must be made with respect to the method and detector response. A stable baseline plays an important role in ensuring accurate and consistent detection at low concentration levels. This can be particularly challenging in trap-and-elute configurations where the rapidly changing mobile phase composition associated with the “step” elution gradient (Figure 3A, orange trace) can impede accurate detection and integration of analytes due to the baseline rise (Figure 3A, blue trace). To further illustrate the impact of the baseline, 10 µg of PS80 (10 µL, 1 mg/mL) was injected into an Oasis Max Column and eluted using a step gradient (see experimental). At a high mass load of 10 µg, the detector response was observed to be adequate for accurate integration (Figure 3B) with peak area RSD calculated as 0.08% for three replicate injections. However, when the mass load was reduced to concentrations below 1 µg of PS80 (10 µL, 0.1 mg/mL), manual curation of data was required due to baseline rise interference. An example of this is shown in Figure 3C where the baseline rise is the dominant response at a 0.1 µg mass load (10 µL, 0.01 mg/mL) and was being detected as part of the polysorbate peak. To improve the accuracy of integration at lower concentrations and detector response linearity, a baseline subtraction was applied to mitigate the impact of the baseline rise associated with the elution step. As shown in Figure 3D, when using baseline subtraction, the polysorbate peak could be reliably detected without manual curation of data using the same processing method to a concentration of 0.01 mg/mL in solution with an area RSD of 1.02%. Using this baseline subtraction method, the linear range of the ELSD was improved by an order of magnitude (0.01–1 mg/mL) as shown in Table 1.
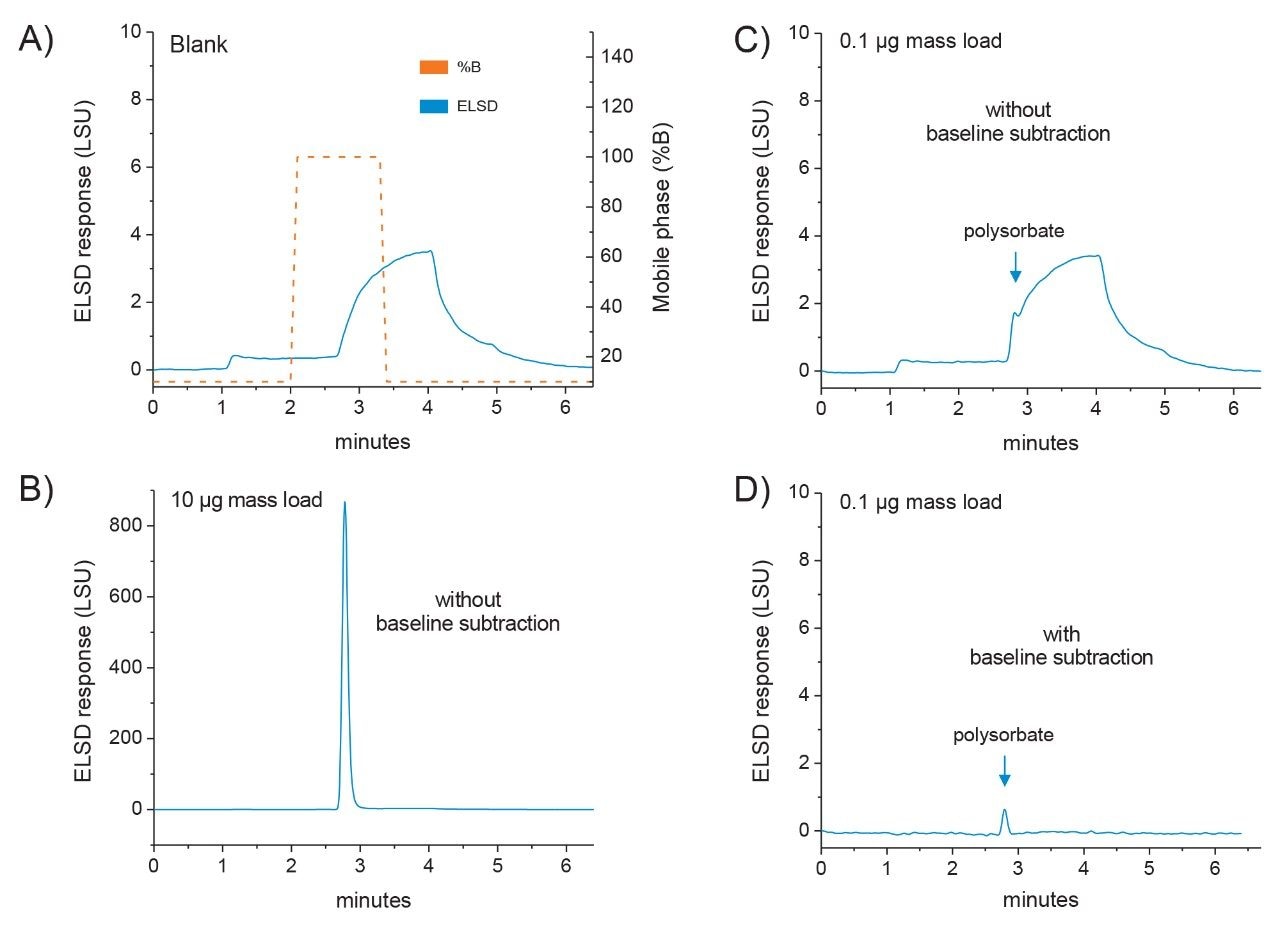 Figure 3. ELSD response baseline and effects of baseline subtraction.
A) Baseline response (blue trace) and gradient of organic mobile phase (orange trace) of the trap-and-elute configuration.
B) ELSD response of a high mass load (10 µg). Baseline rise does not impact integration processing method.
C) ELSD response of a low mass load (0.1 µg). Baseline rise requires manual curation of data.
D) ELSD response of a low mass load (0.1 µg) after baseline subtraction. The polysorbate peak is not affected by the baseline and could be reliably detected and integrated with a processing method.
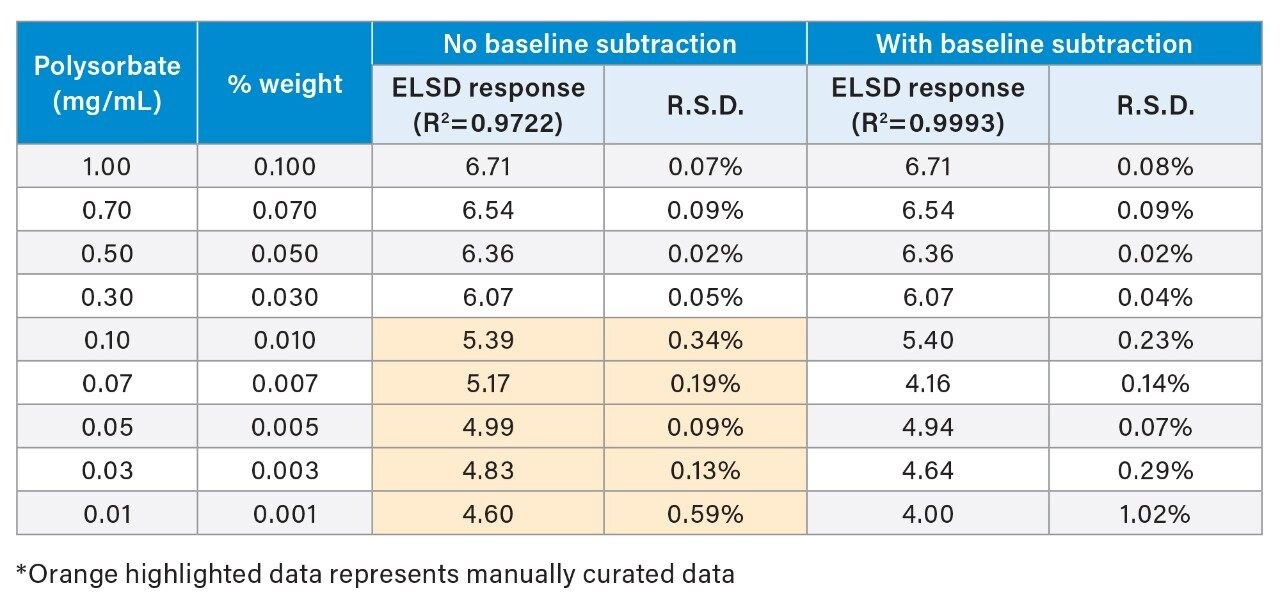 Table 1. ELSD response (log area)
To evaluate the applicability of the optimized method, intact polysorbate analysis was performed for four PS-containing Infliximab drug products including the innovator (Remicade) and three biosimilars (Avsola, Inflectra, and Renflexis). A 9-point calibration curve was generated using the optimized method. As shown in Figure 4A, the ELSD was observed to have good linearity (R2=0.993) within the selected concentration range (0.01–1 mg/mL). For these samples, PS80 concentration is listed as 0.05 mg/mL for all samples, which is well within the dynamic range of the ELSD method. Three repeat injections of the reconstituted solution were performed, and PS80 concentration was determined using the calibration plot (Figure 4A, orange data point). As shown in Figure 4B, the ELSD method showed good assay consistency with RSD calculated between 1%–2.5%. The calculated PS80 concentration was determined to be 0.045, 0.045, 0.044, and 0.042 mg/mL for Remicade, Avsola, Inflectra, and Renflexis, respectively. The minor difference observed between detected PS80 and expected PS80 may be attributed, in part, to differences in the PS80 raw material used for the therapeutic samples and calibration standards. The data demonstrates, under optimized conditions, that ELSD can be reliably and consistently used to detect intact polysorbate in therapeutic samples at dosage levels.
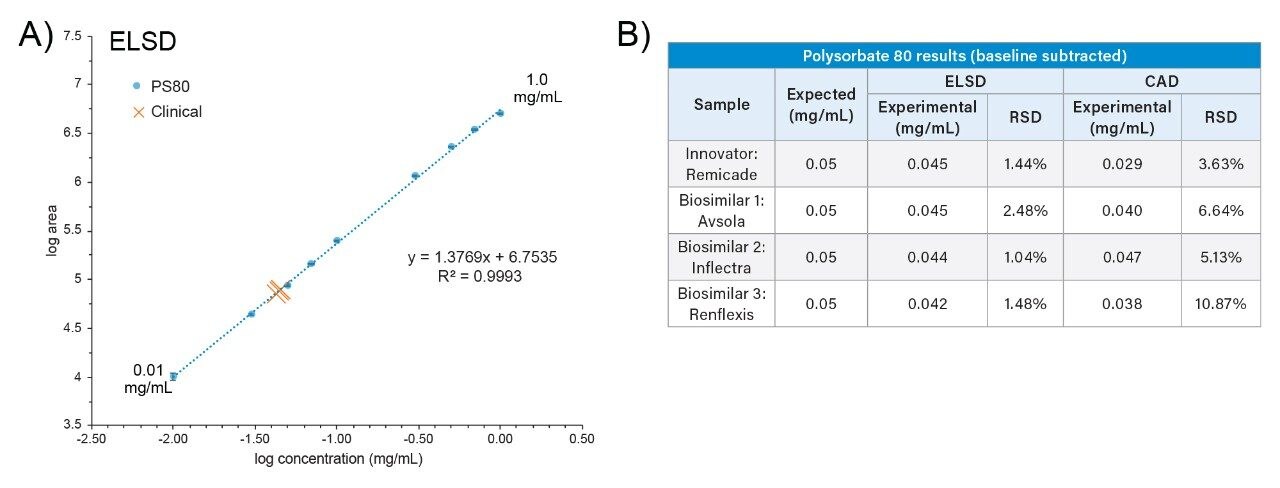 Figure 4. Linear dynamic range of ELSD and PS80 quantification of Infliximab drug products by ELSD and CAD.
A) ELSD demonstrated a linear response within the range of 0.01 to 1 mg/mL.
B) PS80 concentrations in four Infliximab drug products measured by ELSD and CAD.
To further evaluate the applicability of ELSD in the detection and quantitation of PS in therapeutic drug products, a charged aerosol detector was evaluated using the same system and method as an alternative detector. To facilitate comparison, the CAD response was optimized for evaporation temperature and power function. An evaporative temperature setting of “low” was observed to yield a higher detector response for PS. Using this setting, the power function of the CAD was evaluated at 1, 1.2, 1.4, and 1.6 as per the manufacturer instructions.7 Using a 5-point calibration curve of PS, a power function of 1.2 was found to have the highest linear response and was used as the optimized setting.7 As part of the optimization method, the LOD was evaluated using the optimized settings to determine dynamic range. Interestingly, in this study CAD was only able to generate one additional data point (0.005 mg/mL) when compared to ELSD for polysorbate. However, the increased baseline noise associated with CAD at this concentration level negatively impacted integration accuracy (RSD up to 29%) where it was determined not to be suitable for an assay to be deployed in a manufacturing environment. This resulted in the CAD as having the same effective range as the ELSD for the proposed PS assay with a concentration of 0.01 mg/mL being the lower limit of quantitation as shown in Figure 5.
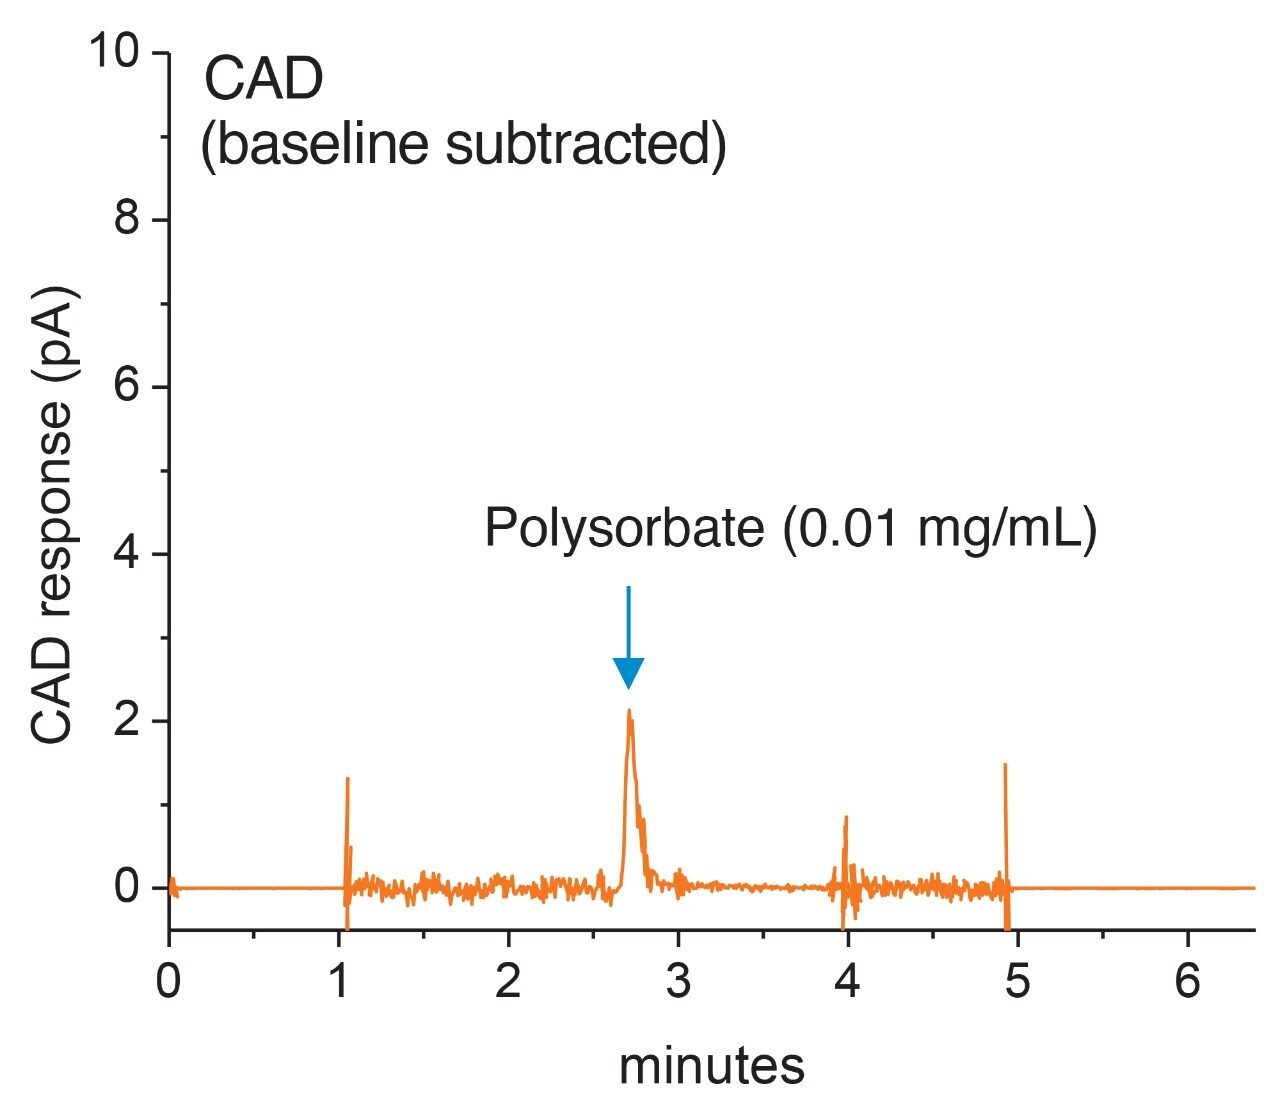 Figure 5. CAD response baseline. CAD response for polysorbate 80 injected at a 0.1 µg mass load with baseline subtraction applied.
Using the same method as before, a 9-point calibration plot of area vs. concentration was used to quantify the PS80 content in the Infliximab clinical samples with the optimized CAD settings. Using a linear fit, a trendline (y=18.285x + 0.2144, R2 = 0.9991) was generated and used for quantitation. To facilitate comparison to the ELSD method, baseline subtraction was incorporated as well with the CAD data. It should be noted that the data output available from CAD under Empower 3 control could not be assigned a derived channel to implement baseline subtraction. To this end, manual curation of CAD data was necessary using an external spreadsheet to perform baseline subtraction and peak integration resulting in higher RSD values ranging between 4%–11% in the clinical samples and decreased assay accuracy as shown in Figure 4B. To ensure bias was not present in this study, ELSD data was treated in the same manner and accuracy (RSD values) were determined to be negligibly impacted.
When comparing ELSD to CAD results, this data demonstrates under optimized conditions, ELSD can reliably be used to detect intact polysorbate in therapeutic samples with comparable results to CAD. Interestingly, both detectors exhibited the same effective working range and LOD for polysorbate 80 under optimized conditions. Waters ELSD module was observed to have a higher degree of accuracy and consistency in the analysis of intact polysorbate through the utilization of automated peak processing methods and baseline subtraction functionality embedded within the Empower 3 CDS. Functionality, that could not be fully realized with the CAD module. In summary, as an integrated solution under Empower 3 control, Waters ELS detector offers an efficient solution in the analysis of polysorbate that can be readily deployed in the development and manufacturing of biotherapeutics.
Conclusion
As an aerosol-based detection method, Waters ELSD is well suited for the analysis of intact polysorbate in therapeutic drug products. In this study, it was demonstrated that ELSD-based methods are able to reliably and consistently detect intact polysorbate in a concentration range of 0.01–1.0 mg/mL. Furthermore, the integrated functionality of Waters ELSD with Empower 3 makes it an ideal solution for deployment in manufacturing environments where ease of use, ability to automate, and throughput are critical to maintain productivity.
References
- Kerwin, B. Polysorbate 20 and 80 Used in the Formulation of Protein Biotherapeutics: Structure and Degradation Pathways. Journal of Pharmaceutical Sciences. 2007. 97(8):2924–2935.
- Honemann, M. et al. Monitoring Polysorbate Hydrolysis in Biopharmaceuticals Using a QC-Ready Free Fatty Acid Quantification Method. Journal of Chromatography B. 2019 Mar; 1116 (2019)1–8.
- Labrenz, S. Ester Hydrolysis of Polysorbate 80 in mAb Drug Product: Evidence in Support of the Hypothesized Risk After the Observation of Visible Particulate in mAb Formulations. Journal of Pharmaceutical Sciences 2014 May.103:2268–2277.
- Birdsall, R. et al. Quantitative Analysis of Polysorbate 20/80 in Protein-Based Biopharmaceuticals Using A One-Pot RPLC-MS Based Platform Method. Waters Application Note, 2021. 720007249EN.
- Magnussona, L. et al. Aerosol-based detectors for liquid chromatography Journal of Chromatography A1421 (2015) 68–81.
- McCarthy, S. Quantification of Polysorbate Using the ACQUITY UPLC H-Class Bio System with ELS Detection. Waters Application Note, 2015. 720005323EN.
- Gamache, P. et al. Charged Aerosol Detection-Use of the Power Function and Robust Calibration Practices to Achieve the Best Quantitative Results. Thermo Scientific Technical Note, 2019. 73299.
720007501, January 2022