This application note demonstrates the use of the Waters Fraction Manager - Analytical (W-FMA) in conjunction with an ACQUITY Arc Ultra-High Performance Liquid Chromatography (UHPLC) System to separate and isolate several components present in a model complex pharmaceutical formulation (DayQuil).
In recent years, the drug discovery process has made great advances due to the progression of technology in analytical instrumentation. Isolating, purifying, and identifying active pharmaceutical ingredients in pharmaceutical formulations are essential steps in the drug development process. These steps can be challenging, especially in complex pharmaceutical formulations.
Although mass spectrometry is a destructive method of detection, it still can be used for triggering fraction collection, when configured appropriately. At low flow rates, typically used in analytical scale applications, every drop counts, and the use of a completely optimized and characterized collection system is imperative. Two modes of fraction collection including mass-directed and the time-based approaches will both be demonstrated and discussed in this application note.
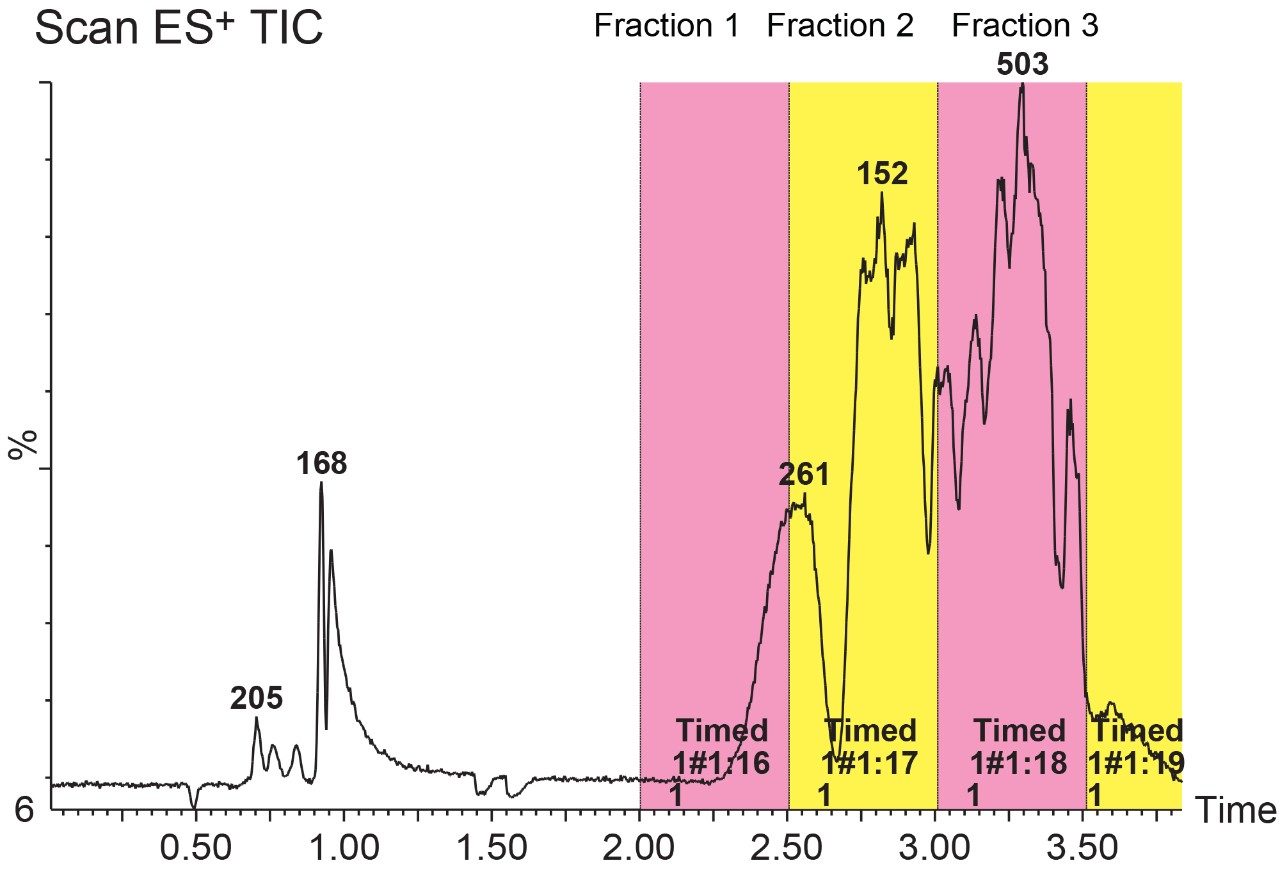
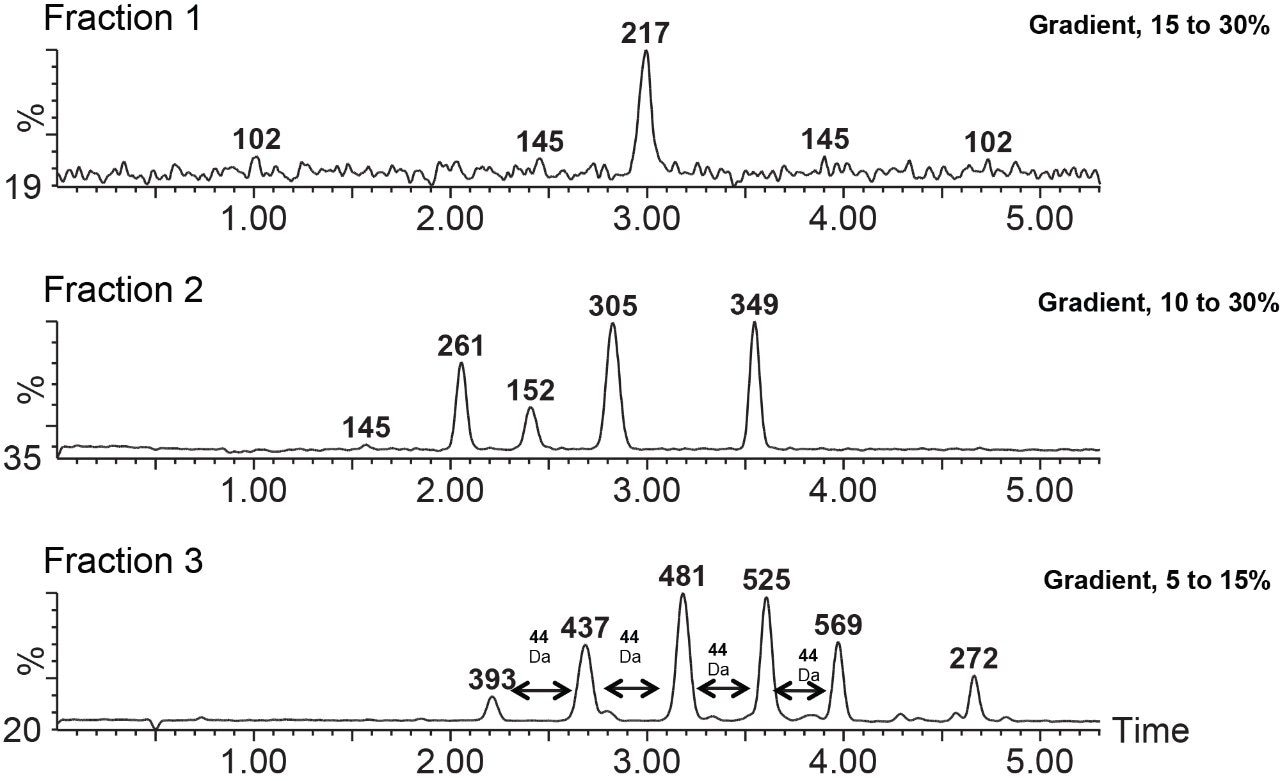
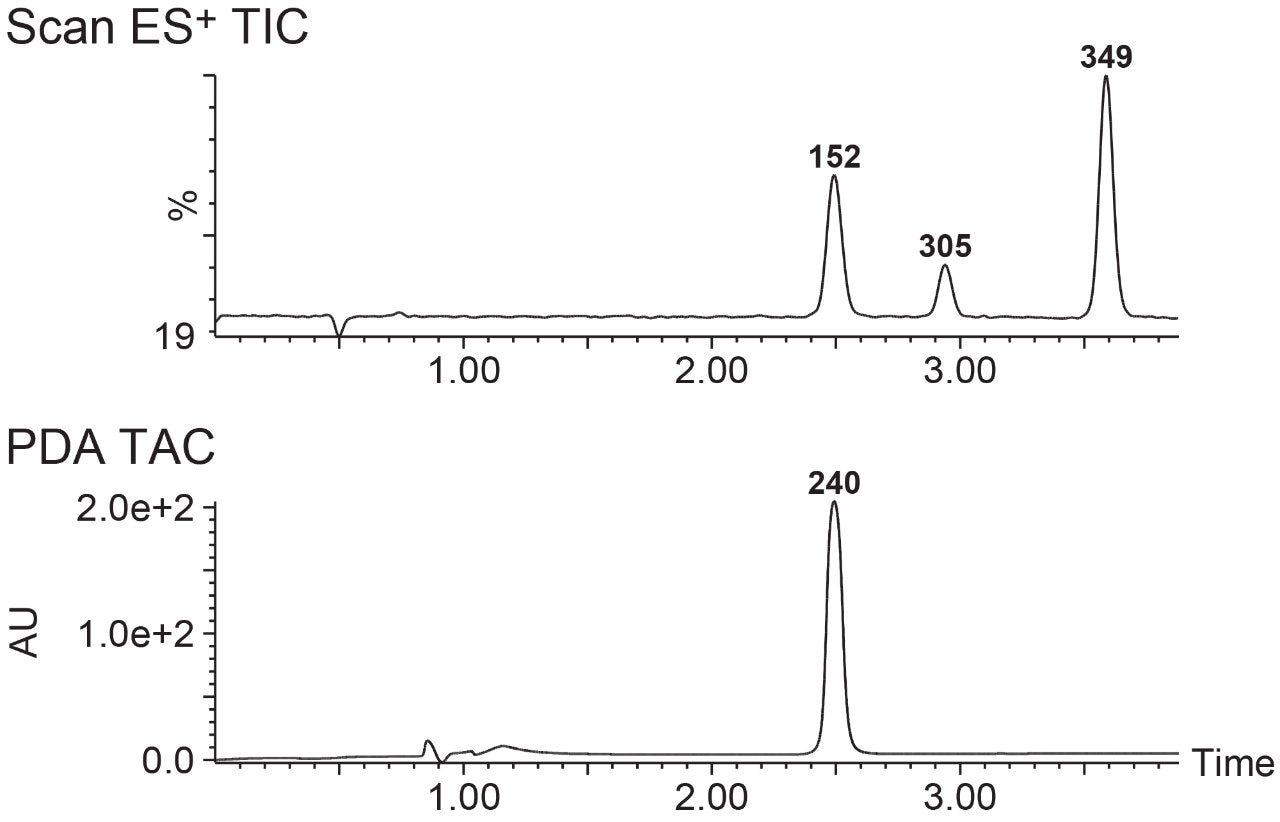
Sometimes, the requirement may not be component isolation, but identification. In these instances, online multidimensional chromatographic systems are often used.1 While the use of such systems is normally sufficient, the setup may not always be available or practical. In this application note, we demonstrate the use of the Waters Fraction Manager - Analytical (W-FMA) in conjunction with an ACQUITY Arc Ultra-High Performance Liquid Chromatography (UHPLC) System to separate and isolate several components present in a model complex pharmaceutical formulation (DayQuil). We will also discuss how the WFM-A can be used effectively in an “off-line multidimensional” approach, to aid in the identification of components from such complex mixtures.
DayQuil was purchased from a local drug store. A sample equivalent to 162.5 mg Acetaminophen, 5 mg Dextromethorphan HBr, and 2.5 mg Phenylephrine HCl was diluted in 2 mL acetonitrile. Ten µL of this sample was further diluted in 1 mL of acetonitrile giving final concentrations of 812.5 µg mL-1, 25 µg mL-1, and 12.5 µg mL-1, of the three compounds respectively. Ten µL samples of the final solution were injected onto the LC-MS system for analysis. Potential peaks of interest were identified and collected using the WFM-A. Collected fractions were next reanalyzed under optimized gradient conditions.
All separations were performed on an ACQUITY Arc UHPLC System equipped with an ACQUITY UPLC Photodiode Array (PDA) Detector and an ACQUITY QDa Mass Detector. The system was coupled with a WFM-A and controlled by MassLynx Software and the FractionLynx Application Manager.
LC system: |
ACQUITY Arc |
Detector: |
ACQUITY UPLC Photodiode Array (PDA) Detector |
Column: |
SunFire C18 3.5 μm, 4.6 x 100 mm (p/n 186002553) |
Column temp.: |
40 °C |
Injection volume: |
10 μL |
Flow rate: |
1.5 mL/min |
Mobile phase A: |
H2O with 0.1% formic acid |
Mobile phase B: |
Acetonitrile with 0.1% formic acid |
Gradient: |
As noted in figures |
ISM configuration: |
10:1 splitter, Flow rate 0.5 mL/min, 50% acetronitrile/water, 0.1% formic acid |
MS system: |
ACQUITY QDa Mass Detector |
Ionization mode: |
ESI+ |
Capillary voltage: |
0.8 kV |
Con voltage: |
10 V |
Source temp.: |
550 °C |
The WFM-A is an optimized low flow rate fraction collector, specifically designed to collect the narrow peaks normally associated with analytical scale applications. Multiple modes of fraction collection can be performed using this WFM-A.2 In this application note a new mode of collection (mass-directed) along with the time-based fraction collection modes were both explored.
In mass-directed mode, collection is triggered when the molecular mass of interest passes through the ACQUITY QDa Mass Detector. In this experiment, 10 µL of a DayQuil sample, prepared as previously described, was injected onto the column and two masses were targeted for collection. The two targets, 261 m/z and 272 m/z were successfully collected, as can be seen in Figure 2. FractionLynx identifies the collected fraction by color in a real time display on the chromatogram. The target value and the vial location are also noted on the chromatogram in real time. The inset in Figure 2 shows the mass spectrum of the collected fraction 272 m/z and as can be seen, a pure fraction of the desired mass (272 m/z) was collected. This indicates that the system is capable of targeting and collecting a pure compound, when the mass of interest is well resolved from other peaks. The mass spectrum information can be obtained from the actual collection data, without the need for additional fraction analysis.
However, if the separation method is not able to resolve the individual components, then the collector is unable to separate those components during the collection process. The system will collect the masses that have been indicated in the sample list, and the overall level of success is now dependent on the chromatographic method. For example, in Figure 3, even though 261 m/z was targeted, the spectral analysis indicates that 217 m/z and 305 m/z was also collected. When 217 m/z is extracted, the late elution of a small portion of the compound can be seen overlapping with the beginning of the 261 m/z fraction collection, confirming where the contamination came from.
Post purification analysis of the collected fraction of 261 m/z confirmed this co-elution, and indicated that the three components reported in the purification spectrum were confirmed, and contributed to a 9.6% impurity level (Figure 4). The impurities were collected in the front and the tail of the fraction.
In this case, we were purposely overloading the column and expecting situations like this. With this information, subsequent collections could have made use of additional software tools to avoid this situation, such as the Boolean logic NOT function. Using this function allows for collecting only the desired mass and not collecting any other co-eluting masses.
The goal of the experiment was to isolate and identify several components present in a complex pharmaceutical sample. This sample is reasonably complex, and separating all of its components in a single separation method can be challenging and time consuming. Therefore, a two-step approach that uses a time-based fraction collection (Figure 5) and reanalysis of these collected fractions was employed. In this approach, this complex sample was sliced into smaller, more manageable fractions that were then collected and analyzed again.
The fractions were analyzed using more focused gradients (Figure 6) which provided fast and efficient separations for these collected fractions. It is worth mentioning here that Fraction 3 showed polyethylene glycol (PEG) interference. This interference can be seen in the bottom trace, showing the typical PEG mass distributions with adjacent peaks separated by 44 Da, corresponding to the mass of the repeat unit, ethylene oxide.
The re-analysis of the fractions in this case was performed on the same column as the purification. However, to gain even additional separation efficiency, the re-analysis could also be carried out using orthogonal chemistry, or even an orthogonal chromatographic technique such as Supercritical Fluid Chromatography (SFC) or gas chromatography (GC).
Another interesting feature about the setup we employed in this application note is the dual detection capability. As previously described, our system employs two separate detection modes, ACQUITY QDa and ACQUITY PDA.
The advantage of this setup is that the ACQUITY QDa is capable of detecting analytes that do not have chromophores. This feature is particularly important in improving the collection capabilities for the WFM-A. For example, as shown in Figure 7, multiple components could have been missed and not collected if only ACQUITY PDA detection was employed.
720006287, June 2018