Analysis of Mycotoxins in Cannabis Plant Material and Derivative Products by Immunoaffinity Enrichment LC-MS/MS
Abstract
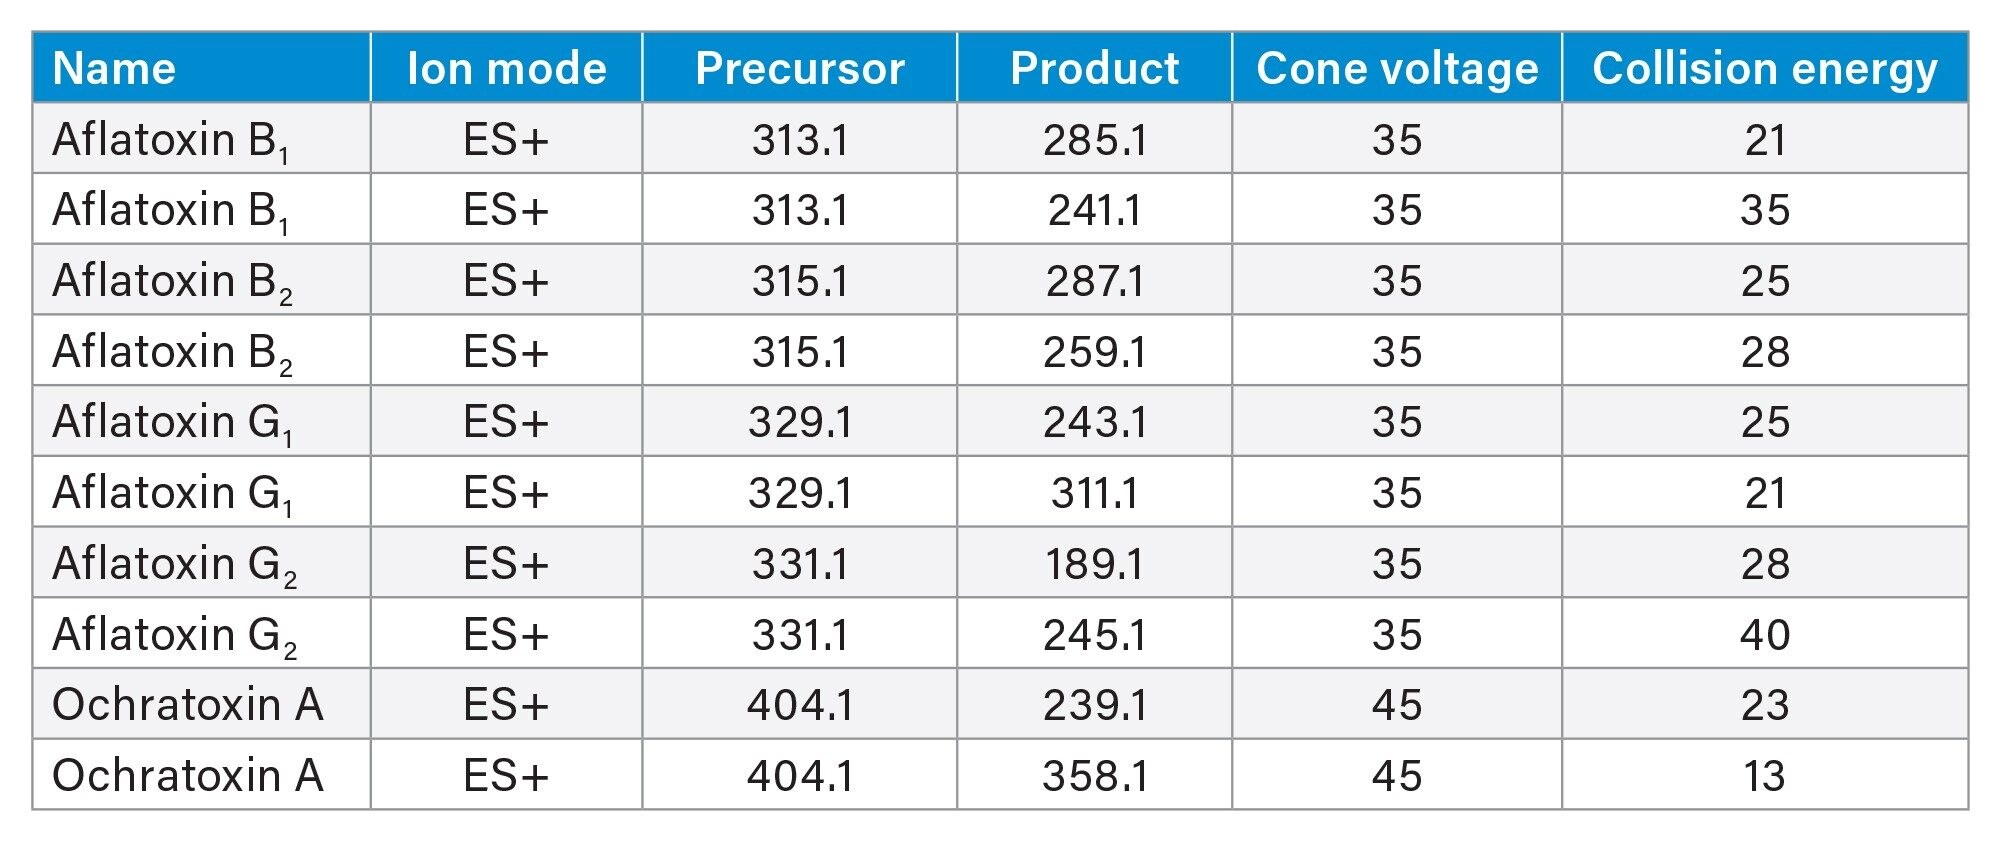
In this application note, a robust and effective method was developed for the analysis of the regulated mycotoxins in cannabis, Aflatoxin B1 , B2, G1 , G2 and Ochratoxin A.
Benefits
- Sensitive method to meet US, EU, and Canada requirements for regulated mycotoxins
- Easy cleanup method coupled with rapid 5 minute LC-MS/MS analysis method
- Method allows for analysis of flower, topicals, tinctures, concentrates and edibles
Introduction
Mycotoxins are regulated in many commodities worldwide and Cannabis is not exempt from mycotoxin contamination. Contamination can occur during storage. It can occur in both indoor and outdoor grows, whether treated or untreated for pesticides. Cannabis can also pull many different contaminants out of the soil it is grown in. Cannabis and its derivative products have remained challenging matrices when analyzing for the regulated mycotoxins, Aflatoxin B1 , B2, G1, G2, and Ochratoxin A. Therefore, the main objective of this study was to develop a robust, comprehensive and effective method for the analysis of the regulated mycotoxins in cannabis plant material and derivative products using immunoaffinity columns coupled with LC-MS/MS. The validated method uses an AflaOchra™ immunoaffinity column clean-up procedure that is streamlined for the analysis of cannabis plant material, topicals, tinctures, edibles and concentrates. Immunoaffinity columns were provided by VICAM™.
In this application note, a robust and effective method was developed for the analysis of the regulated mycotoxins in cannabis, Aflatoxin B1, B2, G1, G2, and Ochratoxin A. Figures of merit evaluated include linearity, limit of detection (LOD), limit of quantitation (LOQ), accuracy, precision, matrix effect, and robustness. Validation experiments were performed at ProVerde Laboratories, using a Waters I-Class UPLC™ coupled to a Xevo TQS-micro MS. The validated method presented uses immunoaffinity column cleanup coupled with LC-MS/MS to provide an analytical method sensitive enough to detect the required regulatory levels of 5 ppb Aflatoxin B1 (or 20 ppb total Aflatoxin) and the regulatory levels of 20 ppb Ochratoxin A.
Experimental
Materials
Separate Aflatoxin B1 , B2, G1 , and G2 (3 µg/mL) standards were purchased from (Supelco, USA, Part#’s Aflatoxin B1 – CRM46323, Aflatoxin B2 – CRM46324, Aflatoxin G1 – CRM46325, Aflatoxin G2 – CRM46326). Ochratoxin standard (50 µg/mL) was purchased from (Supelco, USA, p/n: CRM46912). LC-MS grade water was used as a purified water source (Fisher, USA, Part# W6-1). LC-MS grade 100% methanol was used in extraction solution (Fisher, USA, p/n: A456-1).
AflaOchra™ immunoaffinity columns (2 different lots) were supplied by VICAM, USA (p/n: G1017). Dried hemp and cannabis flower/bud, tinctures, topicals and edible material were collected and analyzed for this study within an ISO 17025 accredited, licensed MMJ (Medicinal Marijuana) analytical laboratory (ProVerde Labs, USA).
Methods
Type A samples were classified as concentrate/oleoresin samples. Type B samples were classified as cannabis plant material and MIPS (Marijuana Infused Products) such as topicals, tinctures and edibles. Flower sample and MIPS (type B samples) were weighed at 0.5 gram sample (0.1 gram for concentrate/ oleoresin samples, type A samples) and placed in an extraction vessel. The appropriate spike volumes of a combined Mycotoxin Stock Solution (MTSS) was then added to the sample within each extraction vessel. Aflatoxin standard at various levels were allowed to dry on to the surface of the sample for at least 30 minutes to 1 hour.
Sample Preparation
Cannabis samples were prepared at ProVerde Laboratories (Milford, MA). A small scoop of Yttria Zirconia Micro Milling beads was added to a 15 mL polypropylene conical tube. Samples of 0.5 g homogenized cannabis plant material sample and MIPS (0.1 g for concentrate/oleoresin samples) were weighed into the 15 mL polypropylene conical tubes and 2 mL of isopropanol was added. The samples were then vortexed for 1.5 minutes. Extra care was taken to ensure concentrates and oleoresins were fully dissolved. The samples were then processed with a Geno/Grinder (SPEX, Metuchen, NJ) for 1 minute at 1500 RPM. 5 mL of 60/40 Methanol/LCMS grade water was added to the conical tube and the samples were then processed for a second time with a Geno/Grinder (SPEX, Metuchen, NJ) for 1 minute at 1500 RPM. The samples were then centrifuged for 5 minutes at 5000 RPM (4696 x g). The top layer of the centrifuged solution was pipetted into a clean vial. A 4.2 mLs portion of this extract was diliuted to 50 mL with 0.1% tween-20 in PBS and the precipitate filtered. The samples were then loaded onto a VICAM AflaOchra Column and the immunoaffinity column clean-up procedure was followed.
Immunoaffinity Column Clean-up
The dilute filtered sample (50 mL) was loaded onto a VICAM AflaOchra HPLC immunoaffinity column, and the flow- through was sent to waste. The column was then washed with 10 mL of 0.1% Tween-20 in PBS followed by 10 mL of PBS. The column was then washed with 2 aliquots of 10 mL H2O. To elute the isolate toxins, 1 mL of MeOH was loaded onto the column followed by 1 mL H2O whic was collected in a vial.
LC-MS/MS Conditions
UPLC Conditions
|
UPLC system: |
ACQUITY UPLC I-Class |
|
Column: |
Waters XBridge™ BEH, XP C18, 2.1 x 100 mm, 2.5 µm (p/n: 186006031) and guard column Waters XBridge BEH XP C18, 2.5 mm x 2.1 mm, 2.5 µm (p/n: 186003975) |
|
Column temperature: |
30 °C |
|
Sample temperature: |
20 °C |
|
Mobile phase A: |
5 mM Ammonium Formate with 0.02% Formic Acid in H2O |
|
Mobile phase B: |
5 mM Ammonium Formate with 0.02% Formic Acid in Methanol |
|
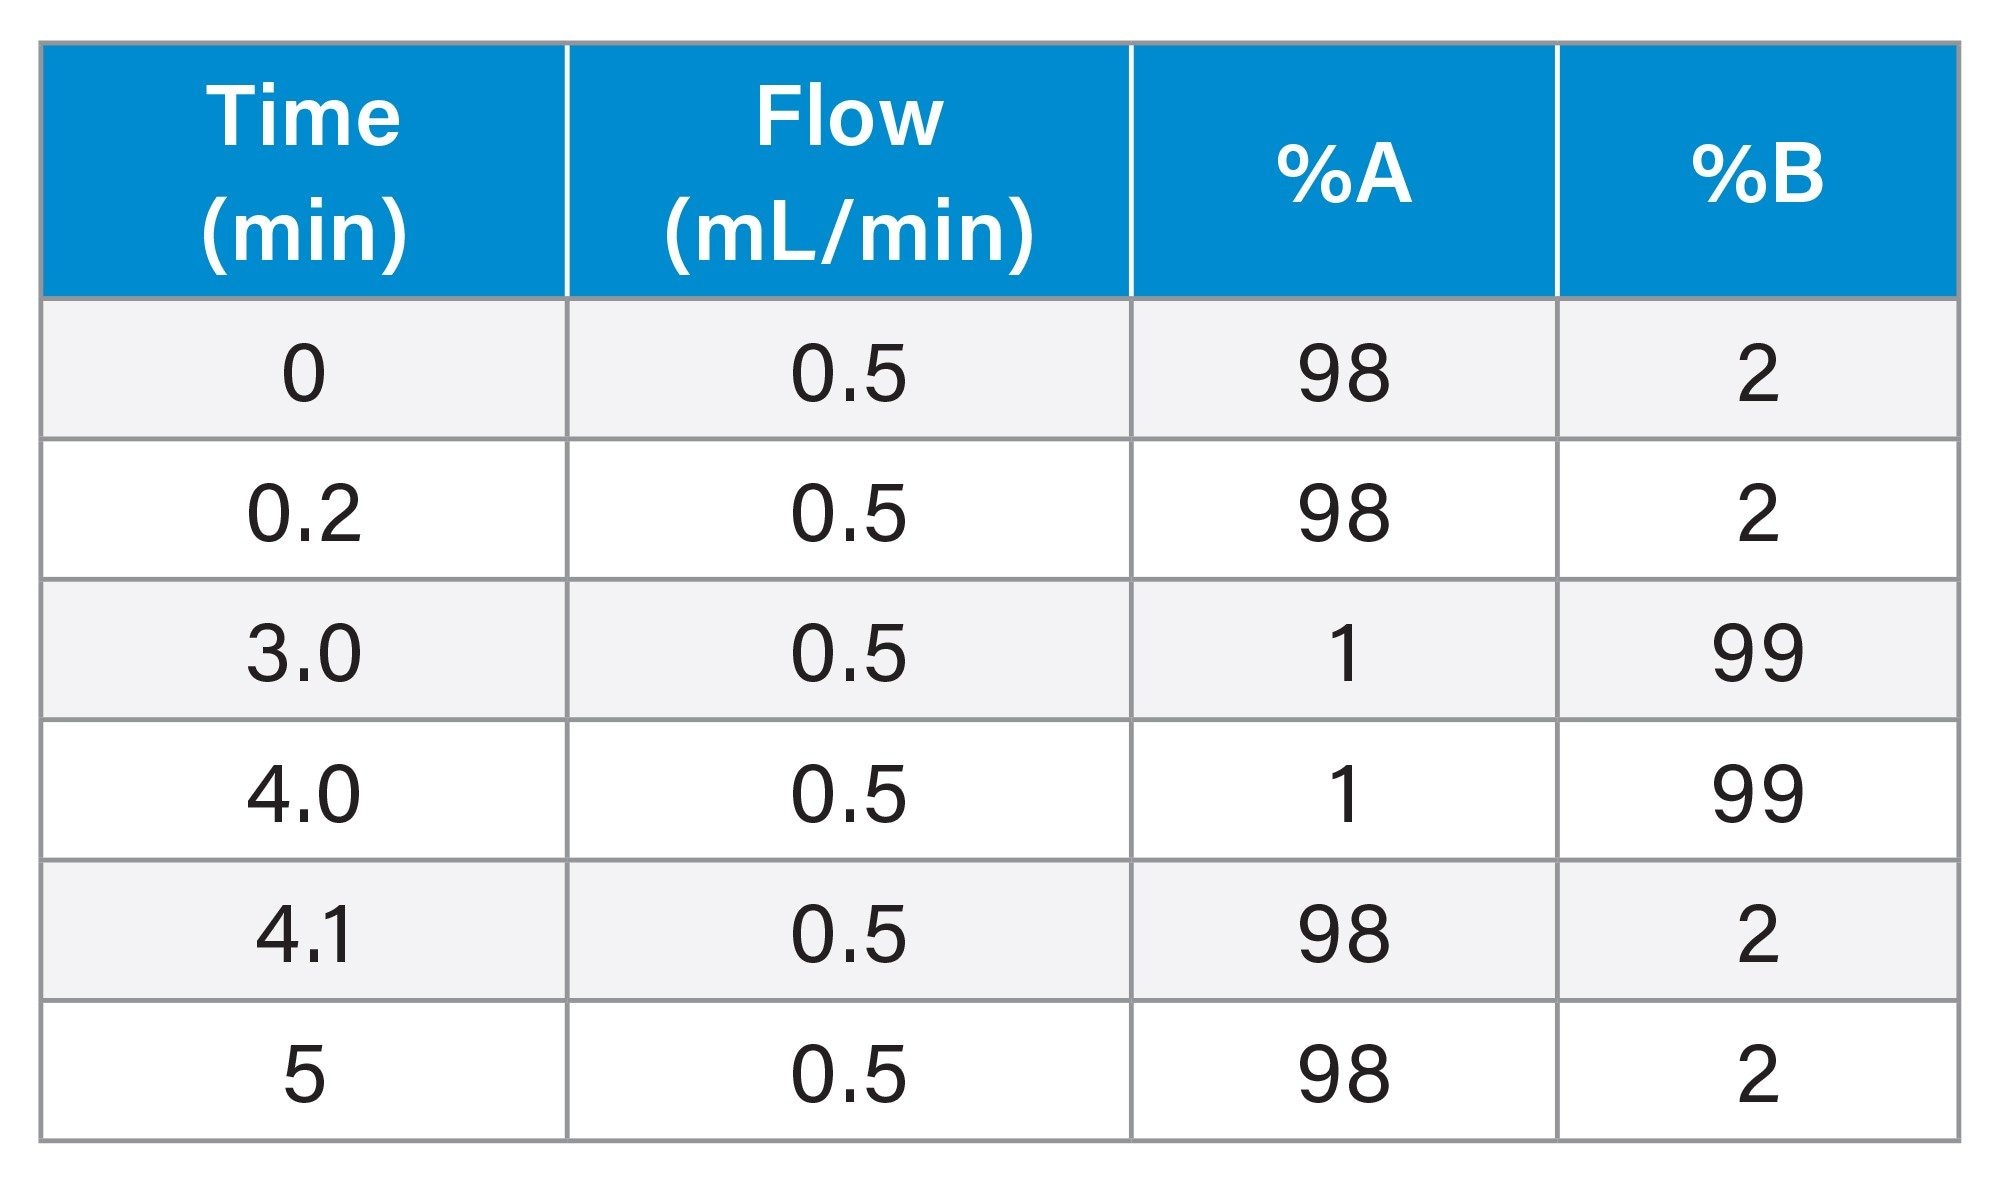
Flow rate: |
0.5 mL/minute |
|
Injection volume: |
10 µL |
|
Retention time: |
Varies per compound. Refer to MS parameters section |
MS Conditions
|
MS system: |
TQS-Micro |
|
Ionization mode: |
ESI positive |
|
Collision gas (nitrogen): |
3.00 x 10⁻³ mbar |
|
Capillary voltage: |
2.50 kV |
|
Cone voltage: |
Aflatoxin B1 , B2, G1 & G2 – 35 V Ochratoxin A – 45 V |
|
Source temperature: |
150 °C |
|
Desolvation temperature: |
500 °C |
|
Desolvation gas: |
1000 L/hr |
|
Cone gas: |
50 L/hr |
Gradient
MS Parameters
Results and Discussion
Sample Matrices Analyzed
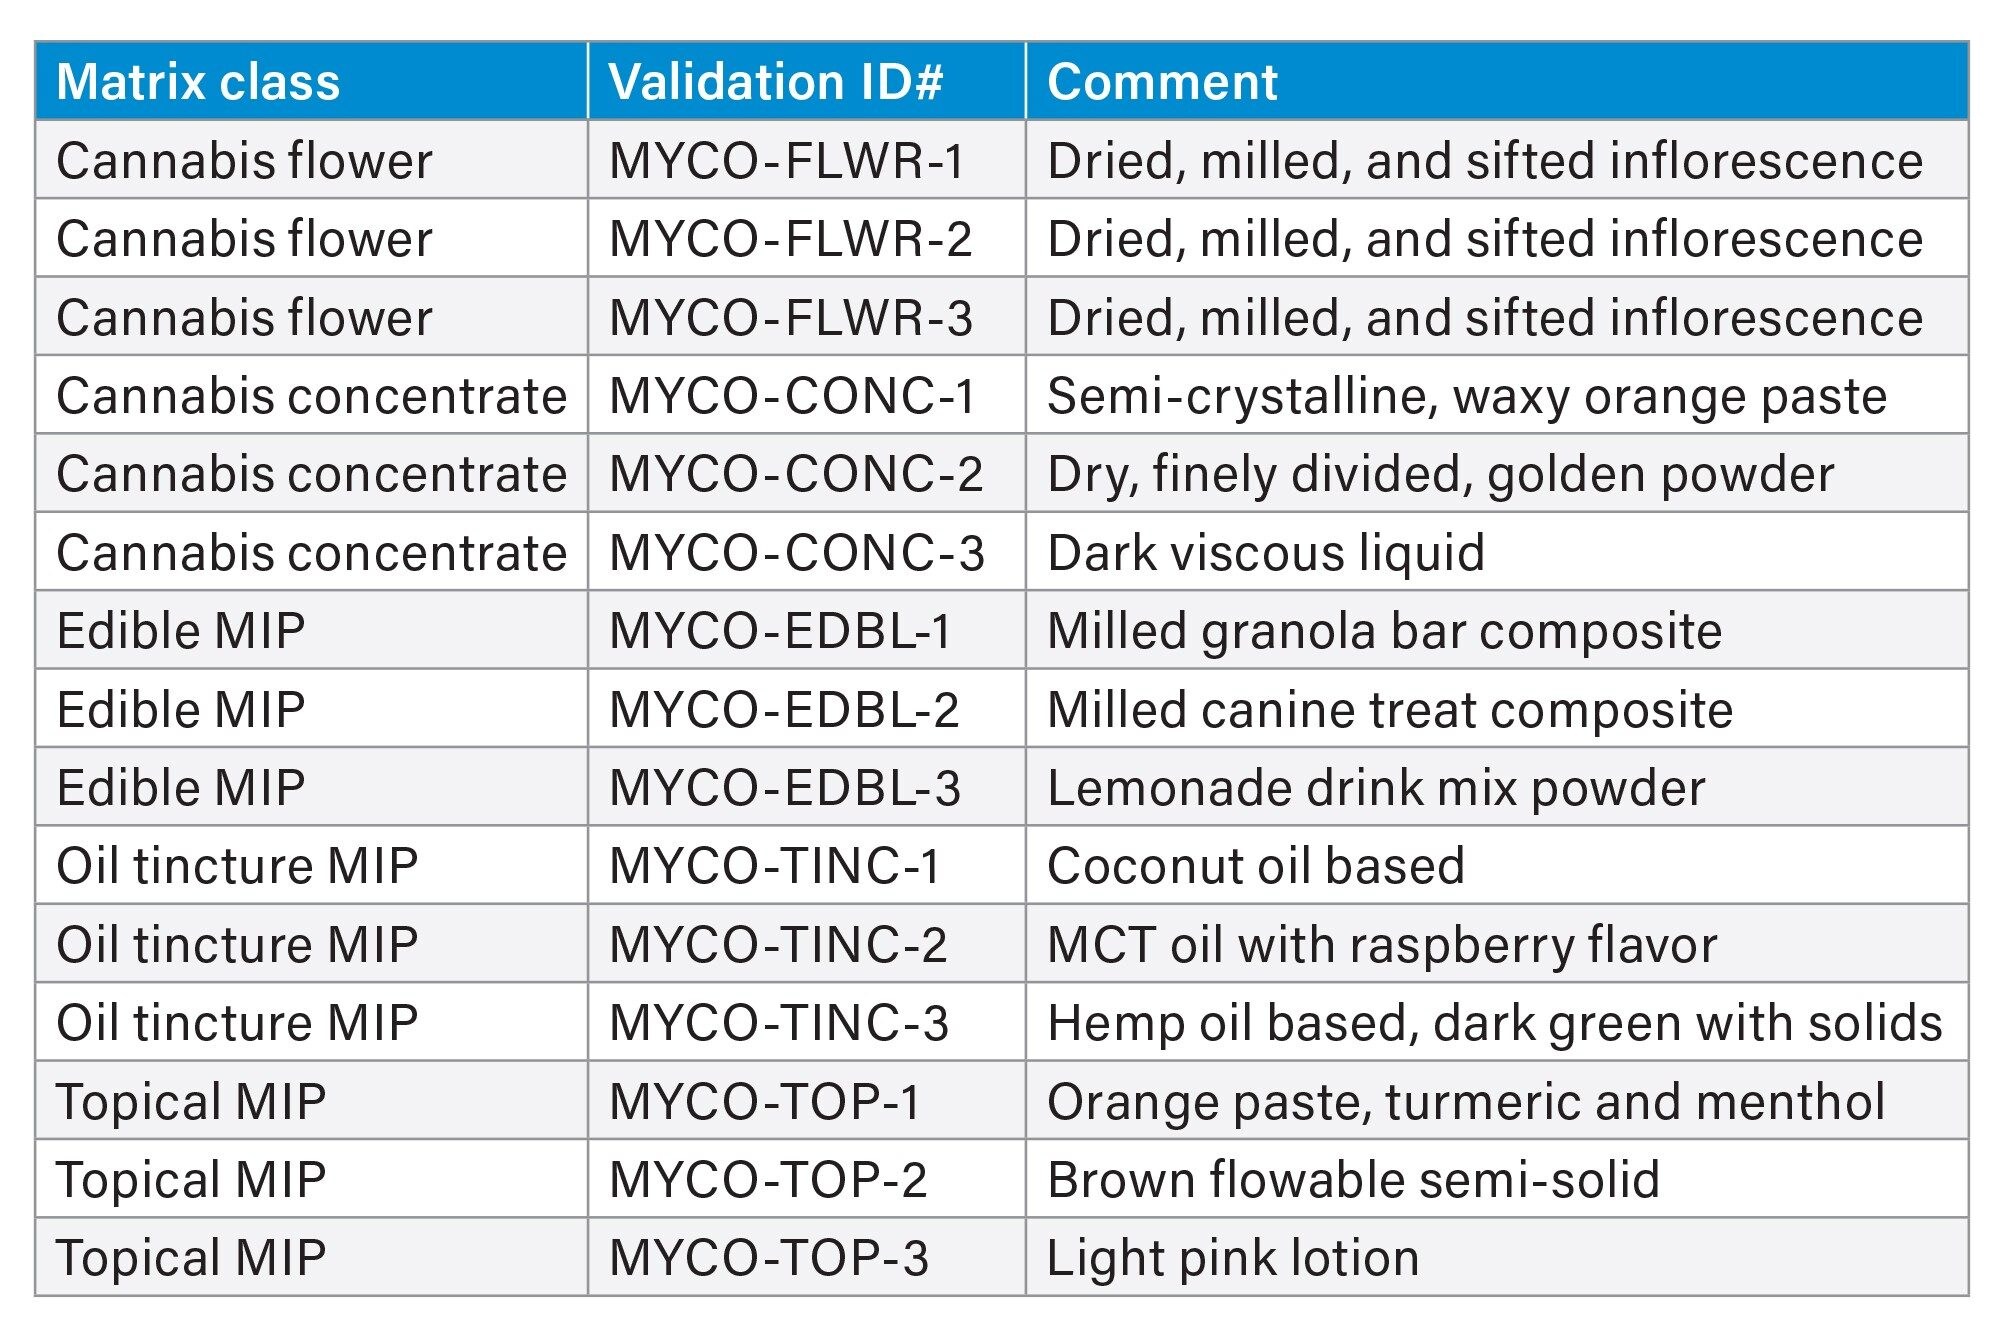 Table 1. Sample Matrices Analyzed During Validation.
Matrix Effect
Matrix blank extractions were prepared from each of the 15 validation samples. These extracts were spiked with analytes at each of 6 concentration levels as described in Table 2 below. Type A samples were classified as concentrate/oleoresin samples. Type B samples were classified as cannabis plant material and MIPS (Marijuana Infused Products) such as topicals, tinctures, and edibles.
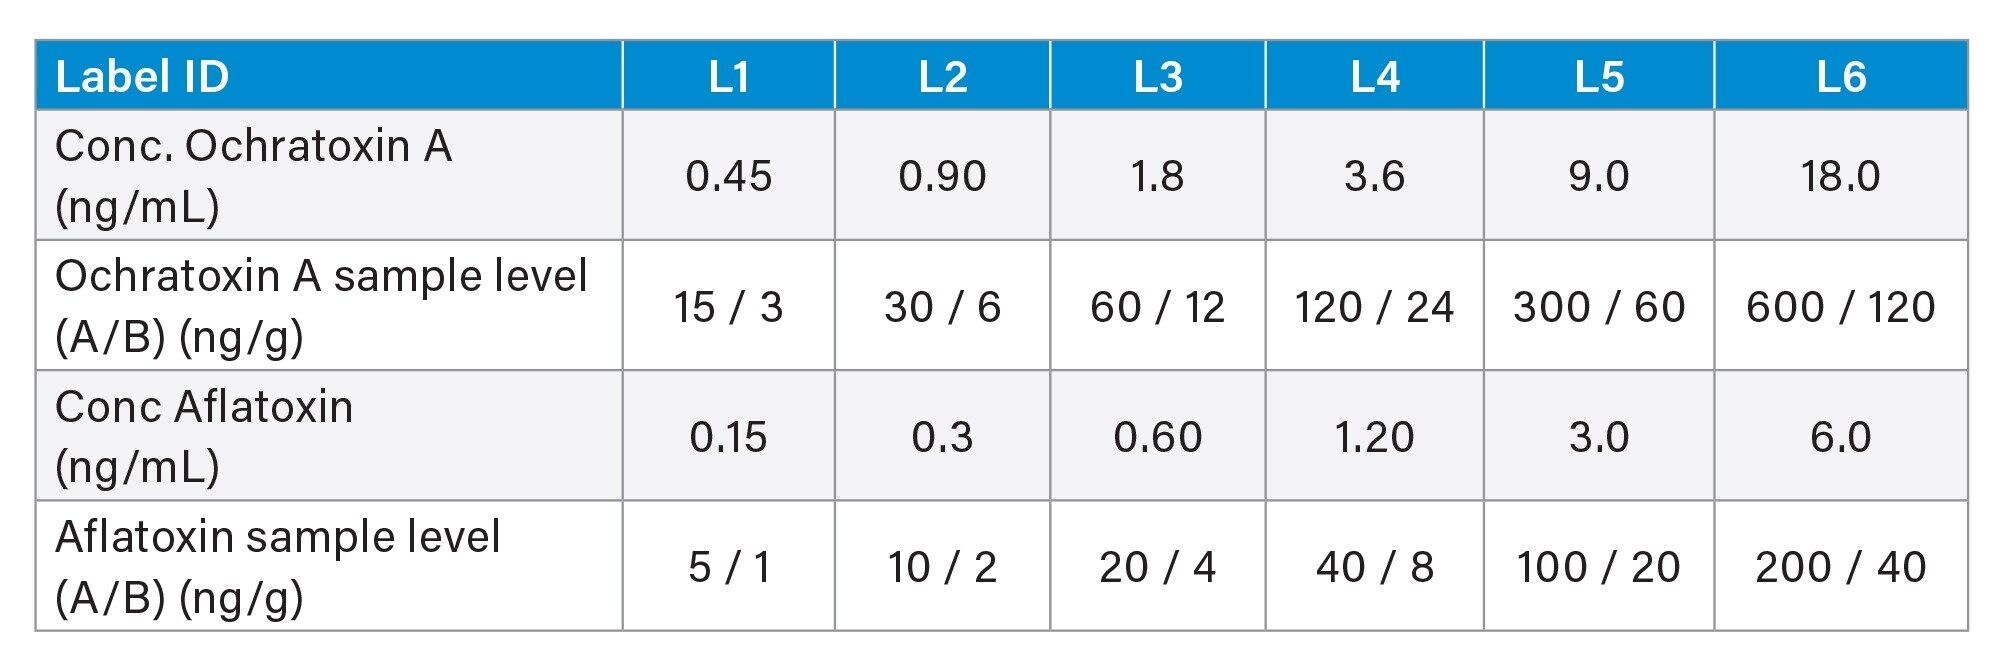 Table 2. Matrix Effect Calibration Curve Levels.
Matrix effect was investigated in three example samples of five representative matrix classes: plant material, oleoresins, edible oils, topical products, and edible products. Blank sample extracts were spiked with analytes (post-extraction) at the same concentration levels as the solvent based calibrators. Overall matrix effect was calculated as the ratio of the slope of the matrix matched calibration curve to that of the solvent reference. Negative matrix effect indicates suppression and positive matrix effect indicates enhancement. The acceptance criteria for matrix effect calibration curves was the coefficient of determination, R2 ≥0.98.
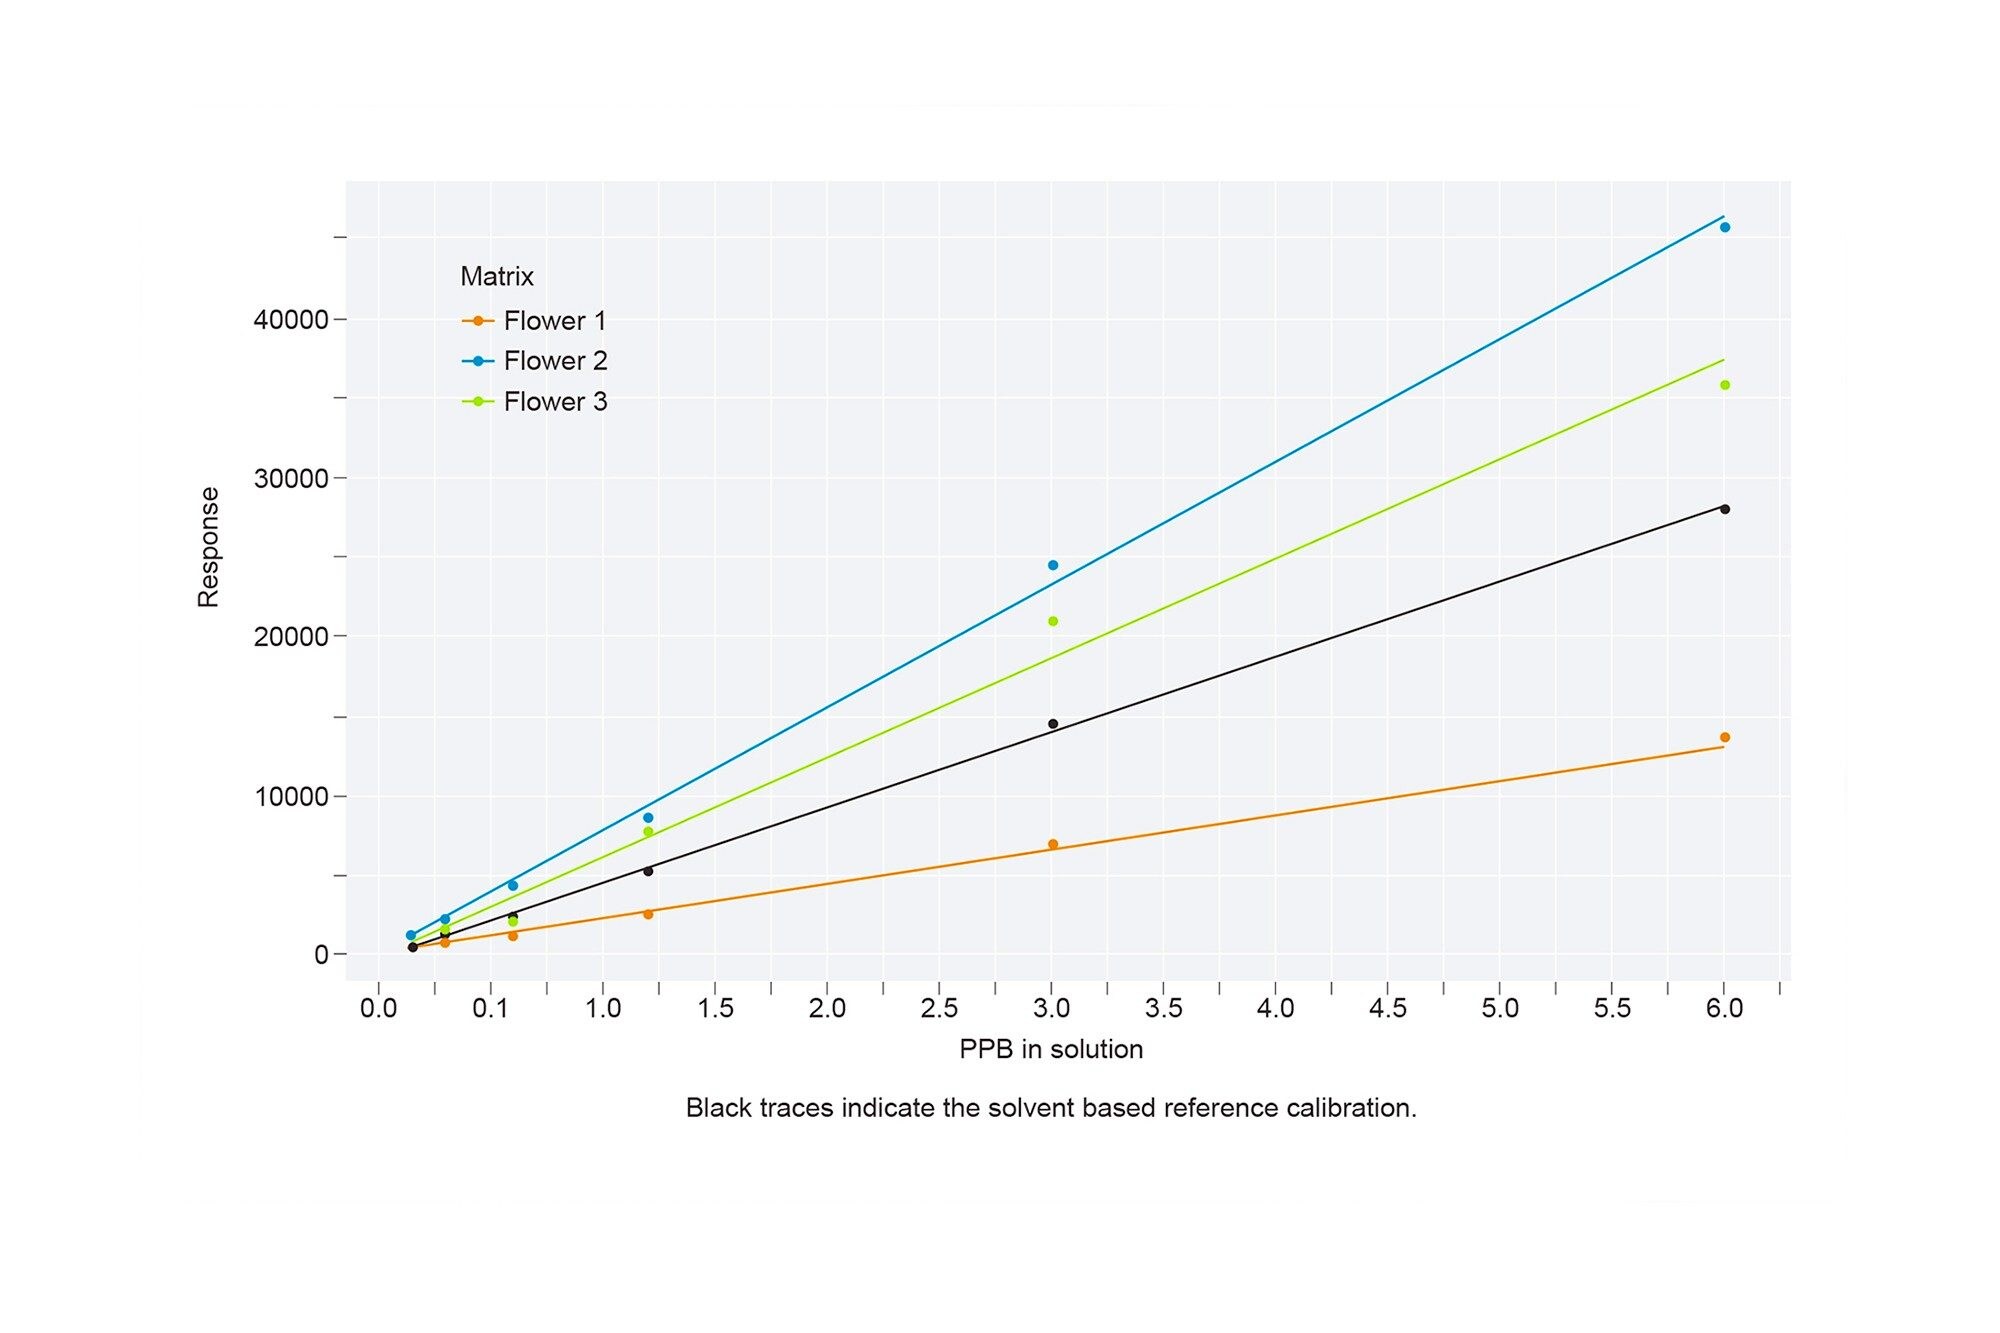 Figure 1. Matrix Effect of Aflatoxin B1 in Cannabis Flower Matrix.
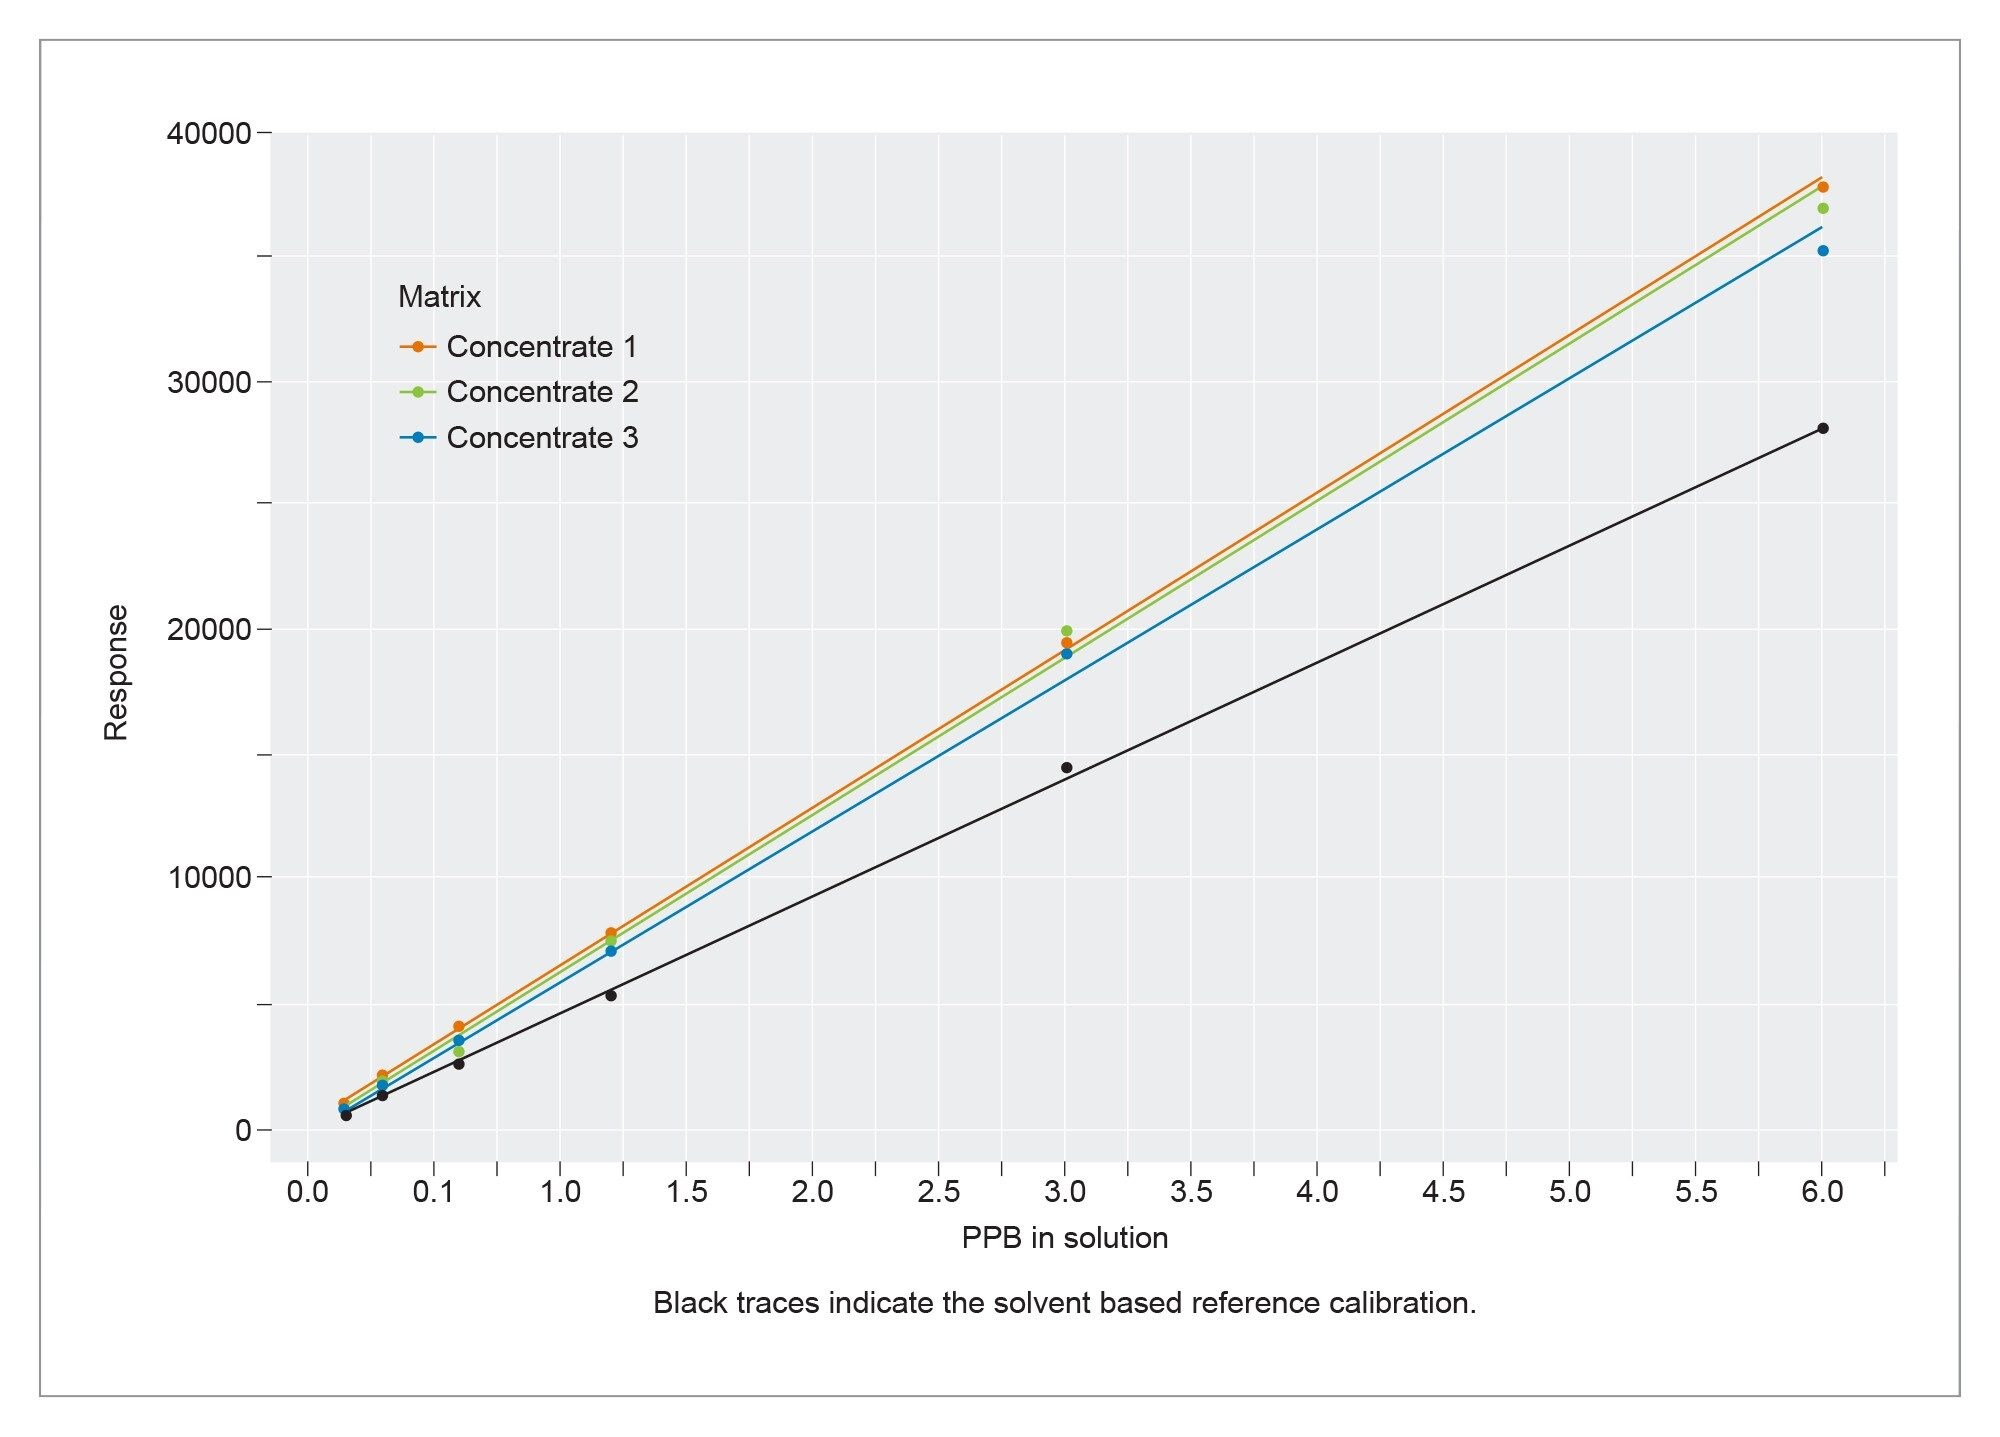 Figure 2. Matrix Effect of Aflatoxin B1 in Cannabis Concentrate Matrix.
Shown in Table 3. below which includes percent matrix effect for flower samples and concentrate samples, the three flower samples have a significantly different matrix effect. For example, flower sample #1 shows significant suppression for Aflatoxins while Flower samples #2 and #3 do not follow that trend and show enhancement at varying levels. For this reason, matrix matched standards are highly recommended for cannabis matrices. Percent matrix effect % was calculated using the equation (slope of sample-slope of reference)/slope of reference x 100%.
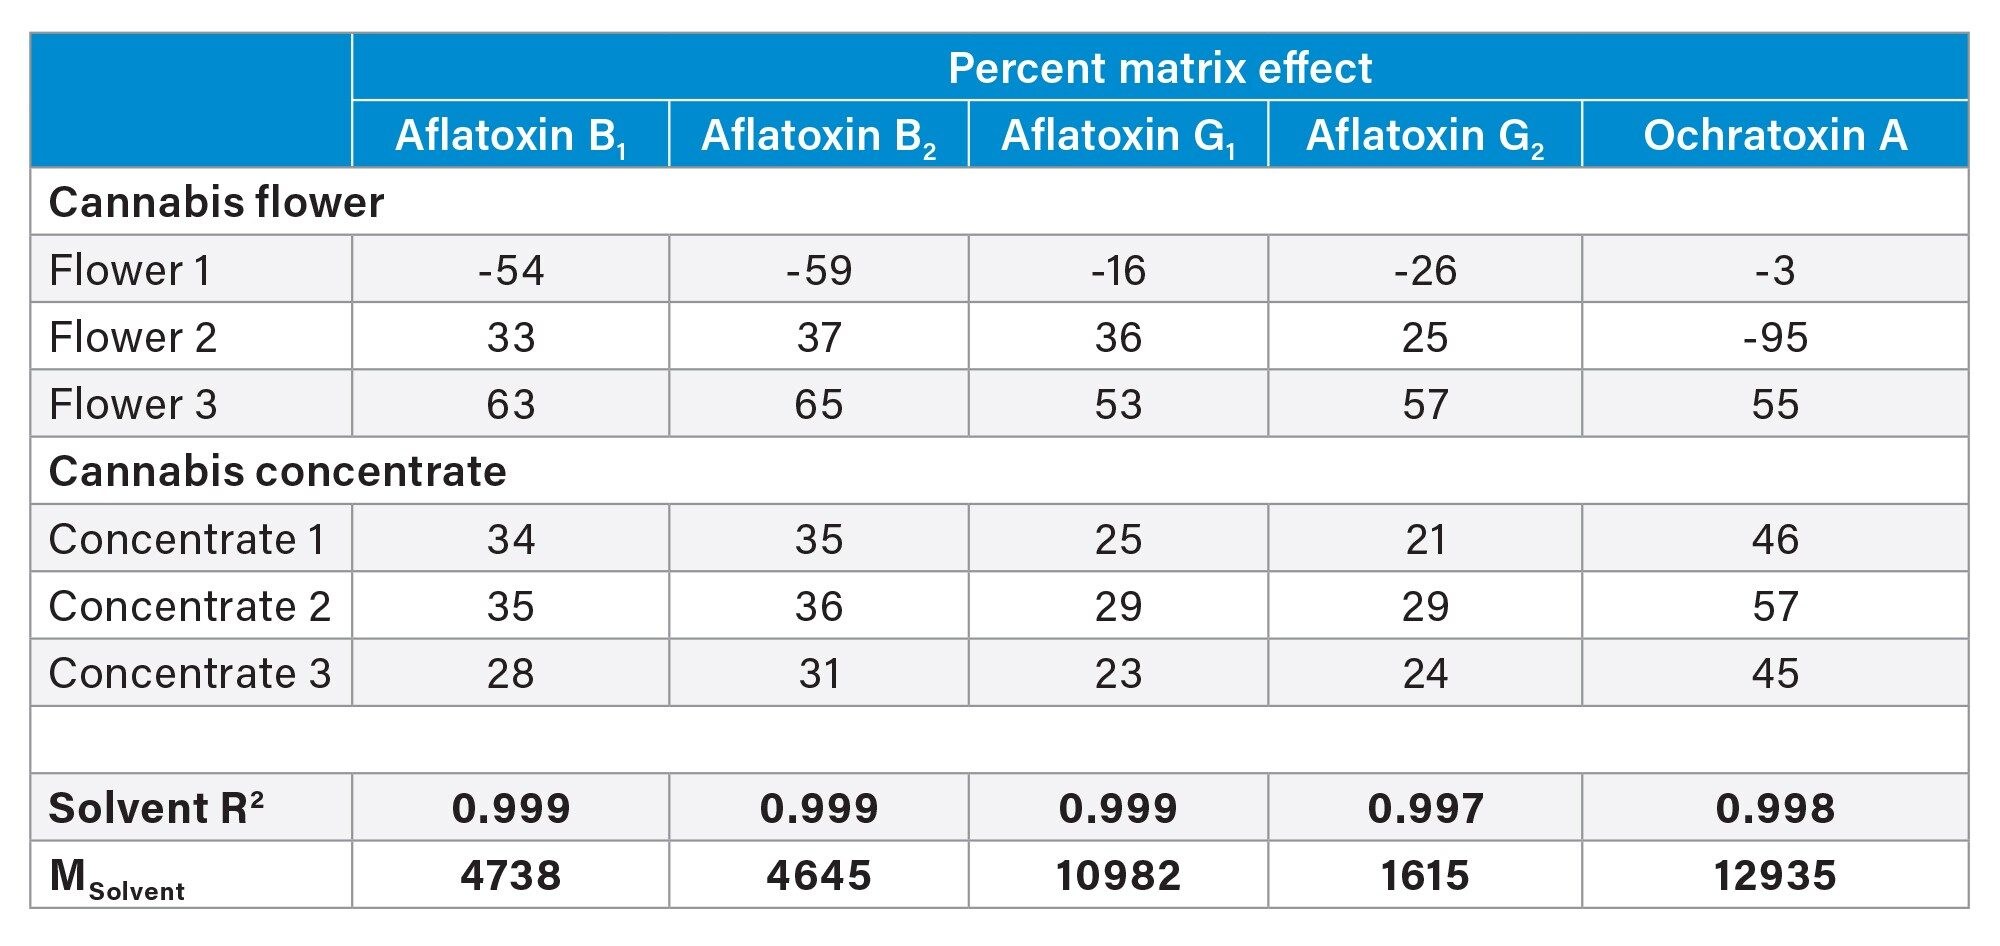 Table 3. Percent Matrix Effect Data.
Please note that washing the column during the wash step of the flower method with a higher percentage of Tween 20, for example 0.2%, 0.5% and 1%, may also help in reducing matrix effect in flower samples. In addition, stable isotope internal standards, matrix matched calibration standards for individual samples, or standard addition samples can be used to reduce variation. The Msolvent values refer to the slopes of the solvent based calibration curves.
Limit of Detection (LOD)
The limit of detection is the minimum level of analyte that can be confidently identified from the blank. The LOD is supported by repeatability and specificity. The LOD was determined at half of the lowest LOQ which resulted in 1.5 ppb for each individual Aflatoxin and 4.5 ppb for Ochratoxin A for type B samples and 2.5 ppb for each individual Aflatoxin and 7.5 ppb for Ochratoxin A for type A samples. Below is an example Total Ion Chromatogram (TIC) at LOD for cannabis concentrate (Type A sample).
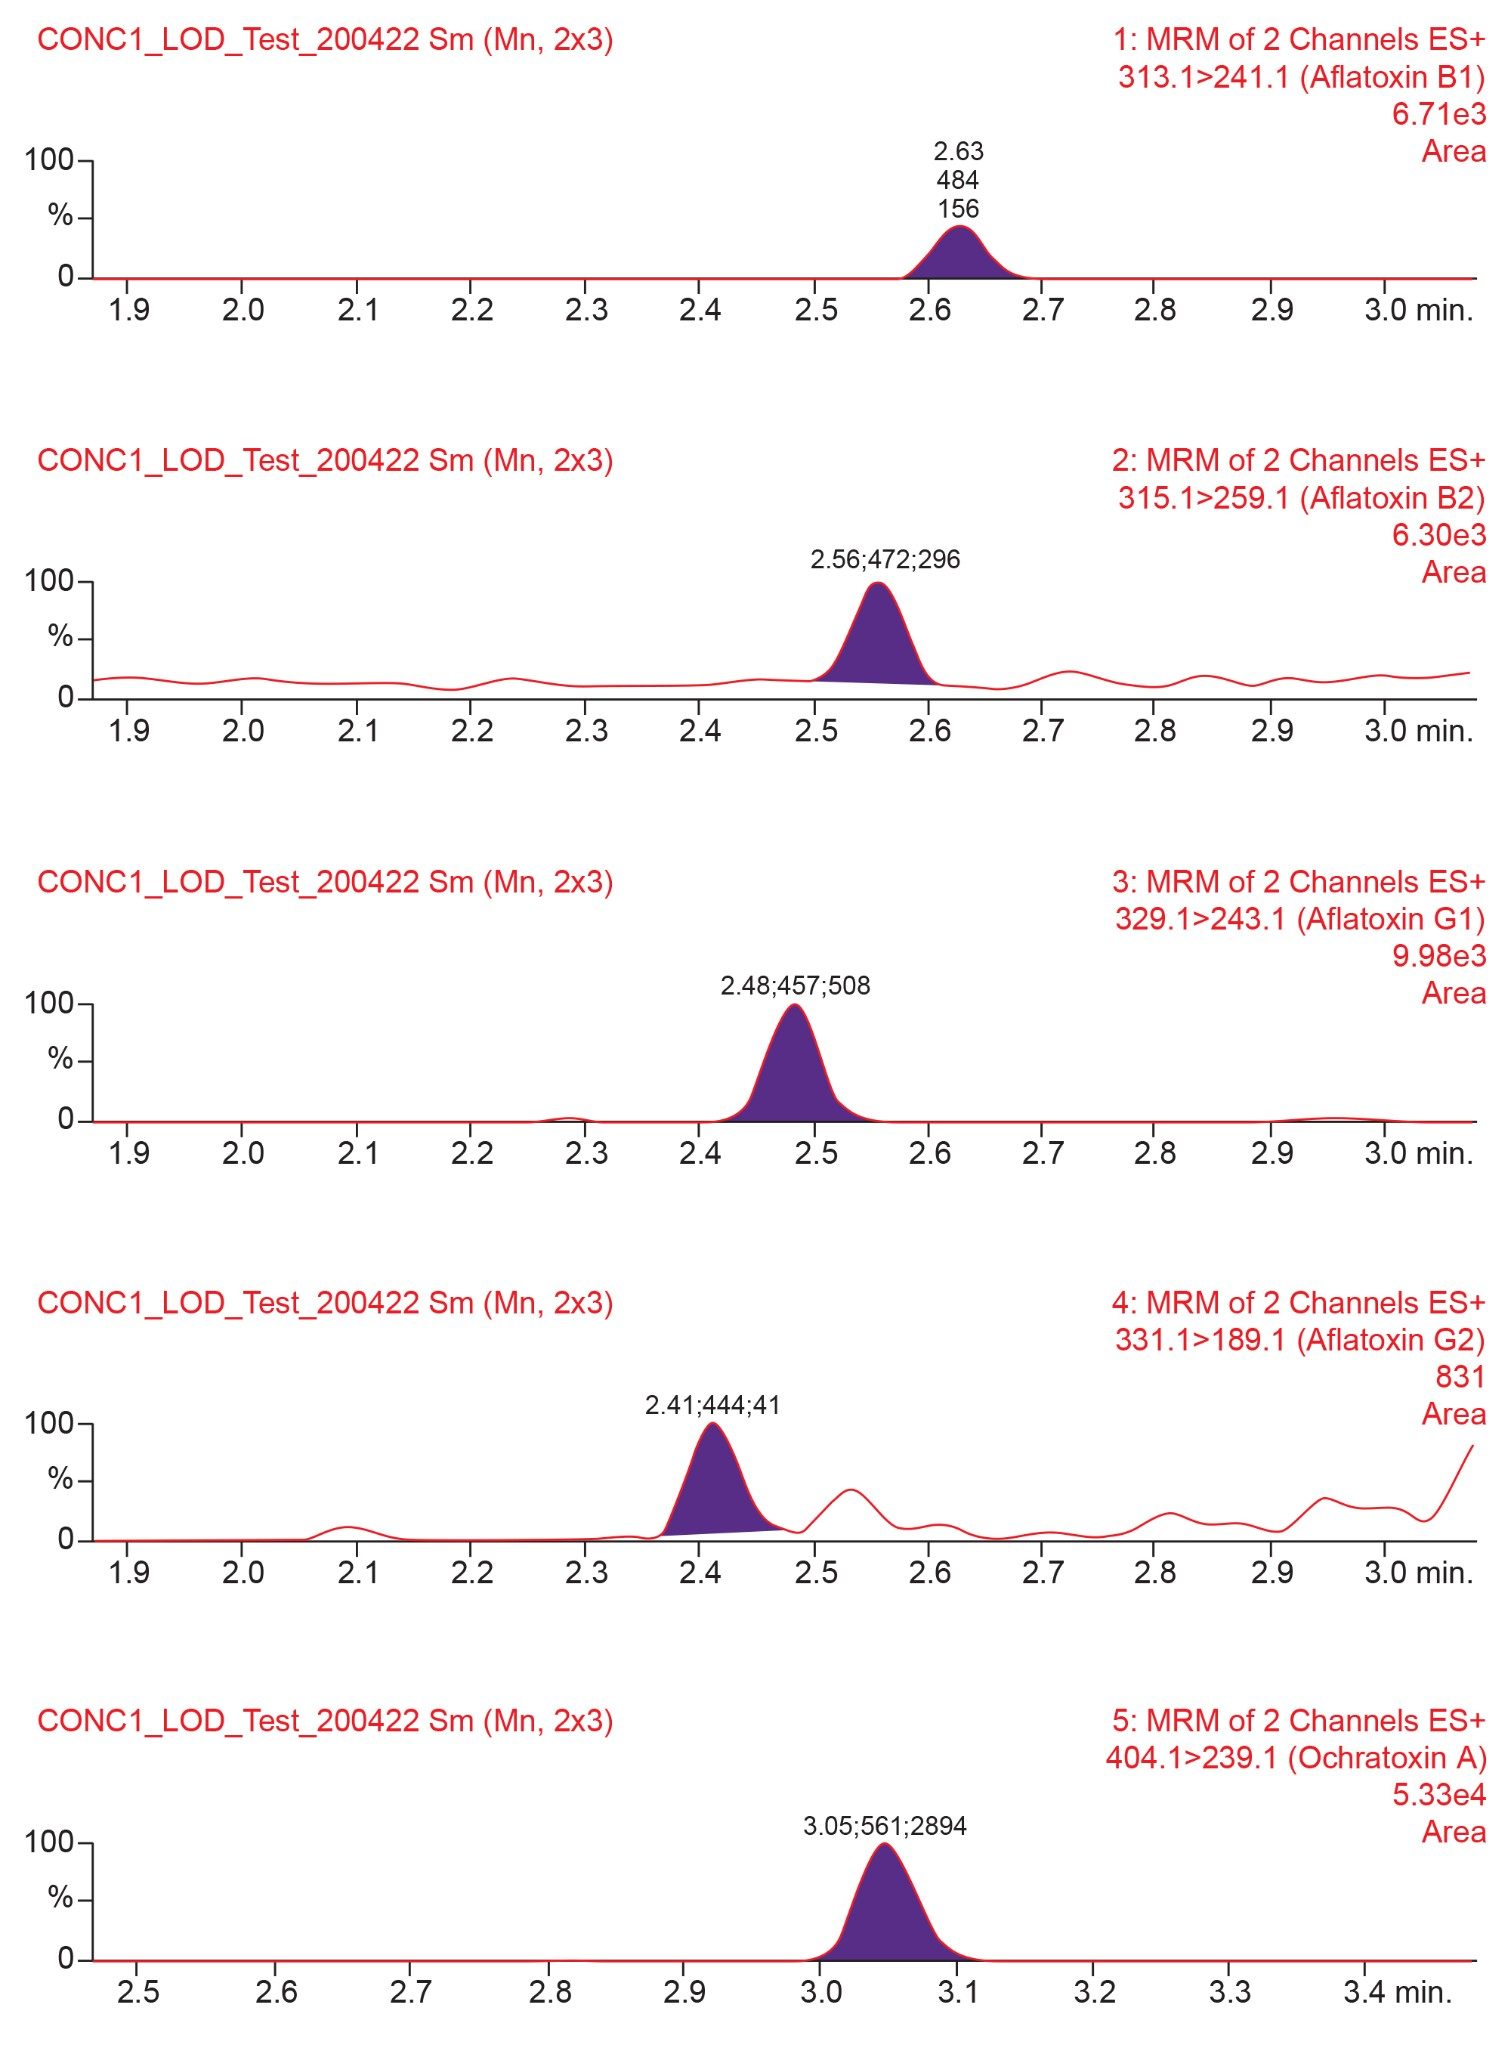 Figure 3. LOD Chromatogram for Cannabis Concentrate (Type A sample).
Accuracy/Limit of Quantitation
The lowest of the three spiking levels (Level 1) corresponds to the LOQ level. The LOQ level is the lowest level of analyte that can be identified and accurately quantitated. Accuracy was assessed for three example samples from each of five representative matrix classes including, cannabis plant material, cannabis oleoresins/concentrates, edible oils, topical products, and assorted edible products. Blank samples were spiked with analytes (pre-extraction) in duplicate at three different concentration levels (3–60 ng/g), allowed to stand at least 60 min, then extracted and analyzed. A single point standard addition calibration was used to compensate for matrix effects following the procedure outlined below.
The sample extract was split into two 285 µL aliquots, one was spiked with 15 µL of additional diluent, the other spiked with 15 µL of standard solution.
Recovery is calculated as

and is averaged across 6 replicates, two at each of three concentration levels.
Type A samples were classified as concentrate/oleoresin samples. Type B samples were classified as cannabis plant material and MIPS (Marijuana Infused Products) such as topicals, tinctures and edibles. Sample type A/B accuracy testing levels in ppb are listed in Table 4 below:
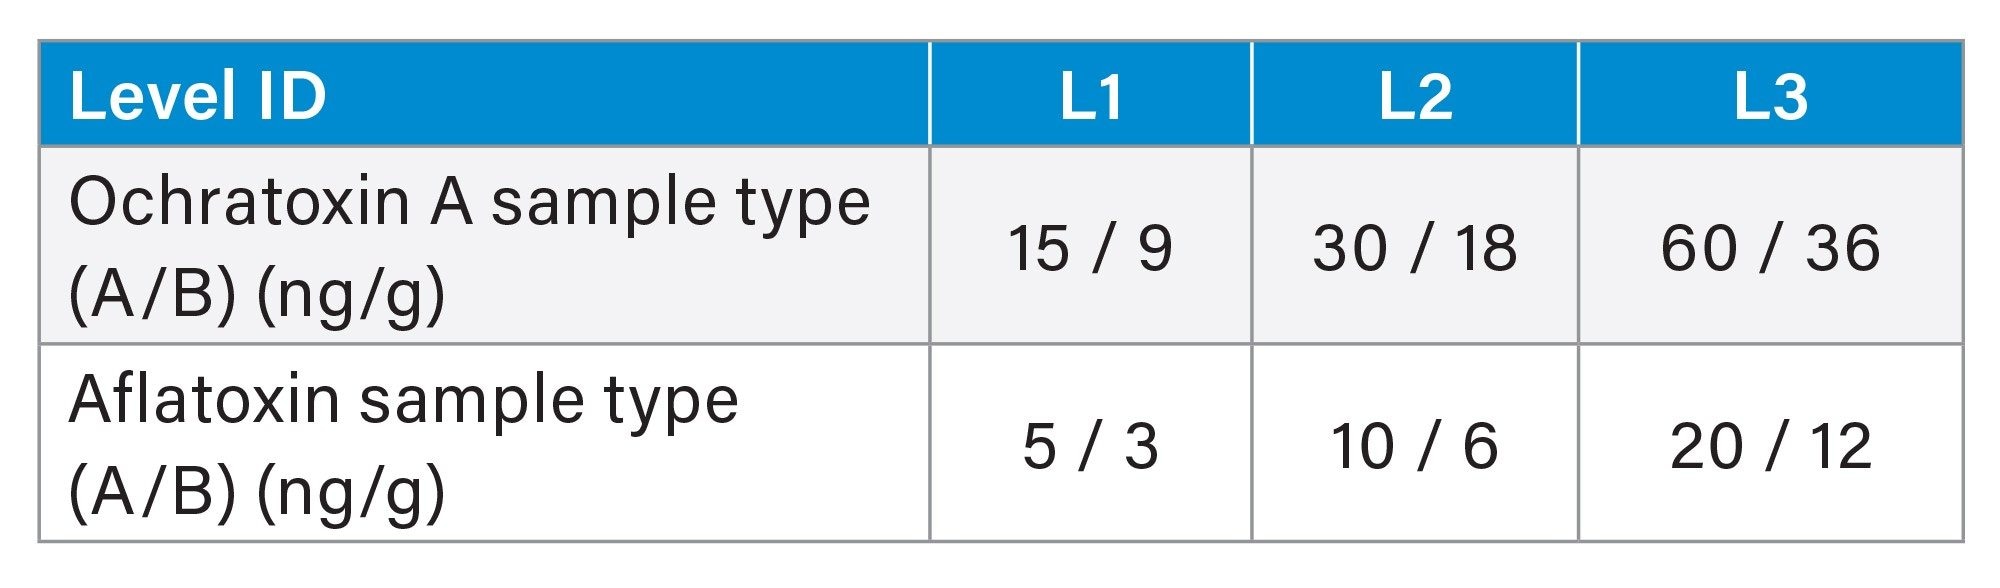 Table 4. Accuracy Levels.
The accuracy charts (Figures 4, 5, and 6) below show percent recovery for the L1, L2, and L3 spikes respectively.
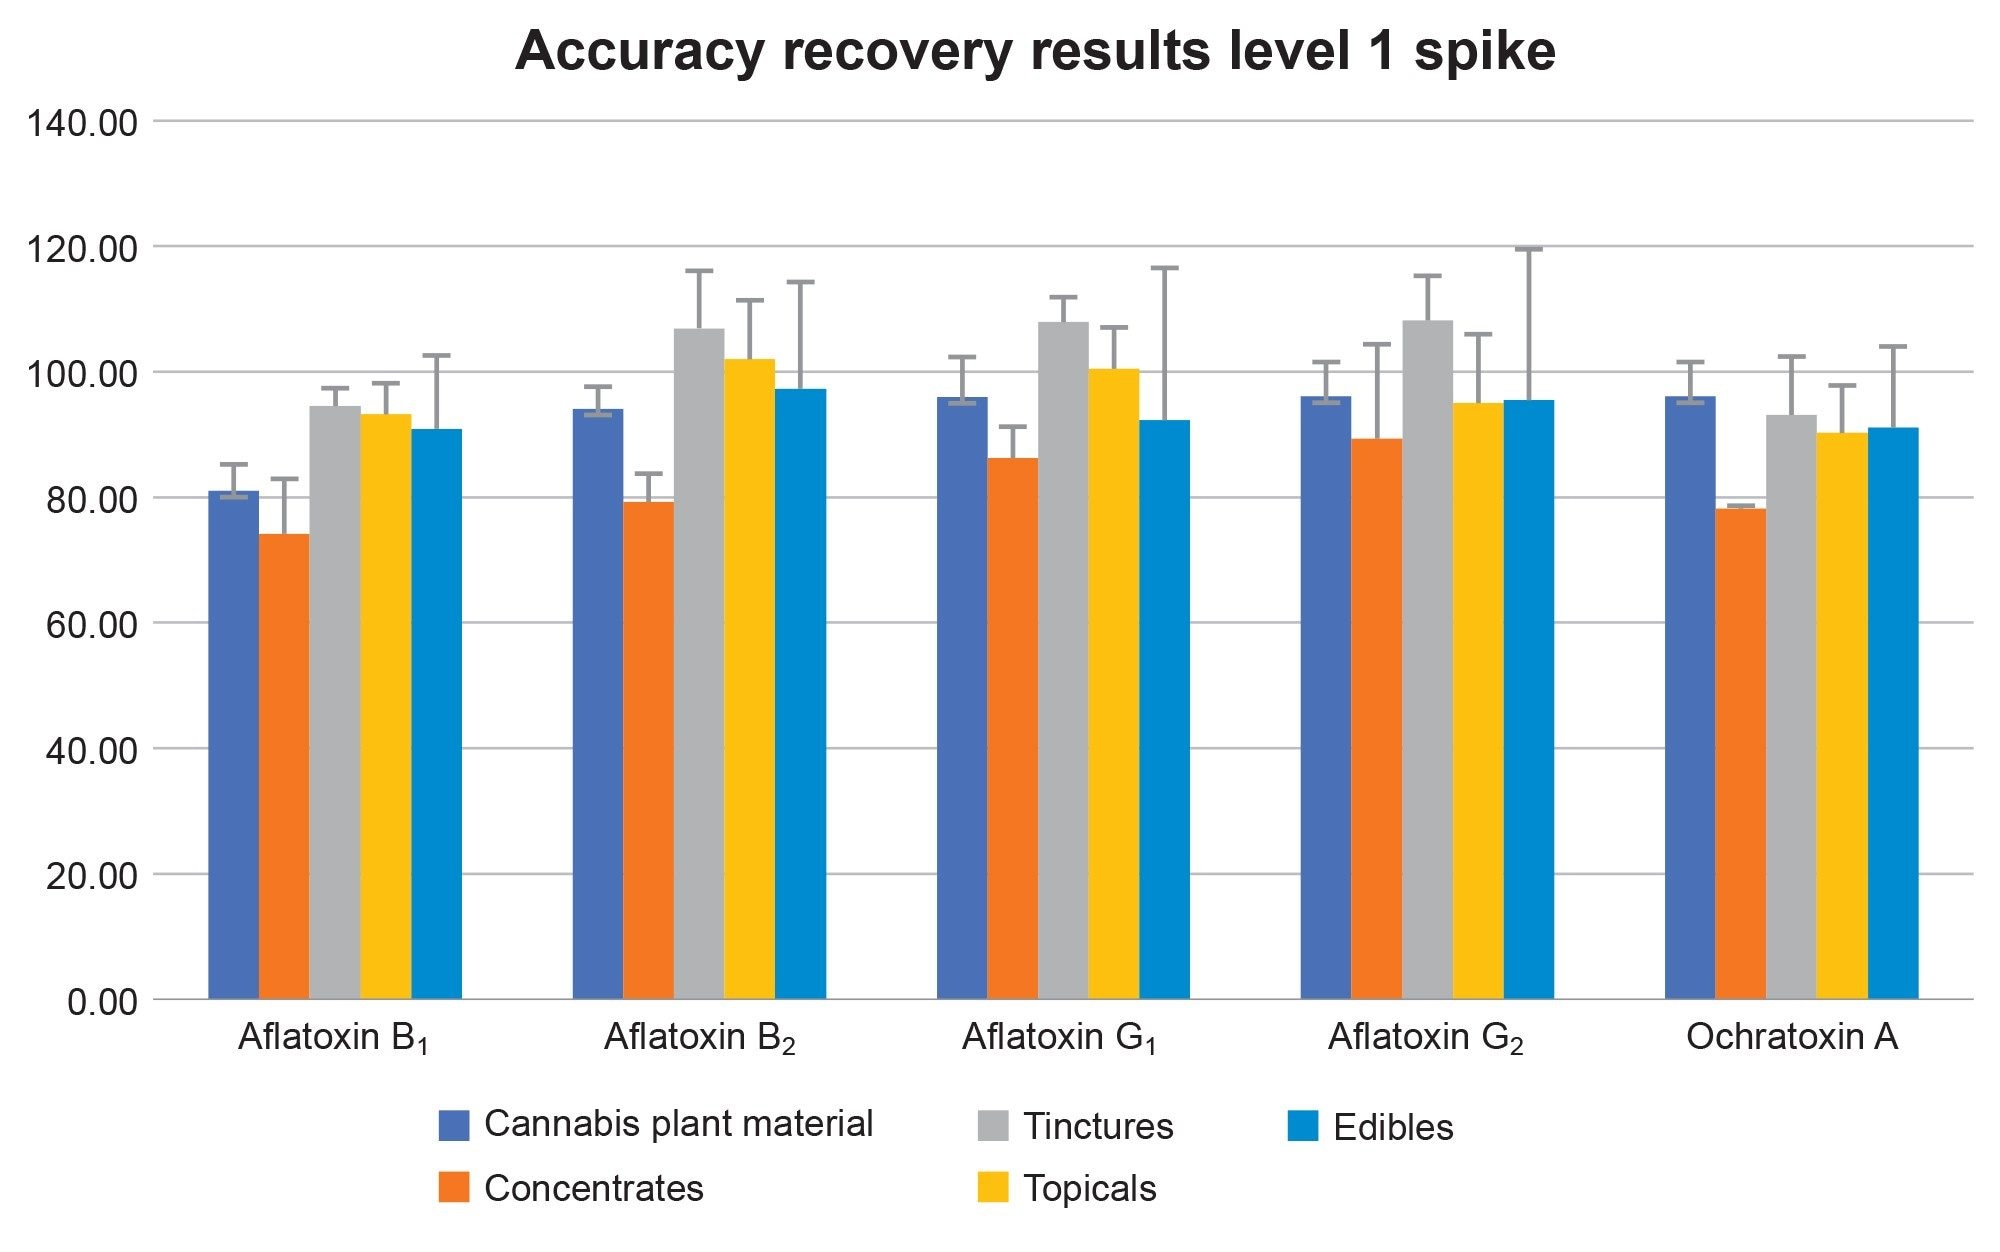 Figure 4. Accuracy Level 1: 3 ppb each individual Aflatoxin and 9 ppb Ochratoxin A for type B (cannabis plant material, topicals, tinctures, and edible) samples and 5 ppb each individual Aflatoxin and 15 ppb Ochratoxin A for type A (concentrate) samples.
 Figure 5. Accuracy Level 2: 6 ppb each individual Aflatoxin and 18 ppb Ochratoxin A for type B (cannabis plant material, topicals, tinctures, and edible) samples and 10 ppb each individual Aflatoxin and 30 ppb Ochratoxin A for type A (concentrate) samples.
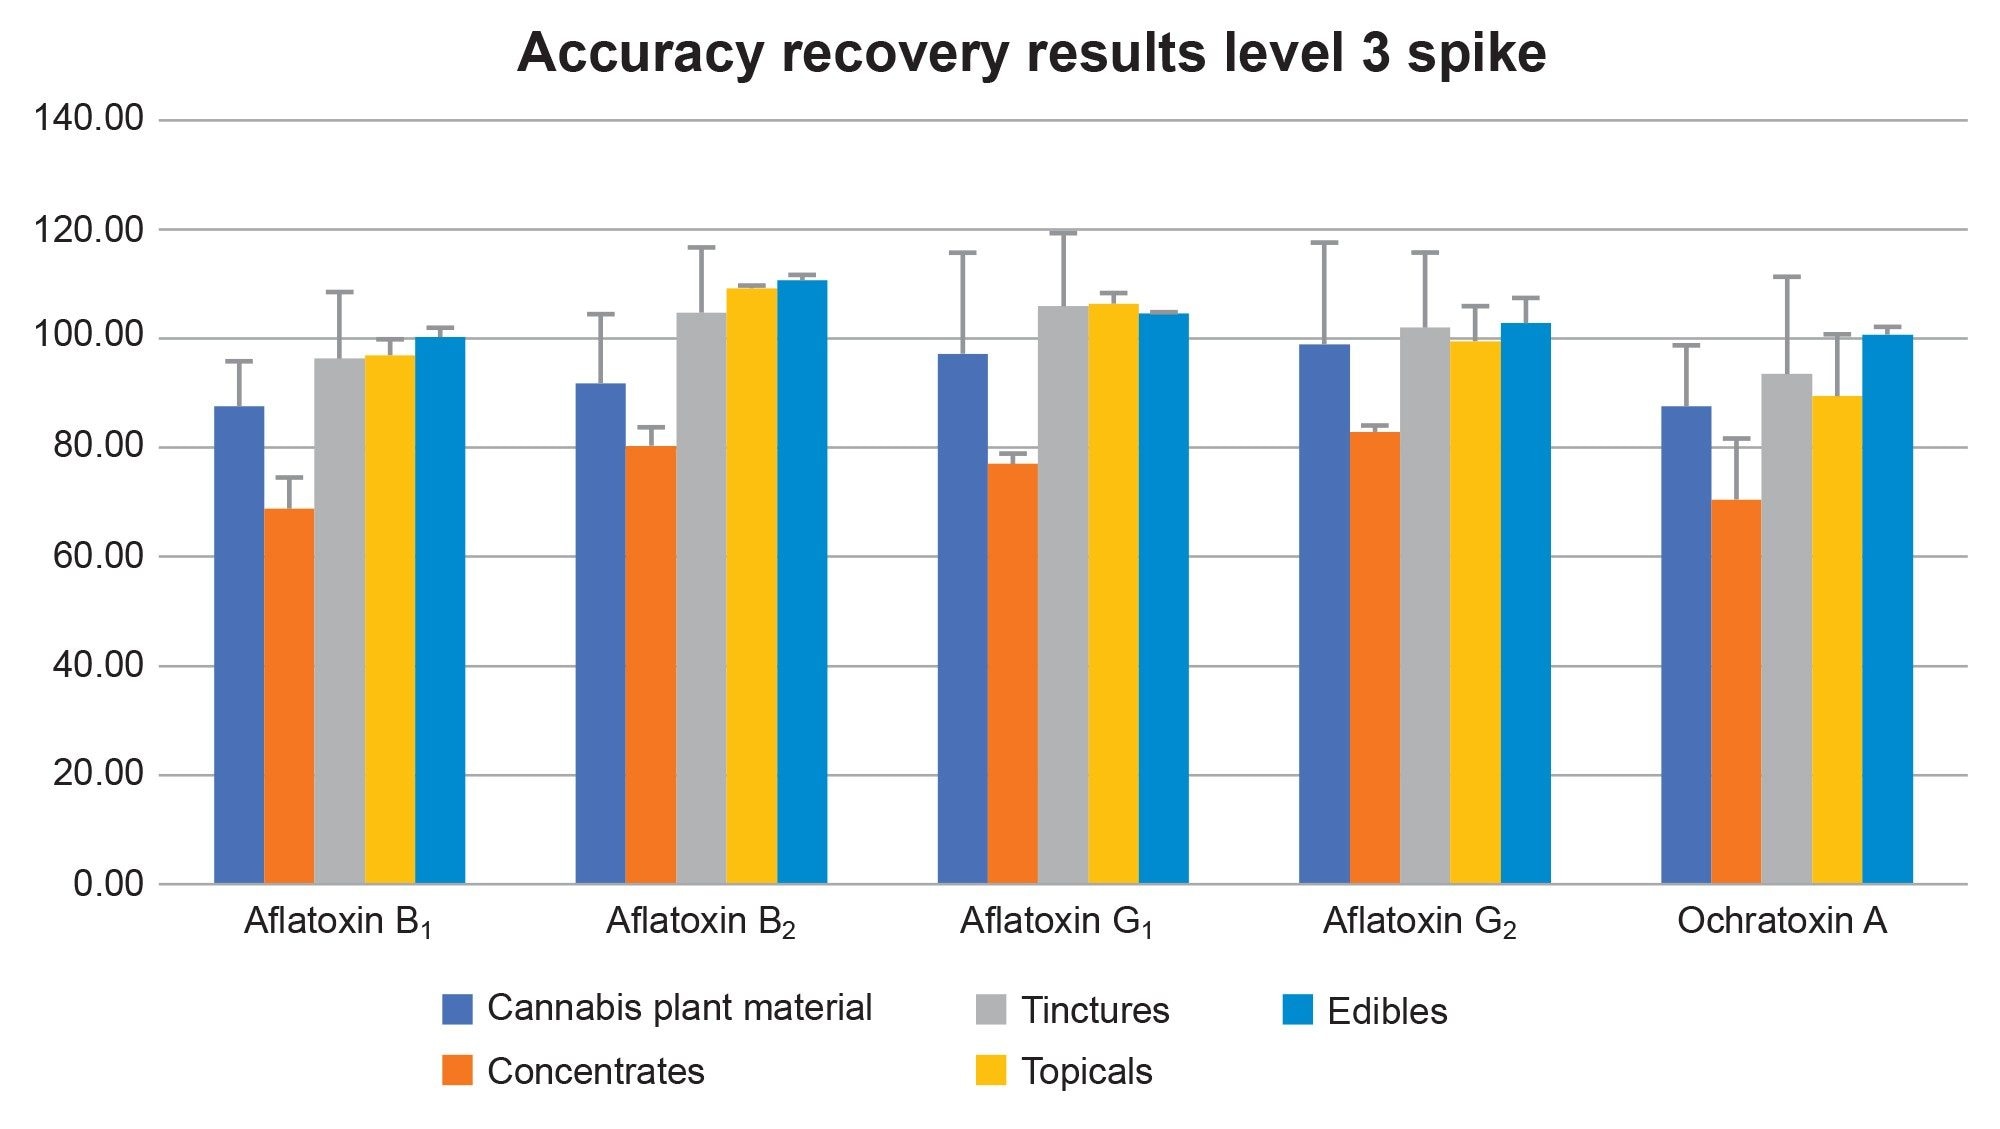 Figure 6. Accuracy Level 3: 12 ppb each individual Aflatoxin and 36 ppb Ochratoxin A for type B (cannabis plant material, topicals, tinctures, and edible) samples and 20 ppb each individual Aflatoxin and 60 ppb for Ochratoxin A for type A (concentrate) samples.
The LOQ for each individual Aflatoxin is 3 ppb for B type samples (flower, tinctures, topicals, and edibles) and 5 ppb for sample A (concentrates) type samples. The LOQ for Ochratoxin A is 9 ppb for sample B type samples (flower, tinctures, topicals, and edibles) and 15 ppb for sample A (concentrates) type samples.
Precision
Repeatability precision was assessed for one sample from each matrix class, cannabis plant material, cannabis oleoresins/concentrates, edible oils, topical products, and assorted edible products. Six (6) replicate blank samples of the five (5) matrix class samples were spiked with analytes (pre-extraction) at the L2 concentration level (6–30 ng/g), allowed to stand at least 30 min, then extracted and analyzed. The 30 replicates were processed by the same analyst on multiple days and analyzed on the same LC-MS system.
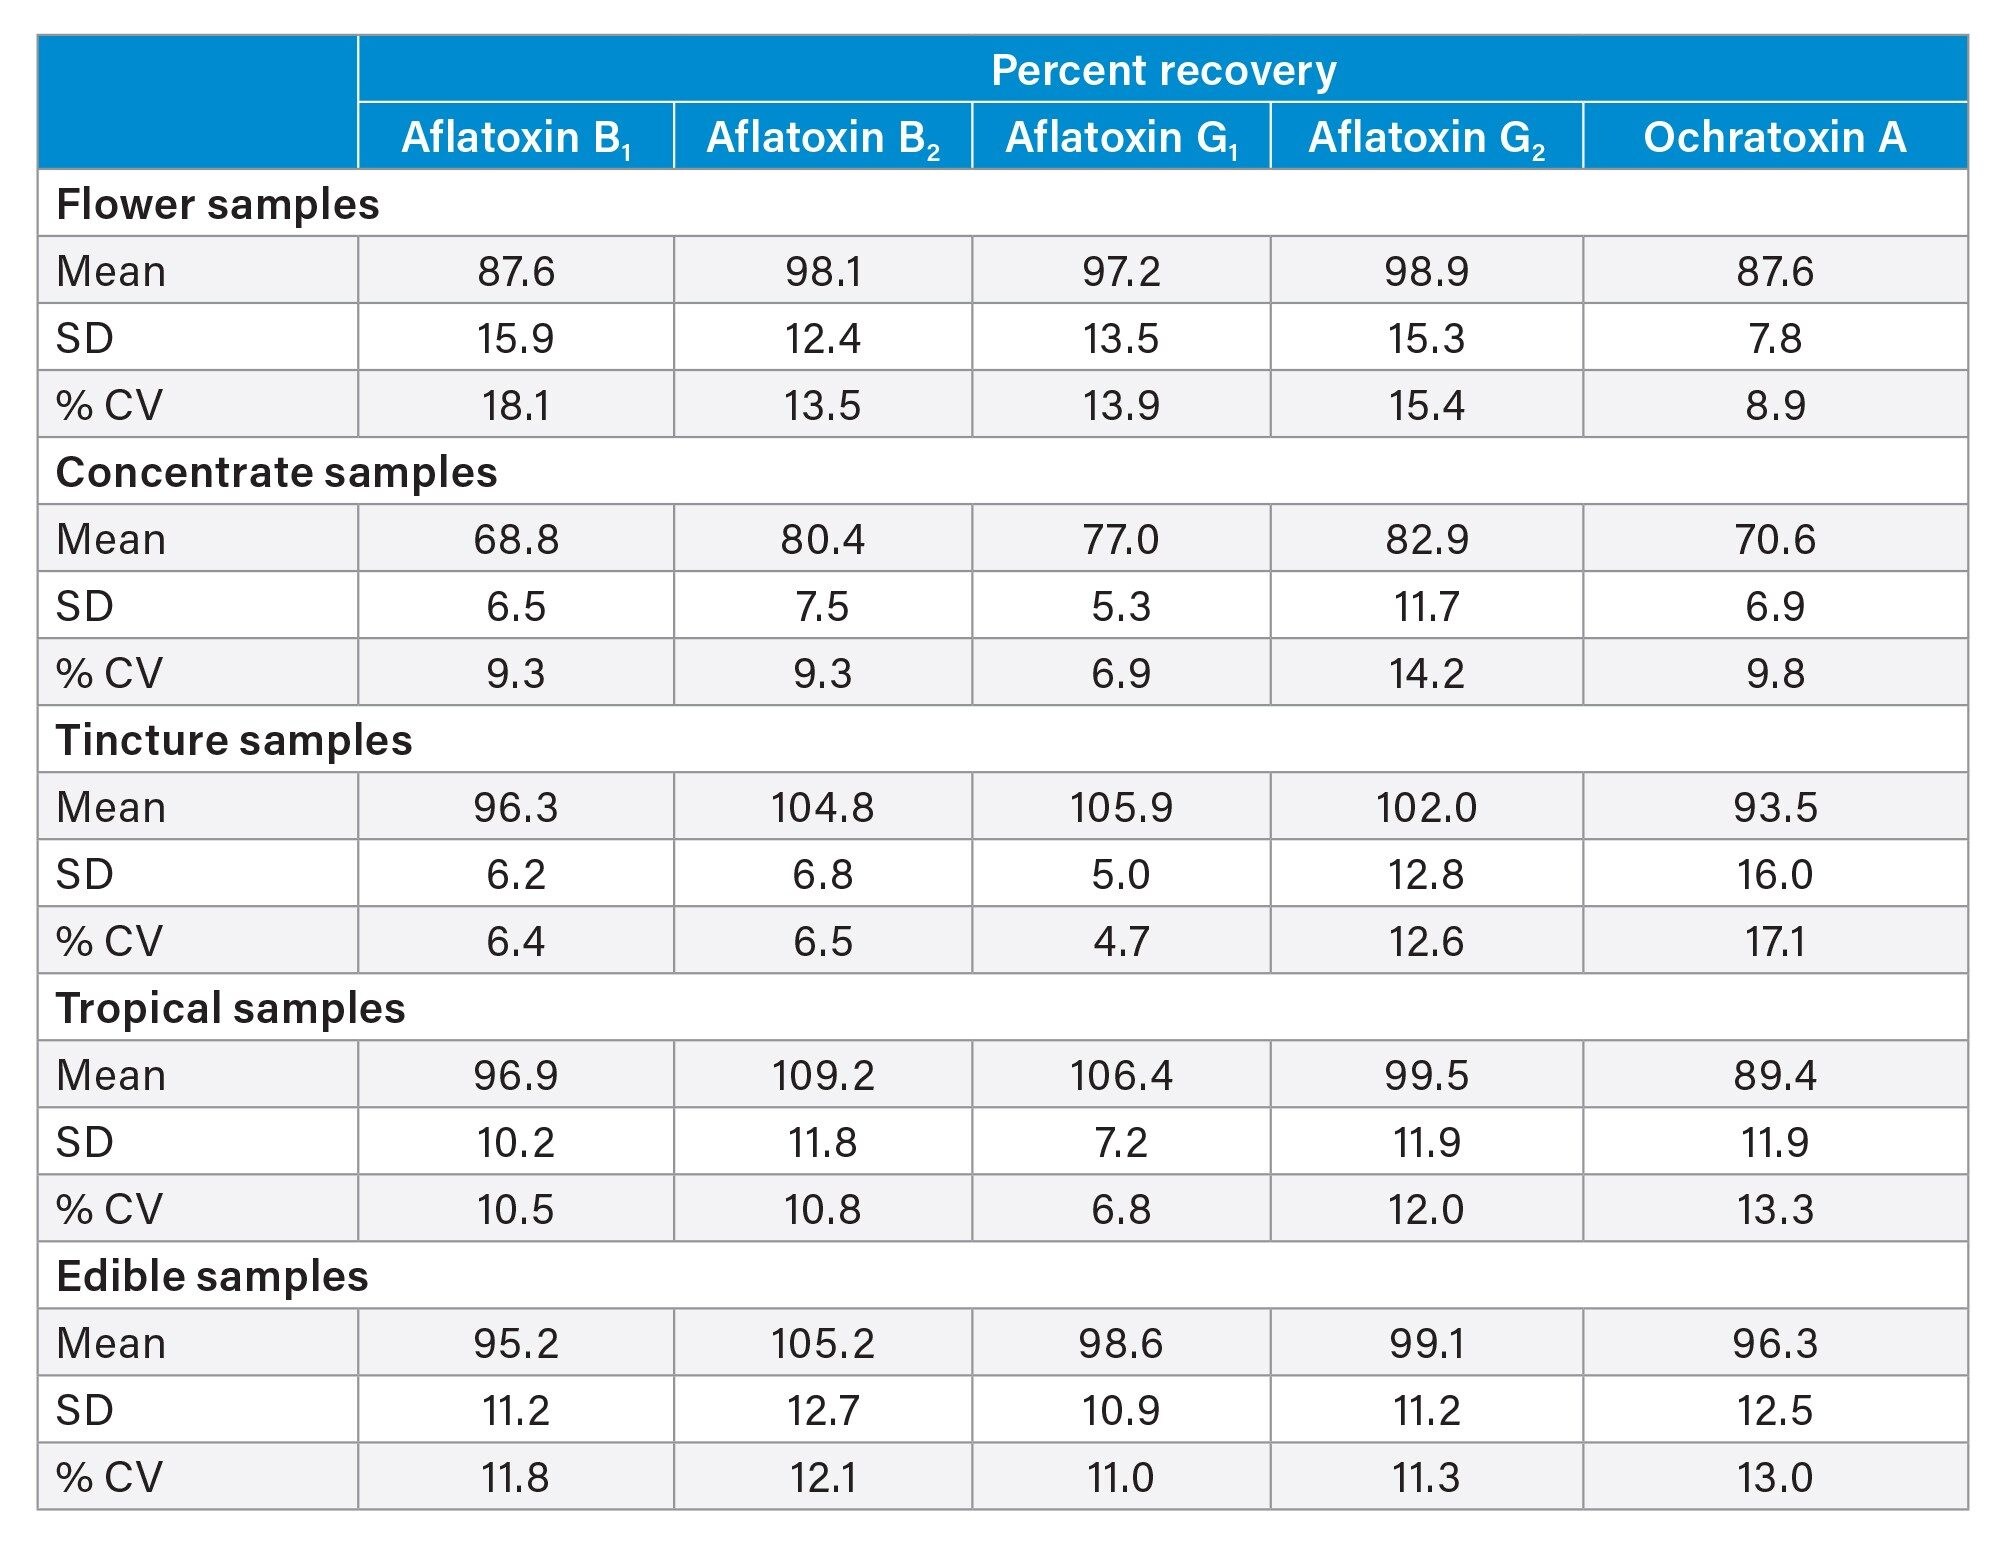 Table 5. Precision Results.
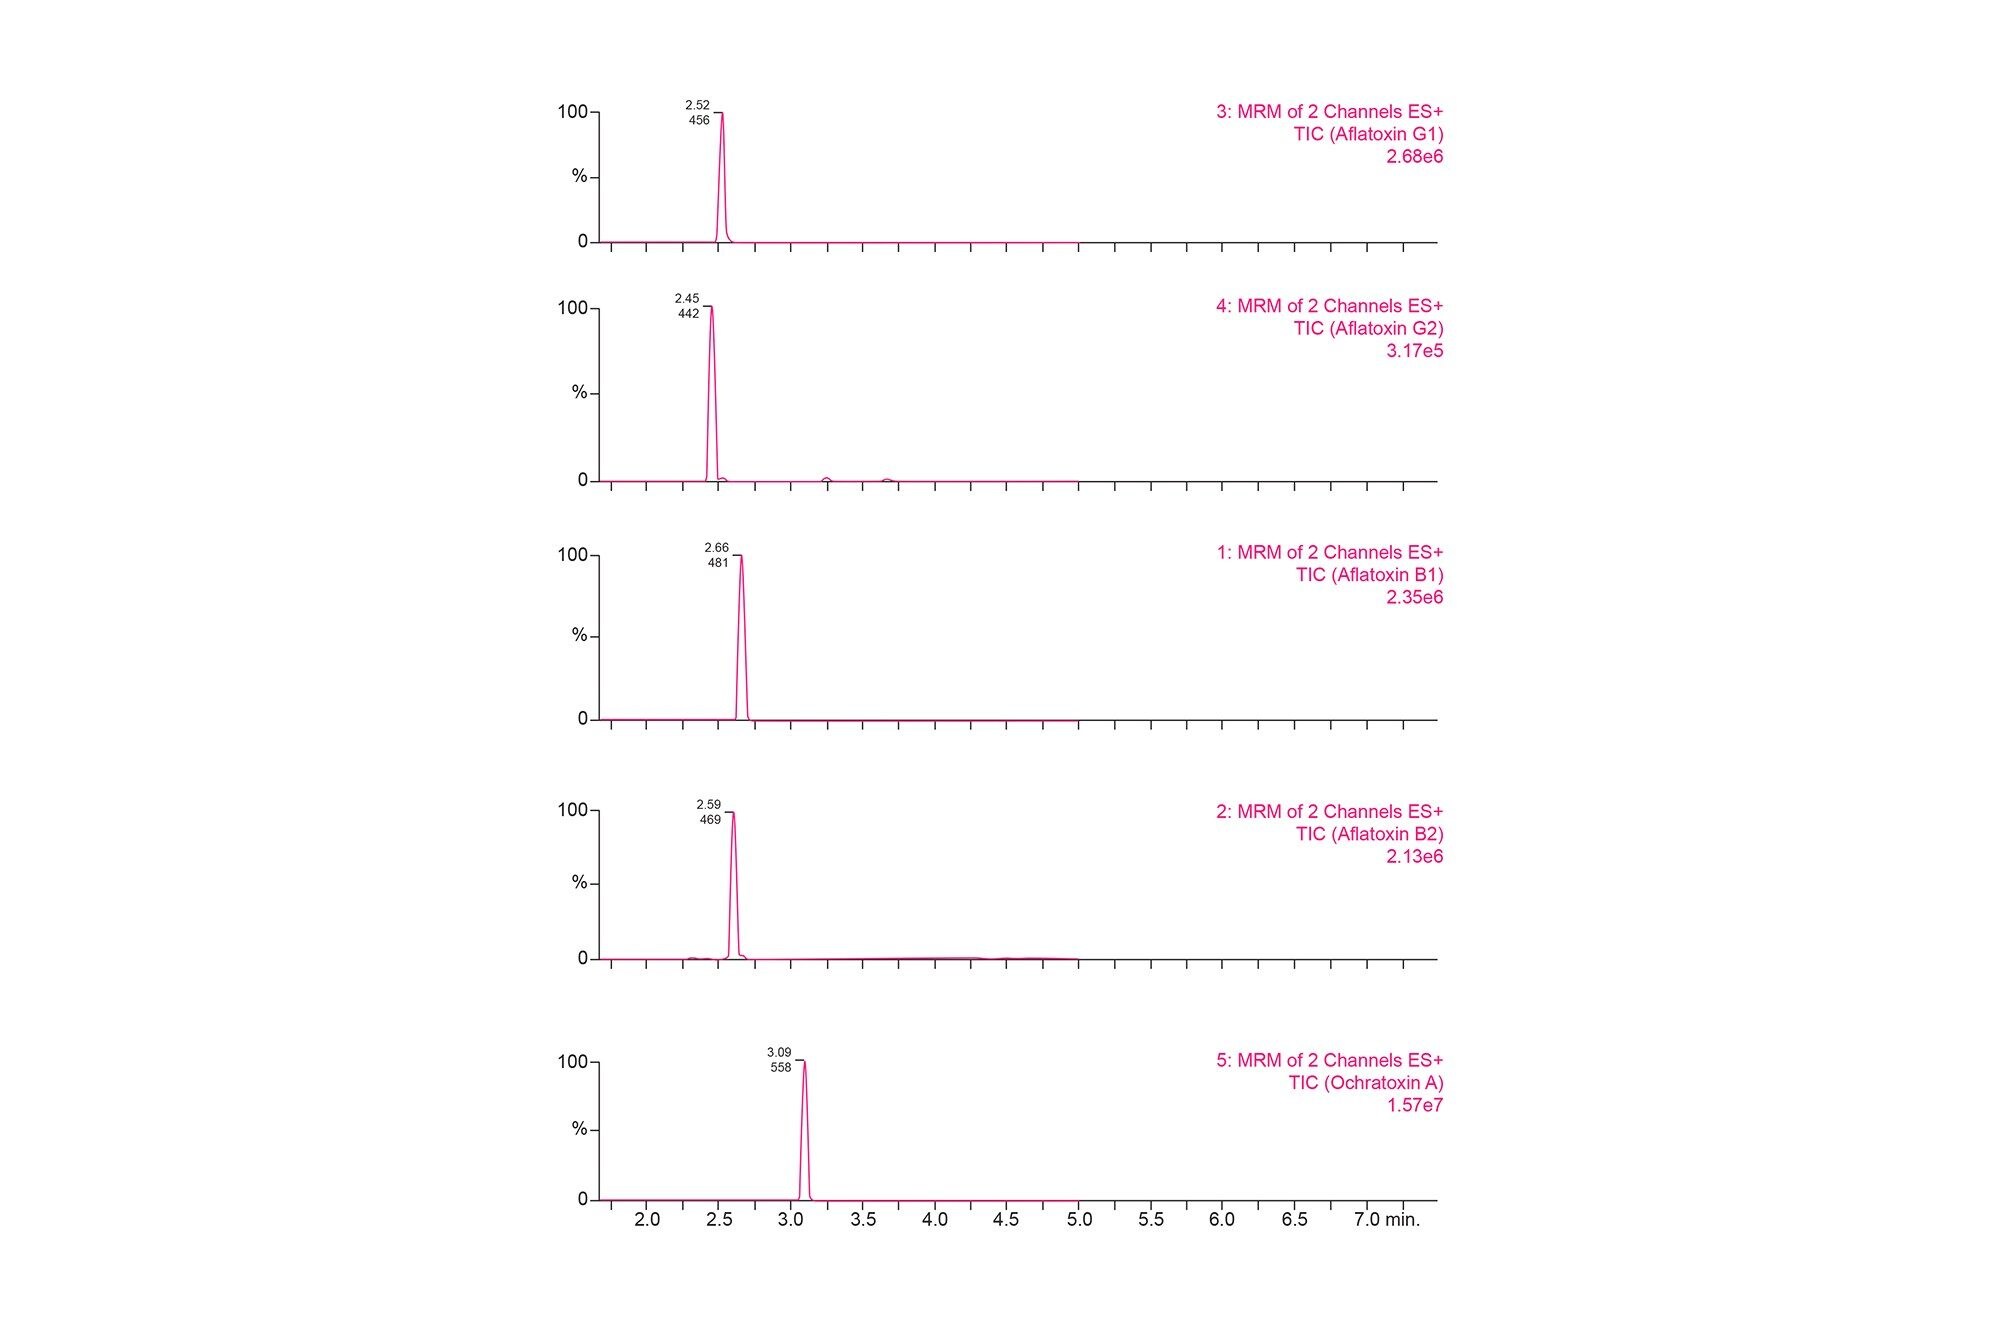 Figure 7. Total Ion Chromatogram. Aflatoxin B1 – 40 ppb, Aflatoxin B2 – 40 ppb, Aflatoxin G1 – 40 ppb, Aflatoxin G2 – 40 ppb, Ochratoxin A- 120 ppb.
Limit of Detection
- The LOD for this method is 1.5 ppb for each individual Aflatoxin and 4.5 ppb Ochratoxin A for type B samples and 2.5 ppb for each individual Aflatoxin and 7.5 ppb for Ochratoxin A for type A samples
- Lower limits of detection are possible if the sample eluate is dried down and reconstituted in a smaller volume. If drying down sample eluate, be sure to use silanized vials to prevent binding of Aflatoxin to glassware
Linearity/Matrix Effects
- The acceptance criteria for linearity and matrix effects are the coefficient of determination, R2 ≥0.98 (N=6). All acceptance criteria were met for linearity and matrix effects
- Type A samples have a linear assay range from 5 ppb to 200 ppb for each individual Aflatoxin and a linear assay range from 15 ppb to 600 ppb Ochratoxin A
- Type B samples have a linear assay range from 1 ppb to 40 ppb for each individual Aflatoxin and a linear assay range from 3 ppb to 120 ppb Ochratoxin A
Accuracy/Limit of Quantitation
- The acceptance criteria for accuracy at each level is recovery within the range of 60.0–115.0% (N=2). All the samples have passed the acceptance criteria. The lowest of the three spiking levels (Level 1) corresponds to the LOQ level
- The LOQ for each individual Aflatoxin is 3 ppb for B type samples (flower, tinctures, topicals, and edibles) and 5 ppb for sample A type samples (concentrates). The LOQ for Ochratoxin A is 9 ppb for sample B type samples (flower, tinctures, topicals, and edibles) and 15 ppb for sample A type samples (concentrates)
- The LOQ meets regulatory levels of 5 ppb Aflatoxin B1 or 20 ppb total Aflatoxin and regulatory levels of 20 ppb Ochratoxin A
- Lower limits of quantitation are possible if the sample eluate is dried down and reconstituted in a smaller volume. If drying down sample eluate, be sure to use silanized vials to prevent binding of Aflatoxin to glassware
Precision
- The data for precision with repeatability of each analyte in each matrix class is, %CV ≤20.0% (N=6)
Conclusion
- Accuracy met acceptance criteria with recovery for each sample type within the range of 60.0–115.0% (N=6). The LOQ for each individual Aflatoxin is 3 ppb for B type samples (flower, tinctures, topicals, and edibles) and 5 ppb for A type samples (concentrate). Type A samples exhibited a linear range from 5 to 200 ppb for each Aflatoxin and from 15 to 600 ppb for Ochratoxin A. Type B samples exhibited a linear range from 1 to 40 ppb for each Aflatoxin and from 3 to 120 ppb for Ochratoxin A. Precision meets acceptance criteria for repeatability of each analyte in each matrix class, %CV ≤20.0% (N=6)
- LC-MS/MS with immunoaffinity provides a solution for the analysis of difficult cannabis matrices by demonstrating effective matrix cleanup, method robustness, accuracy, and precision while meeting required regulatory levels
References
- U.S. Food and Drug Administration Foods Program, “Guidelines for the Validation of Chemical Methods in Food, Feed, Cosmetics, and Veterinary Products”, 3rd edition, October 2019.
- USDA GIPSA, “Grain, Fungal Diseases, and Mycotoxin Reference”, Washington D.C., Sept. 2006.
720007096, February 2021