Development of a New Gradient Elution Program for the Analysis of Amino Acids in Pet Foods and Plant Proteins
Abstract
The AOAC International Official Method 2018.06 specifies an analytical procedure for the analysis of amino acids in infant formula, adult nutrition, and dairy products. This procedure is based on pre-column derivatization with 6-aminoquinolyl-N-hydroxysuccinimidyl carbamate (AQC) and reversed-phase ultra-performance liquid chromatography (UPLC™) with UV detection. Hydroxyproline is generally absent in milk, adult nutrition, or dairy products, and is therefore not within the scope of the AOAC Method 2018.06. However, hydroxyproline is an essential constituent of collagen, the most abundant protein in animals, and is often found in pet foods. Additionally, hydroxyproline is frequently analyzed as a marker for contamination or adulteration in plant proteins. So, to adapt the AOAC Method 2018.06 to pet foods and plant proteins, the gradient elution program specified in the AOAC method has been modified and optimized to improve the retention and separation of hydroxyproline and other amino acids. An analytical quality by design (aQbD) approach has been adopted in the method development, and the mass spectra of amino acids have also been used to confirm the peak identities. All the amino acids were baseline separated (resolution ≥2) under the optimized gradient elution conditions with excellent repeatability and robustness. The sensitivity and linearity were comparable to those of the AOAC Method 2018.06. This new gradient elution program has been successfully applied to six common pet foods and four plant proteins with excellent results. This modified AOAC Method offers a viable solution for the amino acid analysis of pet foods and plant proteins.
Benefits
- The optimized gradient elution provides a baseline separation of relevant amino acids, adapting the AOAC Method to pet foods and plant proteins
- The ACQUITY™ Premier System and the AccQ Tag™ Ultra C18 Column offer a superior resolution for the analysis of amino acids in pet foods and plant proteins
Introduction
Amino acids (AA) provide essential nutrients for the growth and well-being of humans and animals. Previously, we demonstrated the successful implementation of the AOAC Method 2018.06 for the analysis of AA in dairy products using the ACQUITY Premier System equipped with a Binary Solvent Manager and a Fixed Loop Sample Manager.1 When we applied this AOAC Method to the analysis of AA in pet foods, however, we identified a gap in the target AA list. Hydroxyproline (HyPro), a common AA in pet foods, exhibited limited retention on the column and could therefore not be analyzed using the AOAC Method. HyPro is an essential constituent of collagen, the most abundant protein in tissues such as ligaments, tendons, cartilage, skin, and bones. It is also a common AA in animal-derived feedstuffs, including pet foods. HyPro is often analyzed as a marker for potential food adulteration using hydrolyzed animal products to boost the protein content and is a signature AA for the animal-derived gelatin and collagen, used to detect the presence of these critical food ingredients in halal or kosher foods.2,3 Therefore, it is necessary to develop an analytical method that allows the separation and analysis of HyPro along with other AA.
In this study, the gradient elution program in the AOAC Method 2018.06 was modified by developing a new gradient elution program to enable the analysis of HyPro along with other AA. The details of the method development and the analytical performance of the developed method are presented. Representative pet foods and plant proteins were analyzed using the developed gradient elution conditions and the results are discussed.
Experimental
In this study, the analytical procedure specified in the AOAC Method 2018.06 was followed, with the exception that the gradient elution program was modified. The key hydrolysis and derivatization procedures are briefly described here.
AA Calibration Standards
The AA Cell Culture Standard Kit (p/n: 186009300) contained 0.5 mM of each of the following amino acids (except cystine at 0.25 mM) in the prepared stock solution: alanine (Ala), arginine (Arg), aspartic acid (Asp), cystine (Cys), glutamic acid (Glu), glycine (Gly), histidine (His), isoleucine (Ile), leucine (Leu), lysine (Lys), methionine (Met), phenylalanine (Phe), proline (Pro), serine (Ser), threonine (Thr), tyrosine (Tyr), valine (Val), HyPro, taurine (Tau), asparagine (Asn), glutamine (Gln), ornithine (Orn), hydroxylysine (HyLys), α-aminobutyric acid (AABA), γ-aminobutyric acid (GABA), and tryptophan (Trp). A 0.05-mM AA solution was prepared from the 0.5 mM AA stock solution by dilution with 0.1 M HCl. Norvaline (Nva) was used as an internal standard (IS). A 10-mM Nva stock solution was prepared by weighing out 117.16 mg Nva into a 100-mL volumetric flask and dilution to the mark with 0.1 M HCl. A 2.5-mM Nva solution was prepared from the 10-mM Nva stock solution by dilution with 0.1 M HCl. AA calibration standard solutions at 0–19.2 µM (pmol/µL) and Nva at 7.7 µM in final solutions (after derivatization) were prepared according to Table 1.
Note: These final concentrations were different from those in the AOAC Method 2018.06 because a modified derivatization reagent volume ratio was used.
Cys was not used for calibration, although it was presented in this solution. Its calibration curve was established by Cys standard solutions that were prepared separately (described later). Other AA, such as Asn, Gln, AABA, GABA, and Trp, were used mainly for resolution or interference checks.
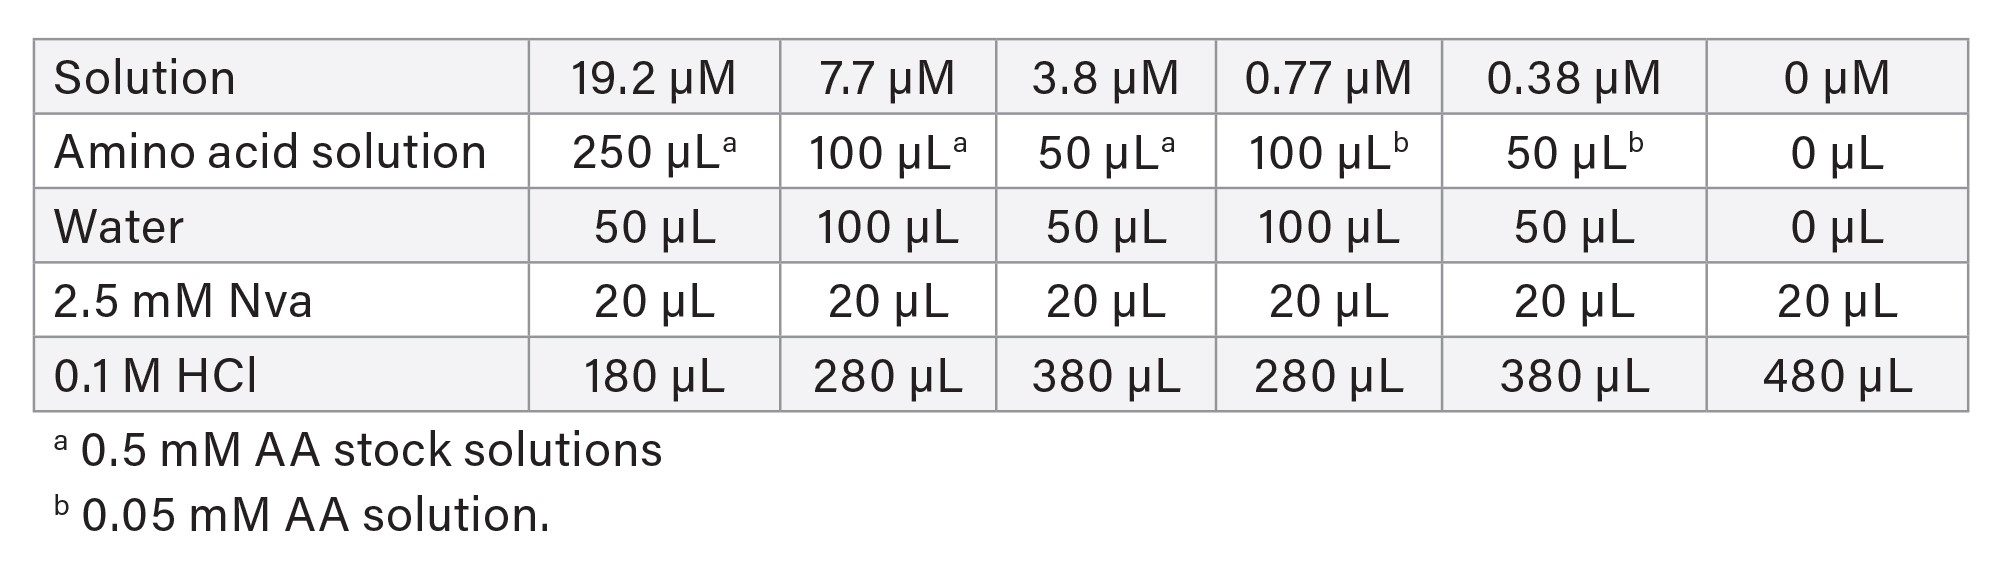 Table 1. Amino acid calibration standard solution preparation and concentrations.
Cys Calibration Standards
Cys stock solution (10 mM) was prepared by weighing out 240 mg Cys (recorded in 0.01 mg) into a 100-mL volumetric flask and dilution to the mark with 0.05 M NaOH. Cys solution (1 mM) was prepared by diluting the Cys stock solution with 0.05 M NaOH. The 10-mM Cys stock solution was kept at –20 °C for up to three months. The 1-mM Cys solution was prepared freshly for each analysis.
Cys calibration standards were prepared by adding 0, 10, 20, 50, 100, and 200 µL of 10-mM Cys stock solution into 10-mL vials, completed to 1100 µL with water, then, to each vial, added 600 µL DDP (3,3’- dithiodipropionic acid) solution (1% DDP in 0.2 M NaOH), 600 µL 0.2 M HCl, 200 µL 10-mM Nva stock solution, and 2500 µL phenol–HCl solution (0.1% phenol in 12 M HCl).
Note: The Phenol–HCl solution must be added under the fume hood.
Vials were sparged for a minimum of five seconds with a stream of nitrogen to displace oxygen. Vials were closed with screw caps and mixed on a vortex mixer. These Cys calibration standards were hydrolyzed under the conditions described later. The final concentrations after derivatization for these standard solutions were 0, 0.38, 0.77, 1.9, 3.8, and 7.7 µM, respectively. The final Nva (IS) concentration was 3.8 µM.
Note: Cystine and cysteine were converted to S-2-carboxyethylthiocysteine (XCys) by DDP in the acid hydrolysisef.4 The sum of cystine and cysteine was calculated from the XCys content.
Sample Preparation
Six pet food products and four plant protein powder products from major brands were purchased online. The pet foods included a dry dog food, a wet dog food, a dry cat food, a dry cat treat, a wet cat food, and a chicken feed product. The plant protein powder products included a pea protein, a brown rice protein, a pumpkin seed protein, and a soy protein powder product. The pet foods were first prepared by mixing 5.0 g of samples with water to form 80 g of mixtures (recorded mass to 0.01 g), then homogenized thoroughly using a blender. The plant protein powders were first prepared by mixing 1.0 g powder with water to form 40 g of mixtures (recorded mass to 0.01 g). Then, 800±20 mg of the homogenized sample-water mixtures (pet foods or plant proteins) were weighted into 10-mL glass vessels with screw caps (recorded mass to 0.01 mg). To each vessel, 600 µL DDP solution (1% DDP in 0.2 M NaOH), 600 µL 0.2 M HCl, 500 µL 10-mM Nva stock solution, and 2500 µL phenol–HCl solution (0.1% phenol in 12 M HCl) were added. The final Nva (IS) concentration in the final solution (after derivatization) was 7.7 µM.
Acid Hydrolysis (Samples and Cys standards only, no AA standards)
Vessels that contain sample solutions or Cys calibration solutions were placed in an oven at 110±2 °C for 24±0.5 h.
Alternatively, samples were hydrolyzed using a microwave hydrolysis device (Discover Prep, CEM Corp, NC). 35 mL borosilicate glass pressure vessels (pressure rated up to 300 psi) (CEM p/n: 909036) were used along with silicone caps (CEM p/n: 909350). Teflon coated micro stir bars (CEM p/n: 162810) were used for mixing. The acid hydrolysis step was carried out using the following parameters: Dynamic Control with a max power setting of 300 W; temperature set at 160 °C for 20 min; the pressure limit set at 300 psi; stirring level set to High; Nitrogen gas blow during cooling. This microwave-assisted hydrolysis was not part of the AOAC Method 2018.06, but it was used as an alternative hydrolysis approach.
Neutralization and Dilution (Samples and Cys Standards)
Following the acid hydrolysis, hydrolysates were allowed to cool down. Then, 0.2 mL of each hydrolysate was transferred into a 1.5-mL microtube, followed by addition of 0.2 mL 6 M NaOH and 1.6 mL 0.1 M HCl. The mixture was thoroughly mixed and then filtered through a 0.45-µm PVDF membrane filter into a separate 1.5-mL microtube.
Derivatization (Samples, Cys Standards, and AA Standards)
The AOAC Method 2018.06 derivatization procedure or the Care and Use manual of the AccQ Tag Ultra Derivatization Kit (p/n: 186003836) was followed in the preparation of the AccQ Tag Ultra Derivatization Reagents.5 Then the AA calibration standards, neutralized sample solutions, and neutralized Cys standards were derivatized with the reagents at the following volumes, 100 µL AccQ Tag Ultra Borate Buffer (reagent 1 in the AccQ Tag Ultra Derivatization kit), 10 µL calibration standard solutions, or neutralized sample solutions, or neutralized Cys standard solutions, and 20 µL reconstituted AccQ Tag Ultra Reagent.
Liquid Chromatography Conditions
|
System: |
The ACQUITY Premier System consisted of a Binary Solvent Manager, a Fixed Loop Sample Manager, a Column Heater with active pre-heater (CH-A), and a Photodiode Array (PDA) eλ Detector. |
|
UV/Vis wavelength: |
260 nm |
|
Inlet tubing to Det.: |
0.004 mm ID, 10.5 in tubing assembly (p/n: 430001784) |
|
Software: |
Empower™ 3 Chromatography Data System (CDS) |
|
Column: |
ACQUITY UPLC BEH™ C18 Column, 1.7 µm, 2.1 mm × 150 mm (p/n: 186002353) or AccQ Tag Ultra C18 Column, 1.7 µm, 2.1 mm × 150 mm (p/n: 186009954) (Note: AccQ Tag Ultra C18 Columns are ACQUITY UPLC BEH C18 Columns QC checked specifically for AA analysis). |
|
Column inline filter: |
ACQUITY Column In-Line filter 0.2 µm (p/n: 205000343) |
|
Sampling rate: |
10 Hz |
|
Column temperature: |
50 °C |
|
Sample temperature: |
20 °C |
|
Sample loop size: |
1 µL |
|
Injection volume: |
1 µL |
|
Injection mode: |
Partial loop with needle overfill (PLNO) with 6x overfill volume |
|
Mobile phase A: |
Mixture of AccQ Tag Ultra Eluent A Concentrate (p/n: 186003838) and water at 1:19 (v/v). (Note: Use a 50 mL Class A volumetric flask to transfer 50 mL AccQ Tag Ultra Eluent A Concentrate and mix with 950 mL water). |
|
Mobile phase B: |
AccQ Tag Eluent B (p/n: 186003839) |
|
Weak needle wash solution: |
95:5 (v/v) Water:acetonitrile |
|
Strong needle wash solution: |
5:95 (v/v) Water:acetonitrile |
|
Seal-wash solvent: |
50:50 (v/v) Water:acetonitrile |
|
Flow rate: |
0.4 mL/min |
|
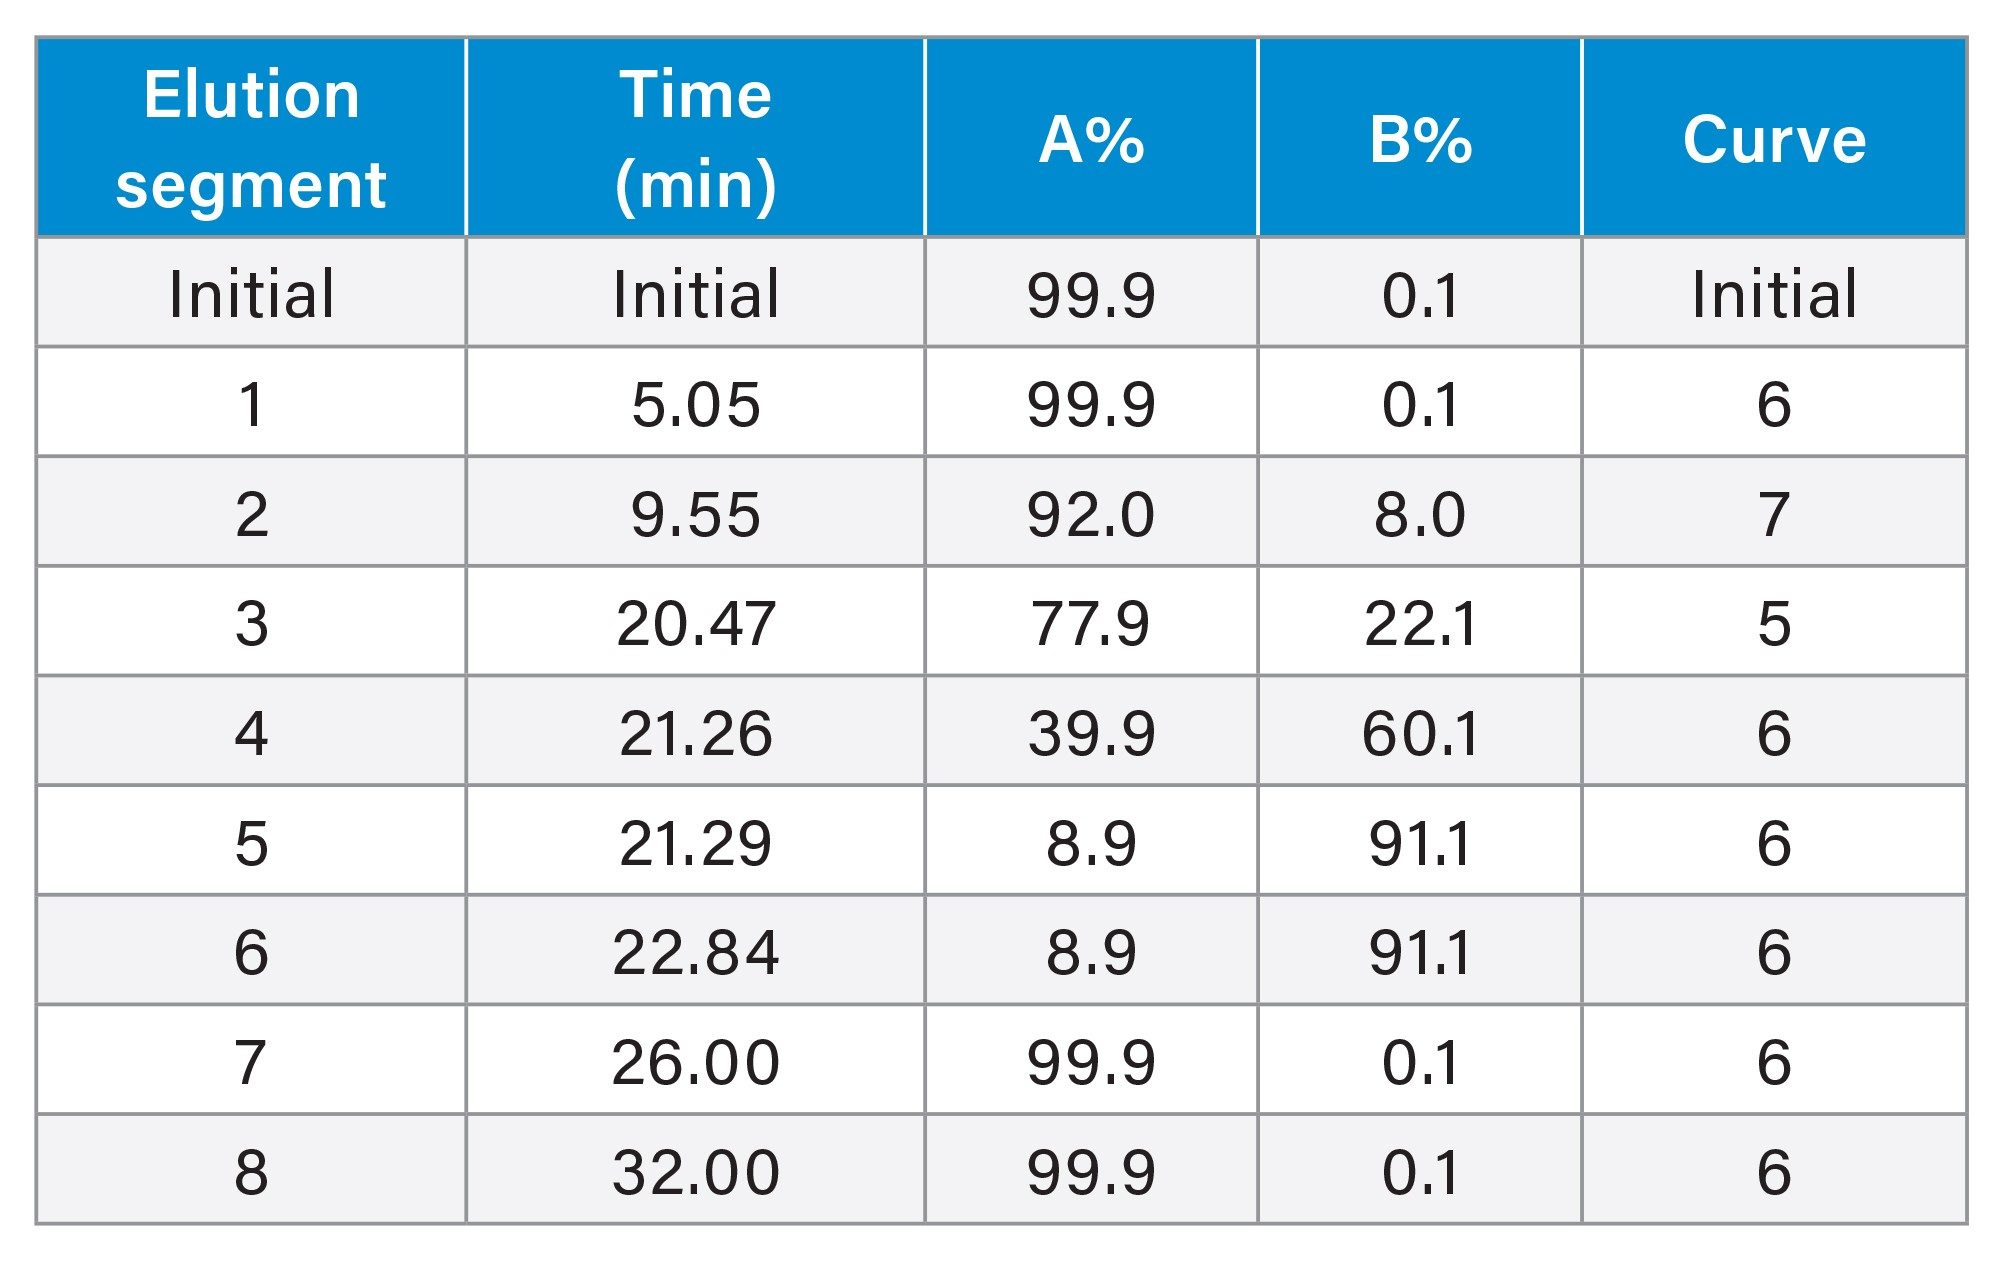
Gradient elution: |
(see Gradient Table below) |
Gradient Table
Mass Spectrometry Conditions
|
MS system: |
ACQUITY QDa™ Mass Detector (Performance) |
|
Capillary voltage: |
0.8 kV |
|
Ion polarity: |
Positive |
|
Probe temperature: |
600 °C |
|
Sampling rate: |
10 points/sec |
|
Gain: |
1 |
|
MS scan: |
100 Da to 600 Da (continuum format) |
|
Cone voltage: |
10 V |
Calibration
The calibration curve of AA was established by plotting the responses against AA concentrations (expressed in µM) of the calibration standards for each AA. The responses were calculated by multiplying the peak area ratio (AA analyte versus IS) with the IS concentration (typically 7.7 µM). The calibration curve (first-order polynomial) was obtained by a linear regression (forced through the origin) of the calibration data points in the plot.
Limit of Quantitation
The limit of quantitation (LOQ) was estimated based on the standard deviation of the response and the slope of the calibration curve. The LOQ was calculated as 10 times the standard deviation of the AA response at 0.39 µM (n=4, different columns), divided by the slope of the calibration curve for each individual AA.
Calculation of AA Profile
The individual AA concentrations measured from the analysis (expressed in micro molar, µM) were converted to mass concentrations (microgram per liter) by multiplying them by their molecular weights. These individual mass concentrations were then summed up as the total AA mass concentration, and the relative concentration of individual AA was calculated as a mass percentage of the total AA concentration. Since Trp was not determined by this method, its content was not included in the total AA content in the calculation.
Method Development Using Design of Experiments
The gradient elution parameters were optimized using a Design of Experiment (DoE) software, Fusion QbD® Software (S-Matrix Corp., Eureka, CA). The key variables in the gradient elution program, i.e., the initial isocratic holding time (segment 1 in the Gradient Table) and the first gradient time (segment 2 in the Gradient Table) were investigated to find the best conditions for the separation of AA. The goals of the experiments were to maximize the resolution of three critical pairs: the Ser/Arg for the early-eluting region, the Asp/MetSO2 (methionine sulfone) for the middle region, and the XCys/Met for the late-eluting region in the chromatogram. Experiments (or sample queues) based on the Central Composite Face design were created by the Fusion QbD Software and exported to Empower CDS for analysis. Following the completion of the sample queues, the chromatographic data was processed in Empower CDS and the results were retrieved by the Fusion QbD Software for modeling and analysis. Based on the acceptable performance region (resolution ≥2.0), three different sets of chromatographic conditions within the acceptable performance region were further evaluated using a broader set of performance evaluation criteria, which included the retention time (RT) and the resolution of all relevant AA. After the best chromatographic conditions were determined, the robustness of the separation was also evaluated using the Fusion QbD Software. The top three chromatographic conditions (or factors) subject to variation between instrument units, operators and labs, such as column temperature, flow rate, and mobile phase A composition, were examined at two levels that bracketed the target level using the Full Factorial Design. The impacts of these changes (deviation from the targeted level) on AA separation were assessed to evaluate the method’s robustness.
Results and Discussion
Method Development
The AOAC Method 2018.06 could not be directly applied to pet foods because HyPro coeluted with the ammonium (NH3) under the method specified gradient elution program (Figure 1A). The Waters amino acid analysis solution provides a method for analyzing protein hydrolysates, foods, and feeds, in which HyPro can be retained and separated from the NH3 peak.6 However, XCys was found to partially co-elute with the Met peak when the Waters method (adapted to the column dimension and flow rate) was tested in the analysis (Figure 1B). Method development was therefore carried out to improve the separation resolution of Xcys/Met and HyPro/NH3. Gradient curve 5 for the elution segment 3 (see Gradient Table in Experimental) was found useful in improving the resolution of XCys and Met. Subsequently, the DoE approach was used to fine-tune the gradient elution parameters for the best available separation of all AA (See the details of DoE in the Experimental). Figure 1C shows the chromatogram of AA in a pet food under the final optimized gradient elution conditions. Baseline separation of the XCys and Met was achieved. Figure 1D shows the chromatogram of AA standards obtained using the final optimized gradient elution conditions.
Method Specificity
Figure 1D shows that baseline separation (Resolution ≥2.0) of all AA was achieved except for Gln, which coeluted with Arg. The coelution of Gln and Arg was not considered a real concern since Gln is converted to Glu during acid hydrolysis. GABA and AABA are nonproteinogenic amino acids. They do not contribute to the protein content in foods. They were included in the study for the method specificity evaluation. AABA coeluted with the derivatized peak but did not interfere with any AA. GABA was baseline separated from Ala, the closest AA to GABA. Besides these AA, cysteic acid, and MetSO2 were also tested (data not shown) and they were all baseline separated from other AA.
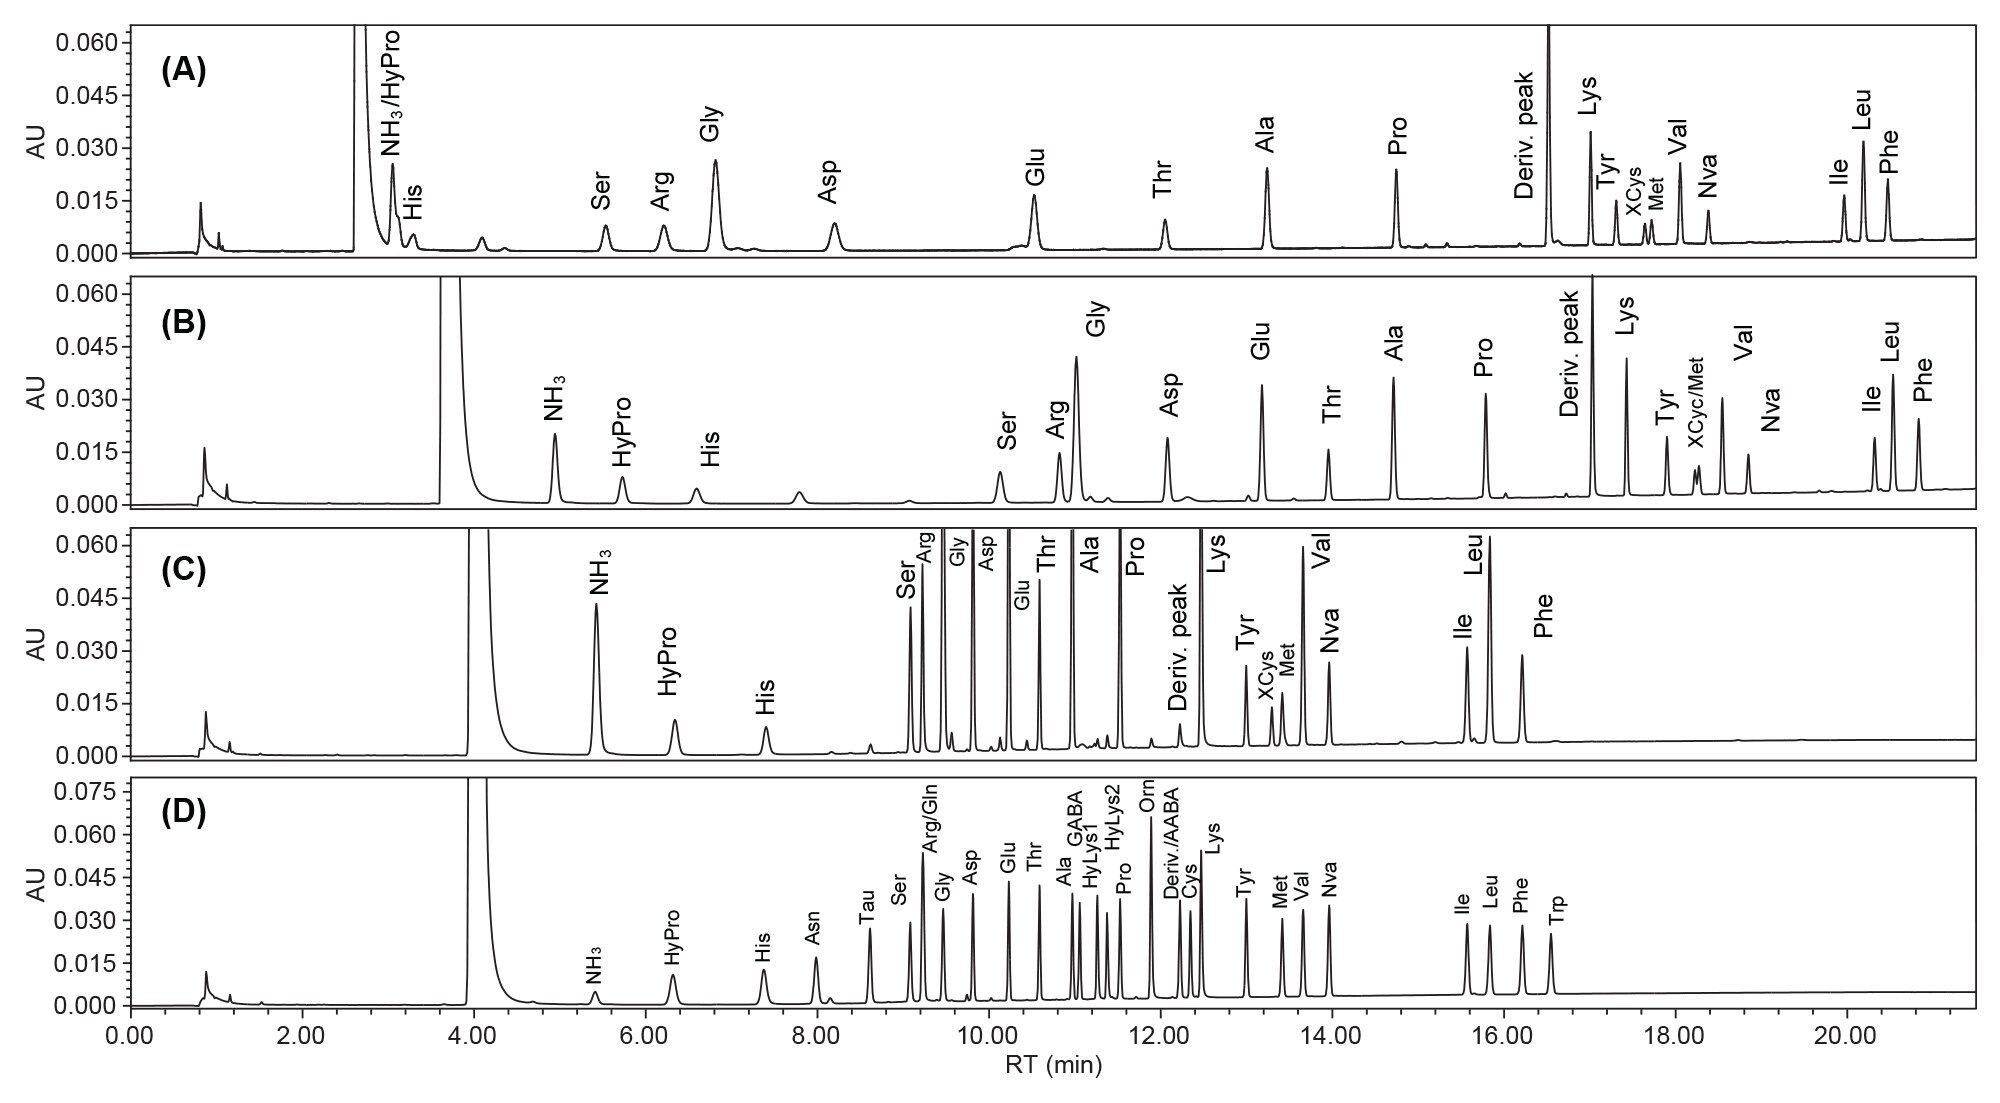 Figure 1. Chromatograms of AA in a pet food or in a standard solution under various gradient conditions: (A) AA in a pet food under the chromatographic conditions specified in the AOAC Method 2018.06; (B) AA in a pet food under the conditions in the Waters Food and Feed Solution; (C) AA in a pet food under the optimized gradient elution condition developed in this study; (D) AA standards under the optimized gradient elution conditions in this study.
Peak Identity
The peak identities were assigned based on the elution order and the confirmatory mass spectra obtained from the ACQUITY QDa Mass Detector. The AA elution order provided in the Waters UPLC Amino Acid Analysis Solution for foods and feeds was used as a reference as the chromatographic conditions were not significantly different from the newly optimized method.6 The exact peak identity was verified by the mass spectra obtained under the final optimal chromatographic conditions. Table 2 shows the monoisotopic masses, the observed m/z ratios, and the positively charged ions of the AA. Some AA, such as HyLys, Orn, Cys, and Lys, were found to react with two molecules of the derivatization reagent (AQC). These derivatized AA formed doubly charged ions as the most abundant ions in the MS, with singly charged ions being less abundant ions. Two ions (m/z 396.2 and 388.3) with about the same peak intensity were observed for Xcys. The structure of the 388.3 m/z ion remained unknown.
 Table 2. Amino acids and their monoisotopic mass, m/z ratio, and the ion forms.
Method Robustness
The robustness of the separation of AA under the final conditions was evaluated using the DoE approach. The three variables subject to variation between instrument units, operators and labs, such as column temperature, flow rate, and mobile phase A composition, were examined at two levels that bracketed the target level using the Full Factorial Design. Figure 2 shows the safe operation region in which the resolutions for critical pairs were above 2.0. The safe operation regions were in the ranges of column temperature 49.3–51.0 °C, flow rate 0.390–0.410 ml/min, and starting mobile phase A 99.7%–100%, (Figure 2). These results demonstrated the high reliability of the separation despite relatively minor variations in chromatographic conditions.
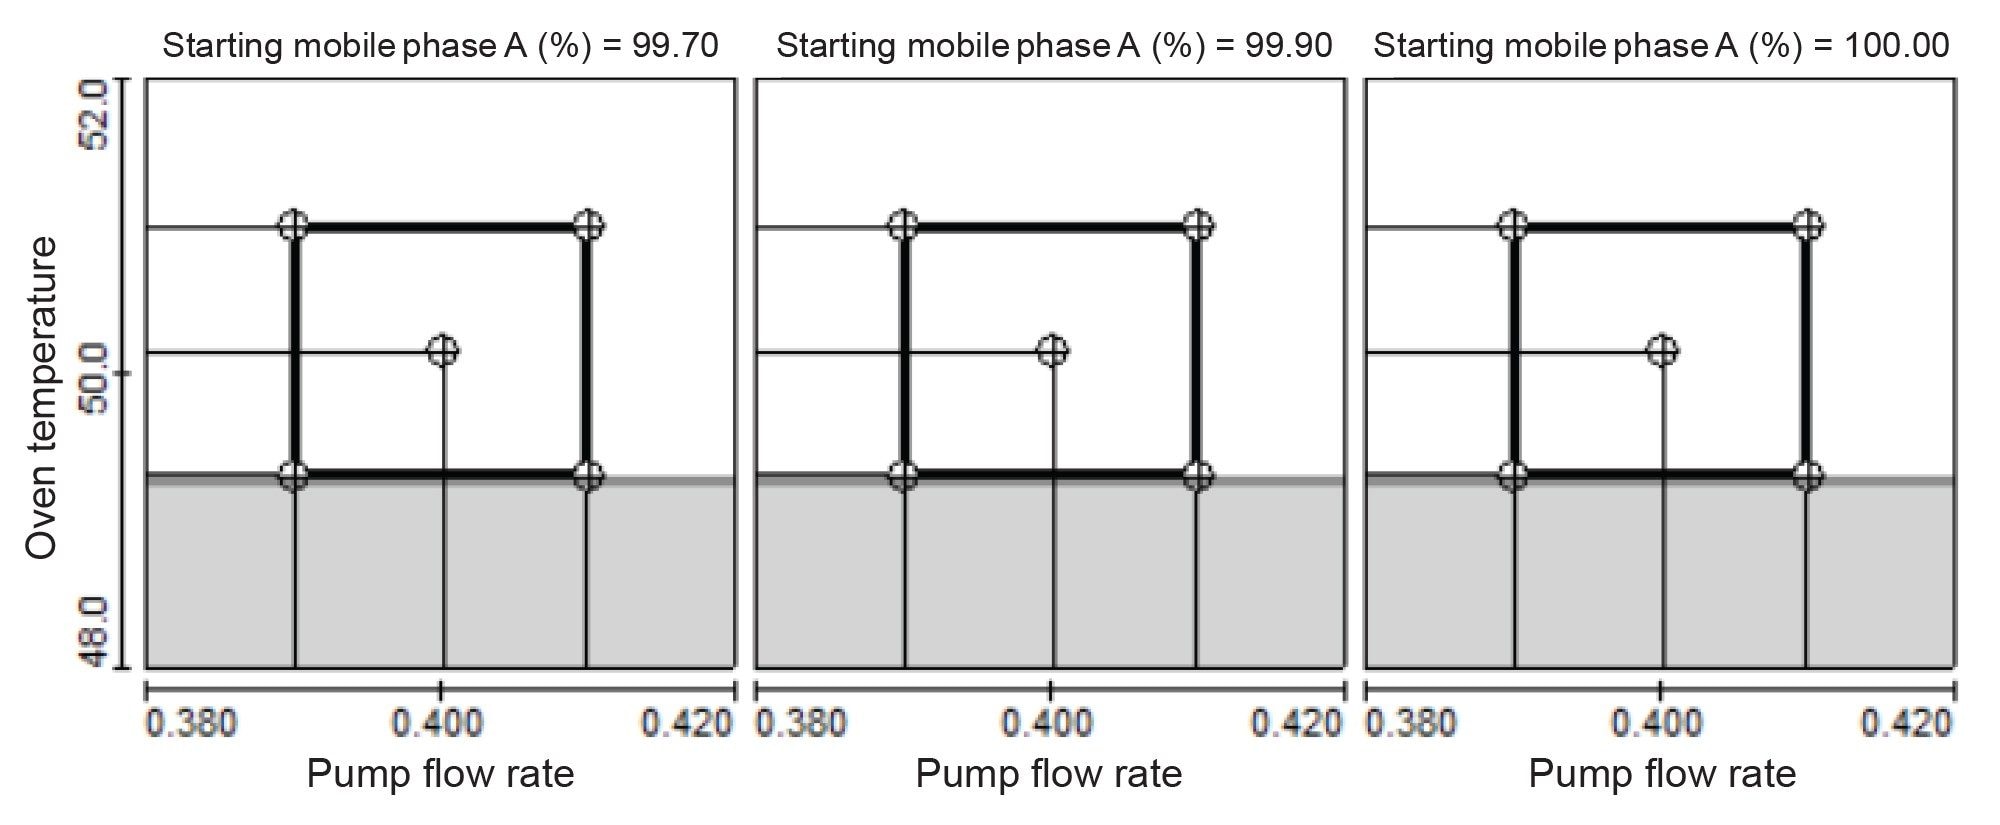 Figure 2. 2D contour plots of resolution against flow rate and column temperature at various starting mobile phase A percentage. Boxes show the safe operation regions in which the resolution for the critical pairs were above 2.0. The shaded area represents resolution of 2.0 or less and the unshaded area represents resolution of larger than 2.0.
Analytical Performance
Table 3 shows the repeatability (Relative standard deviation, or RSDr) and the intermediate reproducibility (RSDiR) in the RT and the resolution of the separation. The repeatability results were obtained from the multiple injections of standard solutions (n=10) on a single column within a day, while the intermediate reproducibility results were obtained from the multiple injections of a standard solution on different columns across several days. Columns from different product batches of both the ACQUITY UPLC BEH C18 Column and the AccQ Tag Ultra C18 Column were used. The early eluting AA, such as HyPro, His, Asn, Tau, Ser, Arg, and Asp, were found to have a larger variation in RT than those of the late eluting AA. The RT RSDrs for the early-eluting AA ranged from 0.13% to 0.78%, and for the late-eluting AA the RT RSDrs were below 0.1%. The RT RSDiRs (intermediate reproducibility) for the early-eluting AA ranged from 0.8% to 7.7%, and for the late-eluting AA they were below 0.8%. The resolutions of AA obtained on a single column and on different columns were above 2.24 (Ala/GABA) and 2.19 (Ala/GABA), respectively. These results demonstrated the high resolution and the high reliability of this method in separating AA. The LOQ and the coefficient of determination (R2) are also included in Table 3. The LOQ ranged from 0.02 to 0.10 µM, and the R2 values of all AA were at least 0.9975. These LOQ and linearity were comparable to those of the AOAC Method 2018.06 that we observed in our previous study.1
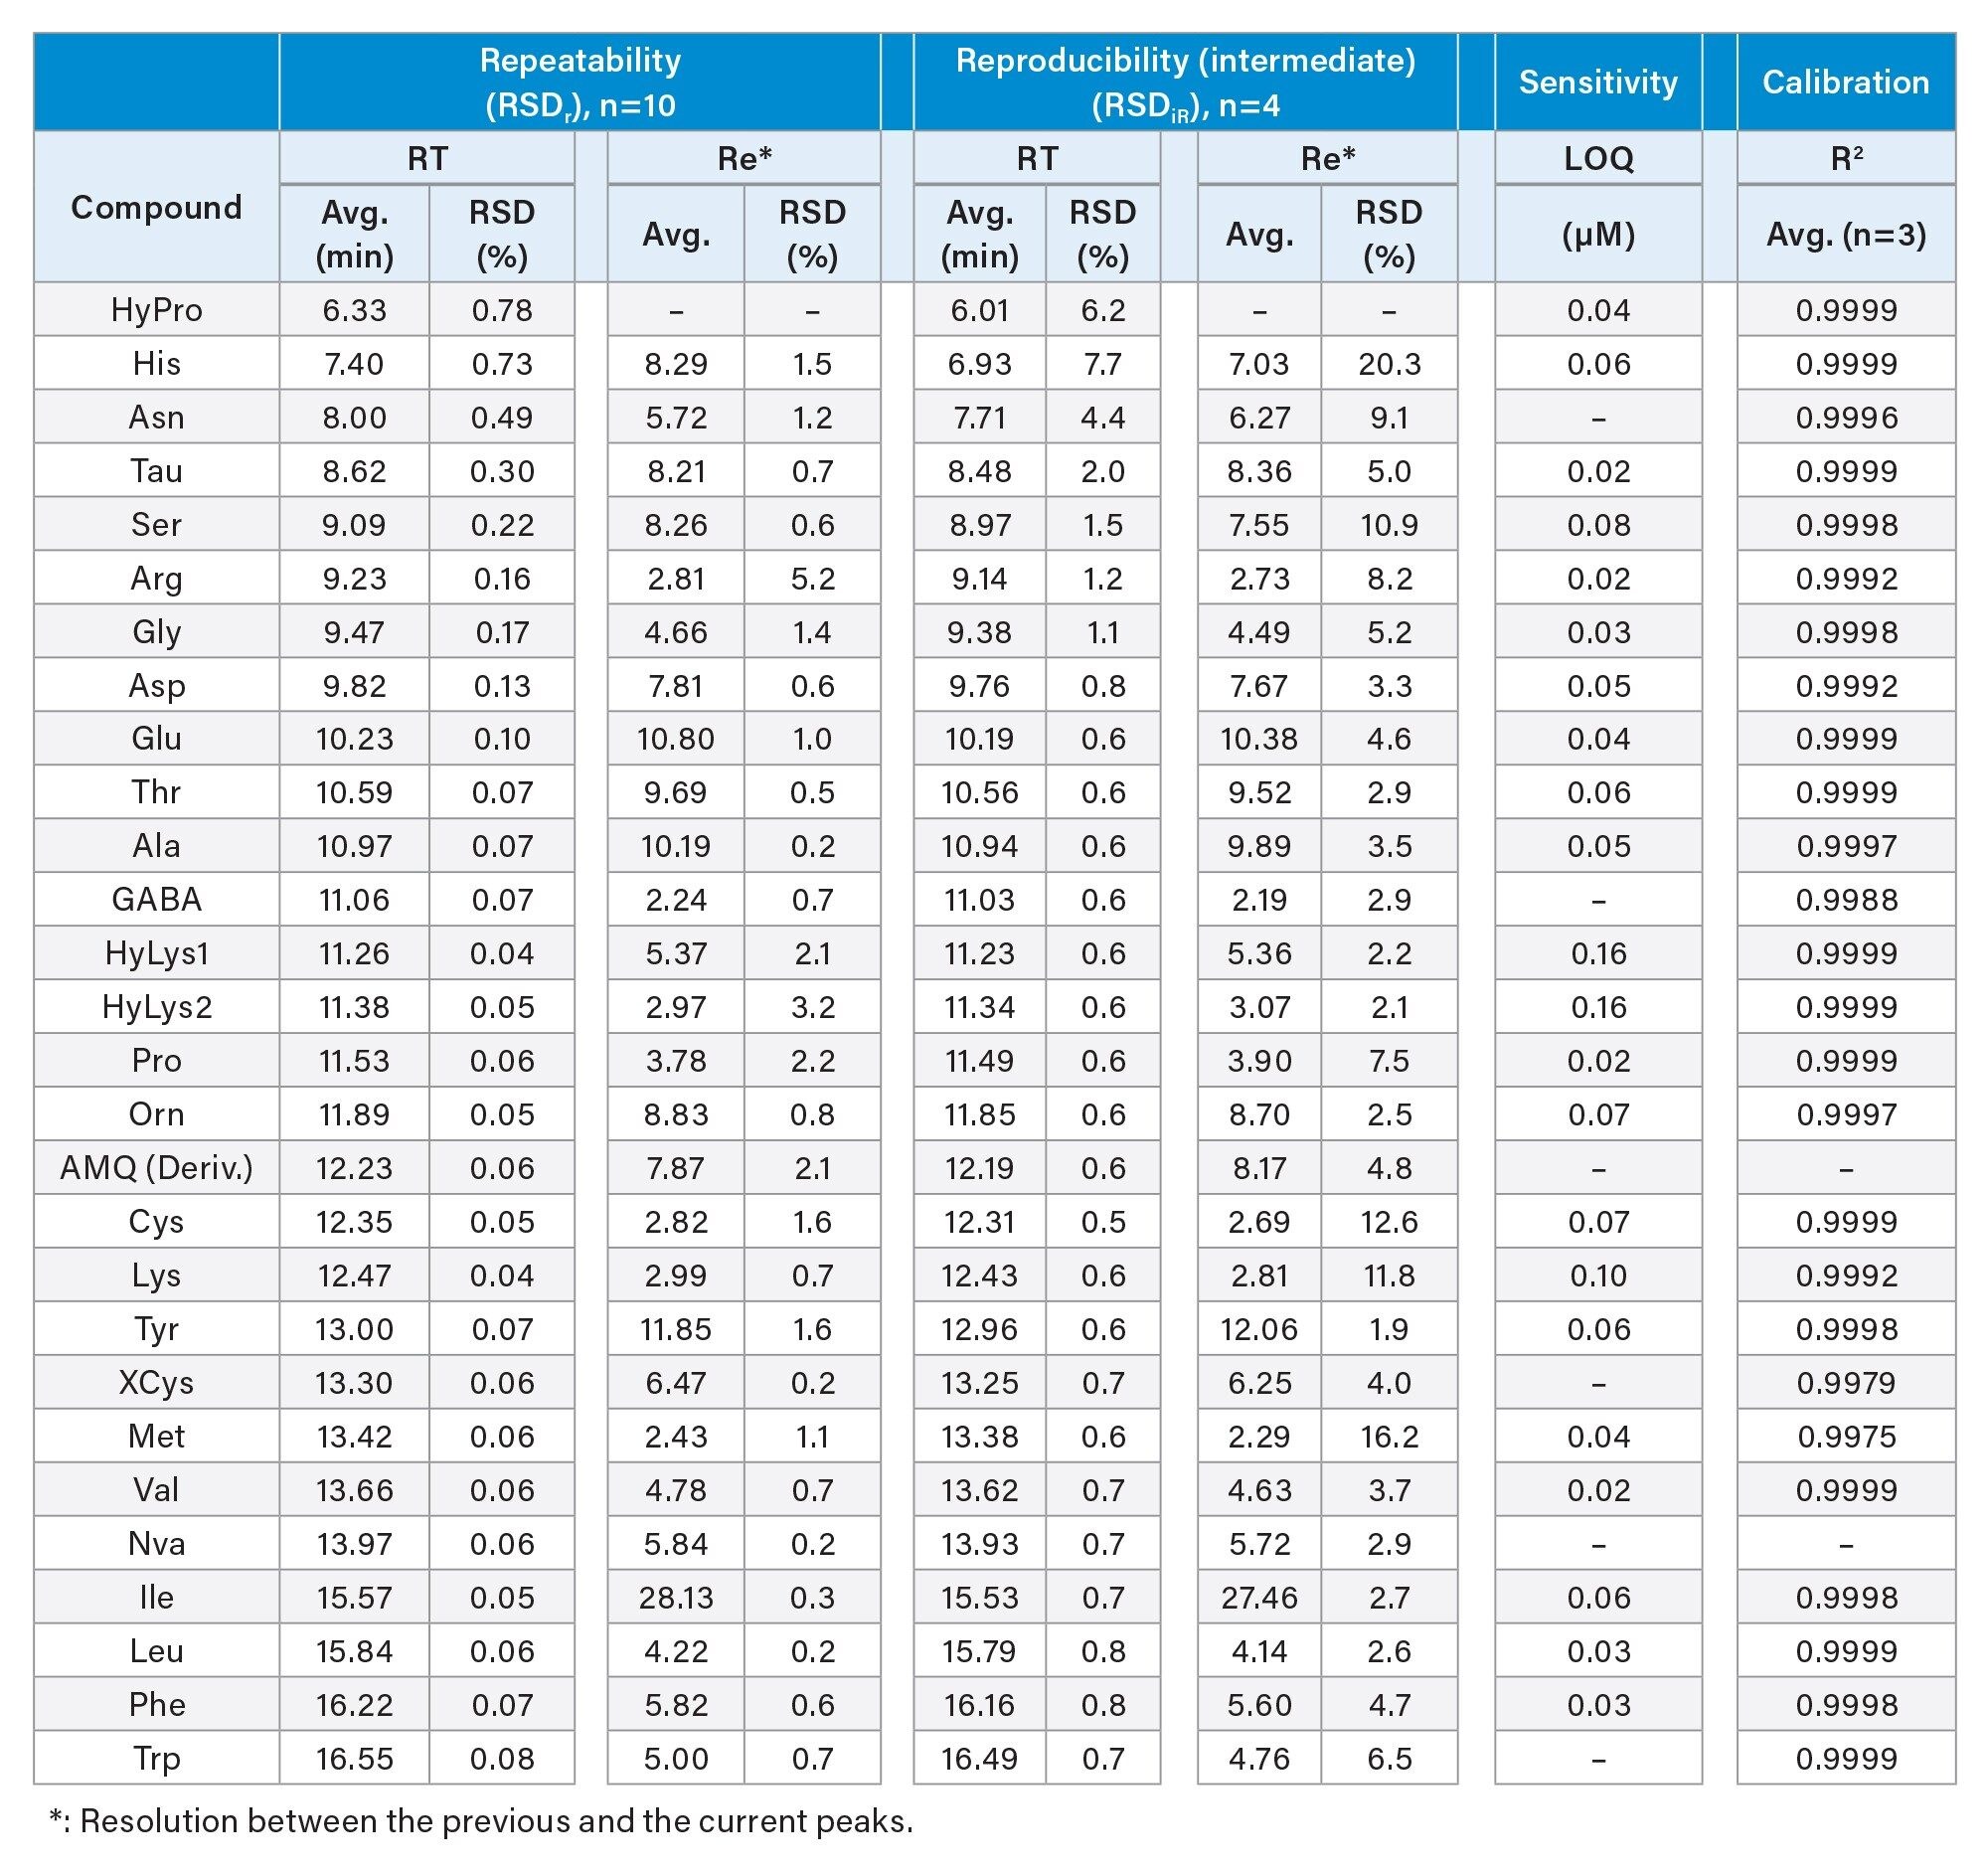 Table 3. Analytical performance of the developed method in terms of repeatability and intermediate reproducibility for RT and resolution, and in sensitivity and linearity.
Analysis of Pet Foods and Plant Proteins
Six pet foods and four plant proteins were analyzed using the gradient elution conditions that were developed in this study. All the AA in these samples were successfully separated with baseline resolution (Resolution ≥2 [Figure 3]). The peaks were assigned based on the RT of standards that were injected bracketing the samples. A few small unknown peaks, with a relative peak area of approximately 1±0.5% of the total peak area, were found in the dry cat treat and the dry cat food (Figure 3). The identity of these unknown peaks needed to be further investigated. Other minor peaks with less than 0.5% of the total peak area were not analyzed. The AA profiles of these samples are shown in Table 4. Table 4 shows that HyPro, Tau, and Hylys were only found in pet foods, but Tau and Hylys were not found in the chicken feed, and HyLys was found in the pumpkin seed protein. Since HyPro and HyLys are common amino acids in collagen, the most abundant protein in animals, their presence in pet foods was expected. However, the detection of HyLys in the pumpkin seed protein was unexpected, as it is not a naturally occurring amino acids in pumpkin seed proteins. The origin of HyLys in this pumpkin seed protein remains unknown, with contamination being a possible source.
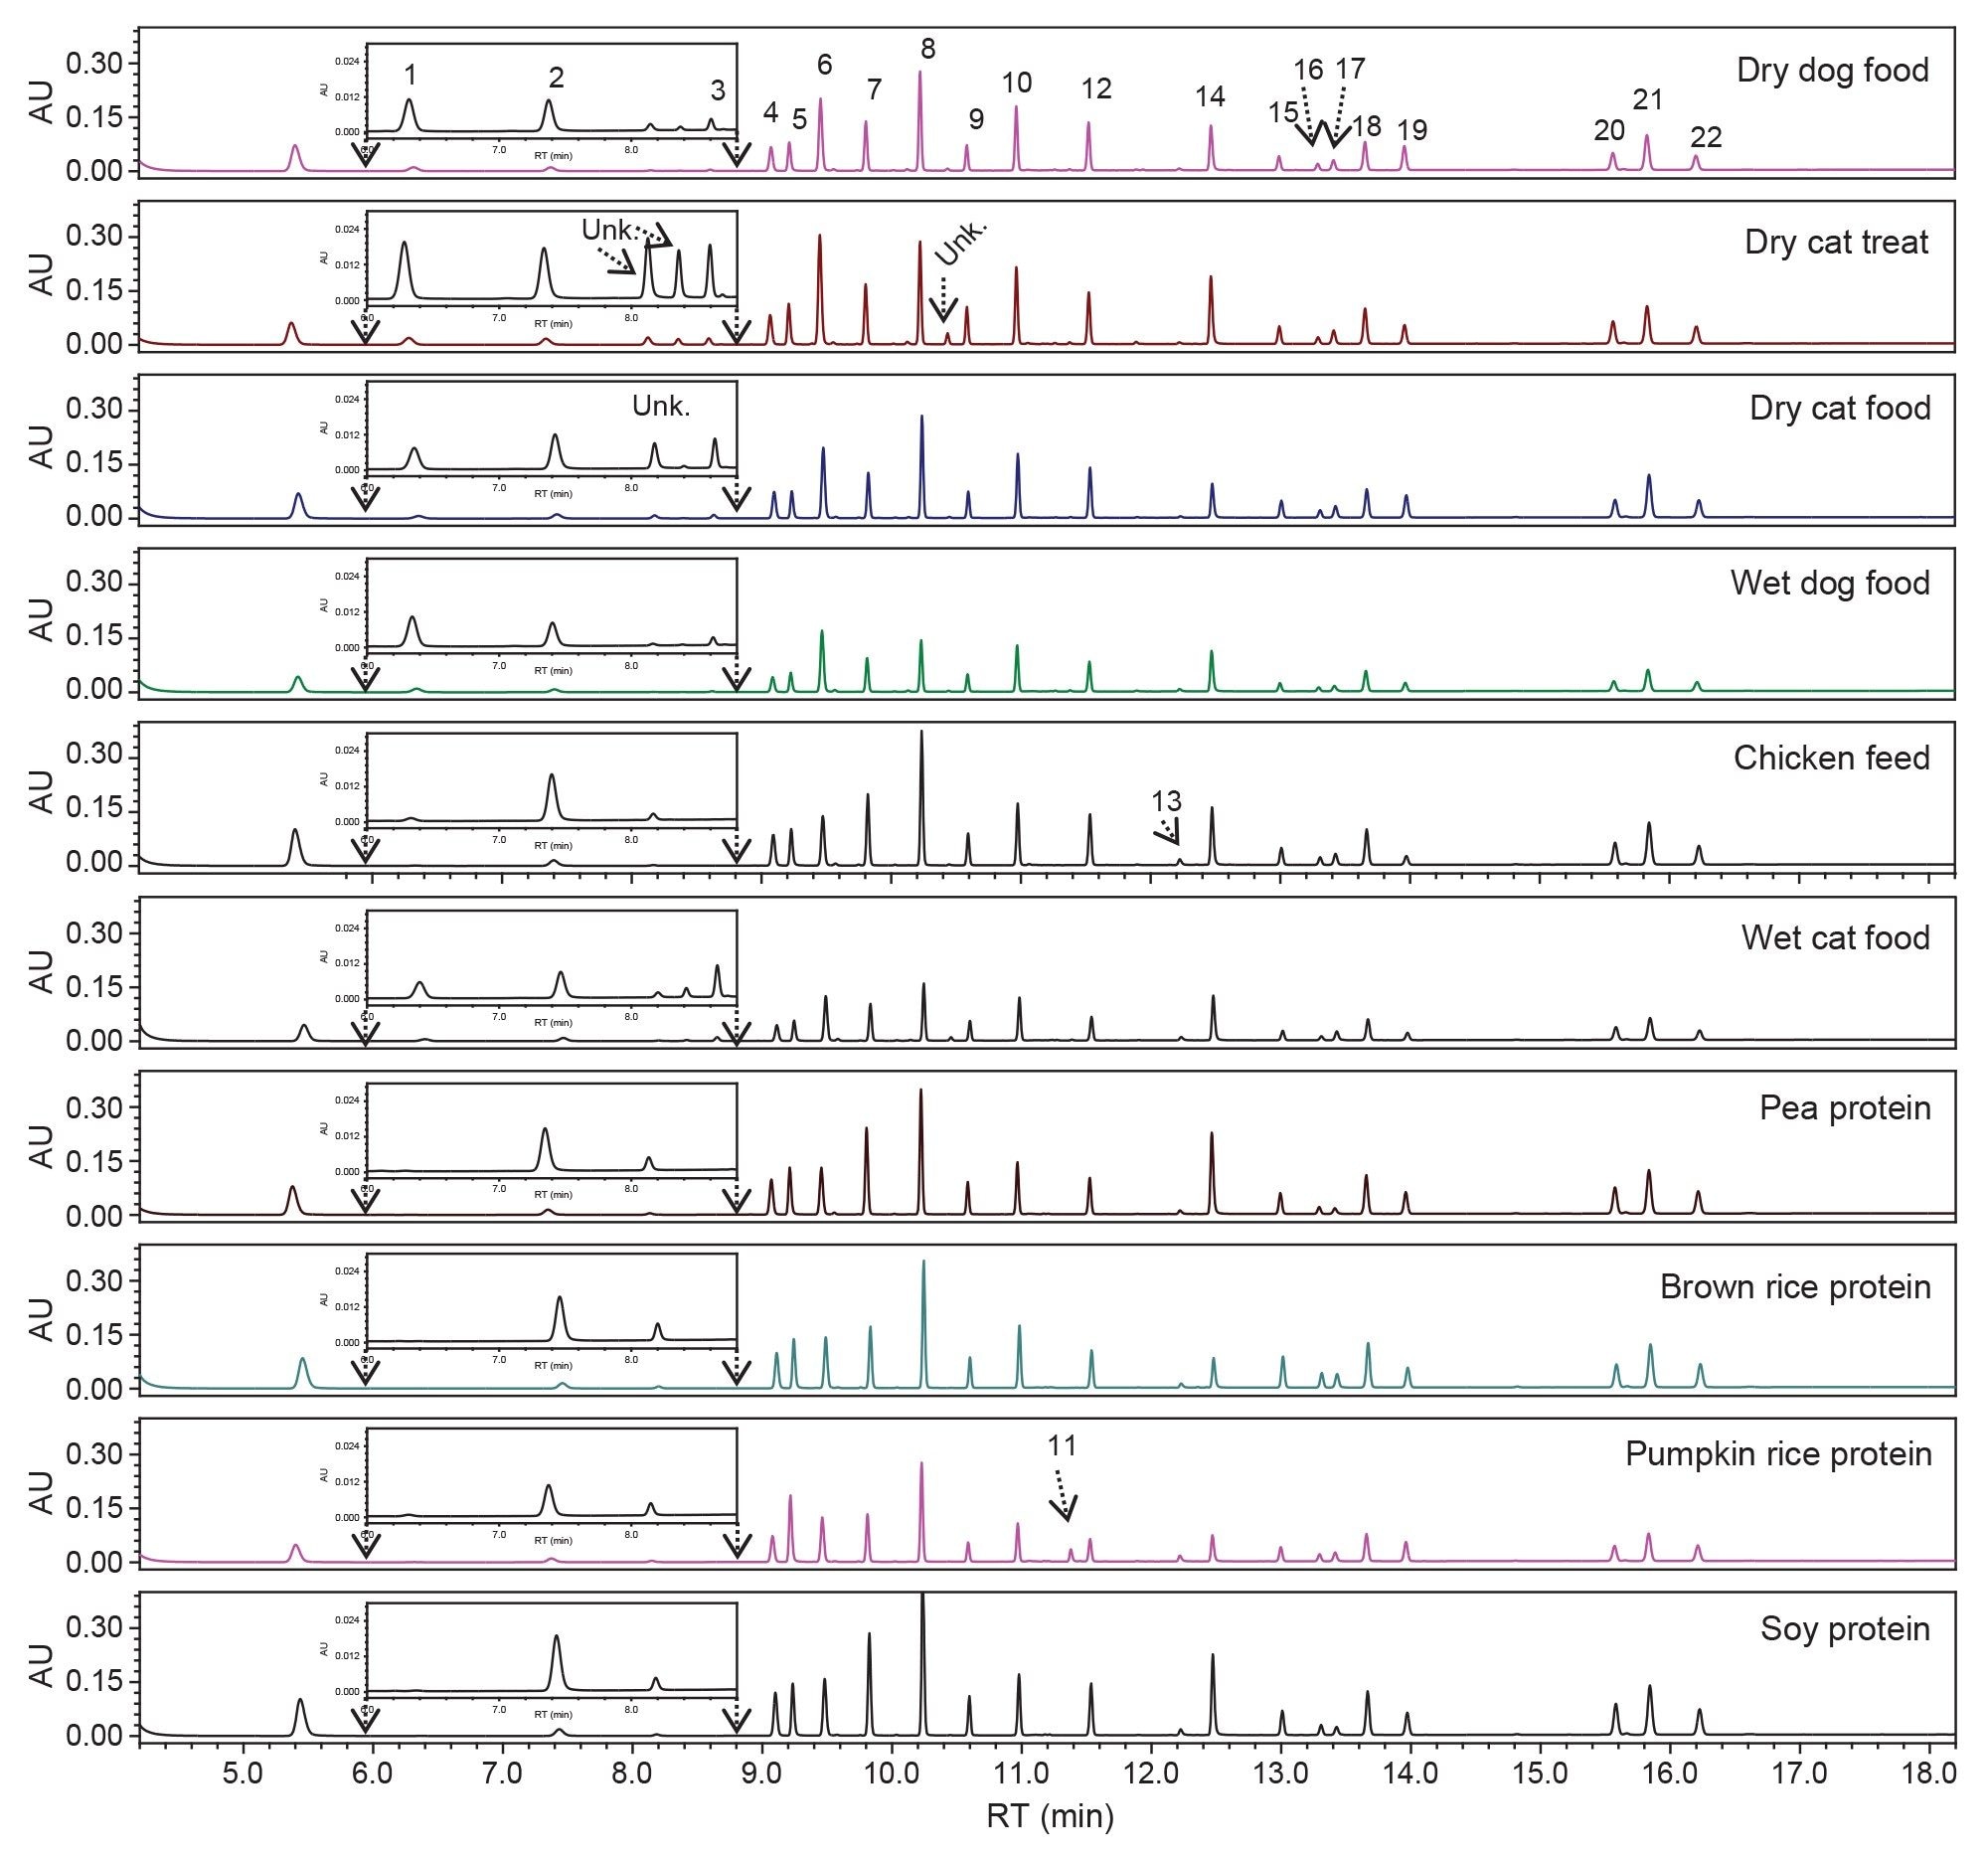 Figure 3. Chromatograms of amino acids in pet foods and plant proteins. The inserts are the enlarged portion of the chromatogram from 6.0 to 8.8 min. The peaks are 1. HyPro; 2. His; 3. Tau; 4. Ser; 5. Arg; 6. Gly; 7. Asp; 8. Glu; 9. Thr; 10. Ala; 11. HyLys. 12. Pro; 13. Derivatized peak; 14. Lys; 15. Tyr; 16. XCys; 17. Met; 18. Val; 19. Nva; 20. Ile; 21. Leu; 22. Phe.
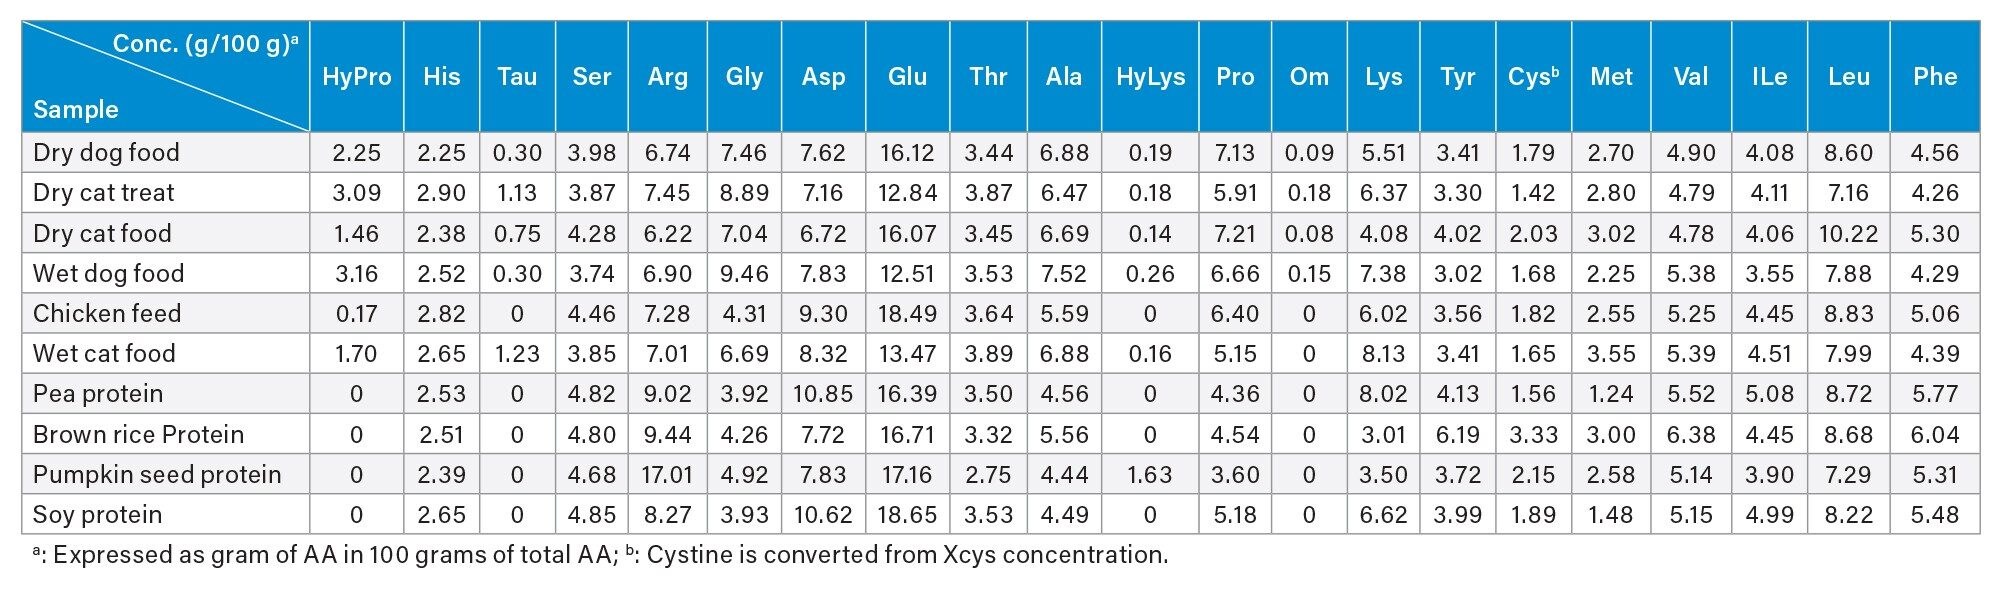 Table 4. Amino acid profiles of pet foods and plant proteins analyzed in this study.
Conclusion
The gradient elution program in the AOAC Method 2018.06 has been modified and optimized for the analysis of amino acids in pet foods and plant proteins. Excellent separation resolution for all AA has been achieved with good repeatability and intermediate reproducibility in RT. The method sensitivity (LOQ) and linearity were comparable to those obtained in the AOAC Method 2018.06. This modified method has been successfully applied to six pet foods and four common plant proteins. This modified AOAC Method offers a reliable and practical solution for the analysis of amino acids in pet foods and plant proteins.
References
- Yang, J., Liu, B., Rainville, P.D., and Harden, S. UPLC-UV Analysis of Amino Acids in Dairy Products – Implementing an International Standard on the ACQUITY Premier System. Application Note 720008632, Waters Corporation, Milford, MA, 2024.
- Dong, Y.-L., Yan, N., Li, X., Zhou, X.-M., Zhou, L., Zhang, H.-J., & Chen, X.-G. Rapid and Sensitive Determination of Hydroxyproline in Dairy Products Using Micellar Electrokinetic Chromatography With Laser-Induced Fluorescence Detection. Journal of Chromatography A 2012, 1233, 156–160. doi:10.1016/j.chroma.2012.02.030.
- Yuswan, M.H., Jalil, N.H.A., Mohamad, H., Keso, S., Mohamad, N.A., Yusoff, T.S.T.Md., Ismail, N.F., Manaf, Y.N.A., Hashim, A.M., Desa, M.N.M., Yusof, Y.A., & Mustafa, S. (2020) Food Chemistry 2020, 337,127762. doi:10.1016/j.foodchem.2020.127762.
- Cohen, S.A. and Michaud, D.P. (1993) Synthesis of a Fluorescent Derivatizing Reagent, 6-Aminoquinolyl-N-Hydroxysuccinimidyl Carbamate, and its Application for the Analysis of Hydrolysate Amino Acids Via High-Performance Liquid Chromatography. Analytical Biochemistry, 211, 279–287.
- AccQ Tag Ultra Derivatization Kit Care and Use Manual. Waters Corporation. 715001331 Rev. A, 2024.
- UPLC Amino Acid Analysis Solution System Guide. Waters Corporation. 71500129702 Revision B, 2007.
720008700, February 2025