Greener, Lower Cost Organic Mobile Phase Solvents for the LC-MS Analysis of Intact Biotherapeutic Proteins
Abstract
This application note presents on the recent trend replacing acetonitrile (Class II Toxicity) with greener Class III, lower cost liquid chromatography-mass spectrometry (LC-MS) grade alcohols (e.g., methanol and isopropyl alcohol) for reversed phase separations of proteins with mass detection. In this study, we report the investigation to substitute acetonitrile with isopropyl alcohol (IPA) in reversed phase (RP) LC-MS analysis of biopharmaceutics. The benefits and potential issues are discussed in detail in this report, but overall, the experimental data indicated that IPA can be a viable alternative for acetonitrile in this application space.
Benefits
- Isopropanol (IPA) is a less toxic organic solvent than acetonitrile
- Isopropanol (IPA) is lower cost compared to acetonitrile
- Isopropanol (IPA) performed well for intact mass and subunit LC-MS analysis in terms of peak shape, carryover, and resulting MS sensitivity
Introduction
This application note presents the most recent development in replacing acetonitrile with greener and cheaper solvents for protein RP LC-MS analysis. Acetonitrile is the widely used for reverse phase liquid chromatography (RPLC) separation of proteins due to its low ultraviolet (UV) cutoff and low viscosity, but presents additional challenges with toxicity, disposal, and occasional scarcity.
In the area of greener organic mobile phases for LC, much attention has been given to replacing acetonitrile (ACN) with ethanol or acetone.1,2,3 As stated in the Federal Drug Administration (FDA) document4–“Q3C–Tables and List Guidance for Industry”, ACN is classified as a class 2 solvent for toxicity, while both ethanol and acetone are considered as class 3, less toxic solvents. For RP LC-MS application, Amgen tried to use IPA in combining with 0.1% trifluoroacetic acid (TFA) in the mobile phases for proteins analysis.5 In this study, we report the investigation on substituting ACN with alcohols (MeOH, or IPA, which is also classified as a class 3 solvent), for RP LC-MS analysis of biopharmaceutics. We compared the chromatographic and mass spectrometry performance for an intact monoclonal antibody (NISTmAb Reference Material) and its IdeS digested and reduced subunits using ACN, MeOH, or IPA as the organic mobile phase solvent (with commonly used 0.1% formic acid). Overall, our experimental data shown that IPA is well suited to replace acetonitrile for routine LC-MS analysis of mAbs.
 Figure 1. The system used for this study is the BioAccord™ System, comprised of an ACQUITY™ UPLC™ I-Class PLUS configured with a Tunable UV Detector (TUV) coupled in-line with the ACQUITY RDa™ accurate mass detector, operated by waters_connect™ informatics platform.
Experimental
Materials and Sample Preparation
LC-MS grade water, acetonitrile (ACN), methanol (MeOH) and isopropanol (IPA) were purchased from Honeywell-Burdick & Jackson (Muskegon, MI). LC-MS grade formic acid was purchased from Thermo Fisher Scientific (Waltham, MA). Waters humanized mAb (NISTmAb) Mass Check Standard (Waters p/n=186009125), and Waters mAb (NISTmAb) Subunit Standard (Waters p/n=186008927) were used for this study. For intact mass analysis, 400 µL of water was added to the sample vial (containing 80 µg of intact mAb material) to produce a solution of 0.2 µg/µL before injection (4 µL). For subunit analysis, 250 µL of water was added to the sample vial (containing 25 µg of subunit mAb material) to produce a solution of 0.1 µg/µL before injection (4 µL).
BioAccord System
|
System: |
ACQUITY UPLC I-Class PLUS |
|
Detector: |
ACQUITY RDa Mass Detector, TUV Optical Detector |
|
Software: |
waters_connect v1.9.9.6 |
Intact Mass Analysis – LC-MS Method Set-up
|
Column: |
BioResolve™ RP mAb Polyphenyl Column, 450 Å, 2.7 µm, 2.1 mm x 50 mm (p/n=186008944) |
|
Column temperature: |
80 °C |
|
Mobile phase A: |
Water with 0.1% formic acid |
|
Mobile phase B: |
1. Acetonitrile with 0.1% formic acid, 2. 95% Methanol in water with 0.1% formic acid, or 3. 95% IPA in water with 0.1% formic acid |
|
TUV optical detection: |
UV 280 nm |
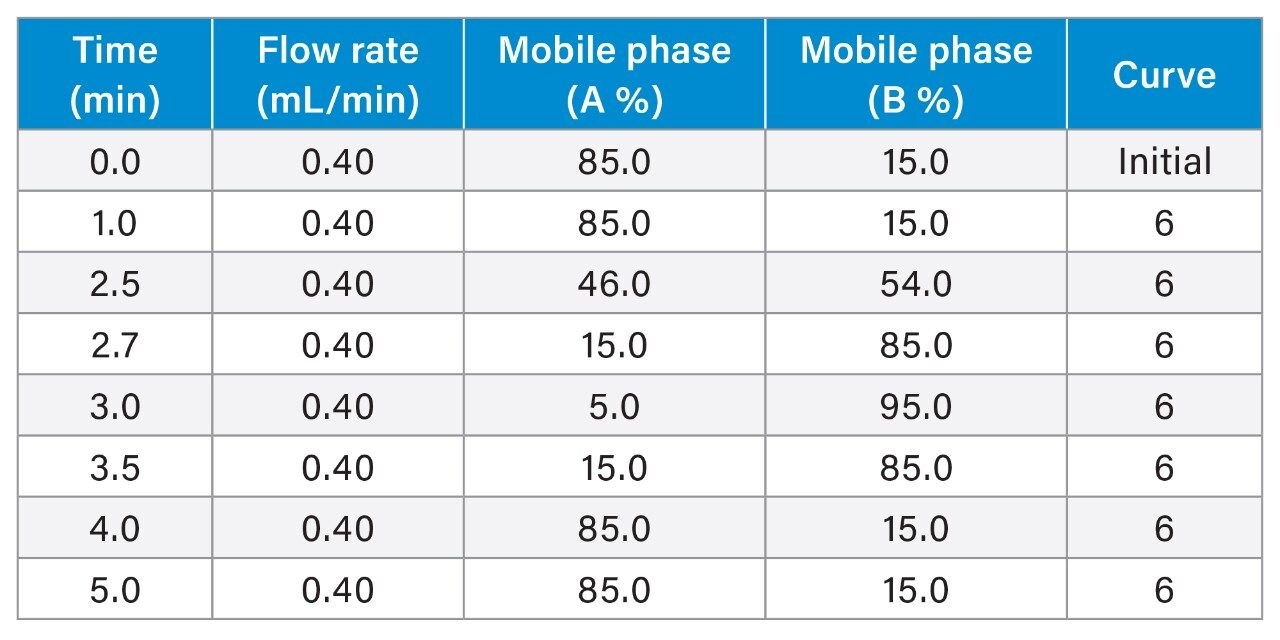
LC Gradient Table for Intact mAb Analysis
 Total run time: 7.0 minutes.
MS Conditions for Intact Mass Analysis
|
Acquisition settings |
|
|
Mode: |
Full scan |
|
Mass range: |
High (400–7000 m/z) |
|
Polarity: |
Positive |
|
Scan rate: |
2 Hz |
|
Cone voltage: |
Custom (70 V) |
|
Capillary voltage: |
Custom (1.50 kV) |
|
Desolvation temperature: |
Custom (550 °C) |
|
Intelligent data capture (IDC): |
Off |
Subunit Mass Analysis LC-MS Method Set-up
|
Column: |
BioResolve RP mAb Polyphenyl Column, 450 Å, 2.7 µm, 2.1 mm x 50 mm (Waters p/n=186008944) |
|
Column temperature: |
80 °C |
|
Mobile phase A: |
Water with 0.1% formic acid |
|
Mobile phase B: |
1. Acetonitrile with 0.1% formic acid, 2. 95% Methanol in water with 0.1% formic acid, or 3. 95% IPA in water with 0.1% formic acid |
|
TUV optical detection: |
UV 280 nm |
Gradient Table
 Total run time: 5.0 minutes
MS Conditions for Subunit Analysis
|
Acquisition Settings |
|
|
Mode: |
Full scan |
|
Mass range: |
High (400–7000 m/z) |
|
Polarity: |
Positive |
|
Scan rate: |
2 Hz |
|
Cone voltage: |
Custom (30 V) |
|
Capillary voltage: |
Custom (1.00 kV) |
|
Desolvation temperature: |
Custom (450 °C) |
|
Intelligent data capture (IDC): |
Off |
Results and Discussion
Acentonitrile (ACN) is mainly produced as a byproduct of acrylonitrile manufacturing and followed by purification. MeOH is produced by synthesis gas with carbon monoxide and hydrogen and followed by distillation. IPA is produced by combining water and propene in a hydration reaction and followed by azeotropic distillation.6,8,9,10 Because of the production difference, the manufacture of the alcohols typically produces higher purity solvents with fewer contaminants, in comparison to the production of ACN. The cost of the high purity alcohols intended for LC-MS analysis is thus significantly lower than that of ACN. Table 1 shown the commercial cost comparison amongst IPA, MeOH, and ACN from three of the many vendors for these solvents in the current US market. The average cost of ACN is close to three times of the average cost of MeOH and IPA, creating obvious cost advantage for the use of alcohols.
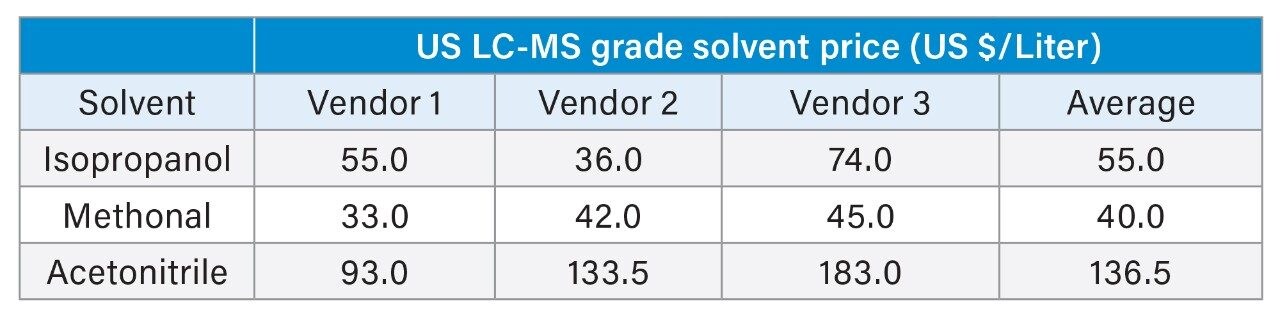 Table 1. LC-MS grade organic solvent mobile phases price comparison (US List prices in Q4 of 2021).
Intact Mass Analysis
For intact mass analysis evaluation, 0.8 µg of Waters Humanized mAb (NISTmAb) Mass Check Standard was loaded to a Waters BioResolve RP mAb Polyphenyl Column. The mobile phases used for the experiments are A with 0.1% FA in water, and B with 0.1% FA in IPA (in water), 95% MeOH, or 95% ACN. An optimized reversed phase intact mass analysis gradient was used with a total run time of seven minutes. The UV cutoff for ACN and water is both at 190 nm, while the UV cutoff for both MeOH and IPA is both at 205 nm.7 Since the TUV wavelength used for intact mass and subunit analysis is typically at 280 nm (sometime at 260 nm for smaller proteins), the higher TUV cutoff for MeOH and IPA should not have any impact in TUV detection.
Figure 2 is a comparison of the total ion chromatograms (TICs) and UV absorbance chromatograms using the three mobile phases B for the intact LC-MS analysis of NISTmAb. All three organic mobile phases produced symmetric and narrow peaks in UV and MS traces (with offset retention times as expected). However, the TIC peak widths at half peak heights were measured at 3.6, 4.8, and 3.6 seconds for IPA, MeOH, and ACN respectively, indicating the IPA and ACN (as mobile phase B) produced narrower TIC peaks than MeOH. It was also found that the intensity of the TIC from MeOH was about 80% of that from IPA or ACN. This comparison suggests that IPA would be favored to replace ACN for intact NISTmAb analysis.
 Figure 2. TICs and UV chromatograms from intact mass analysis of NISTmAb under different mobile phase conditions.
Figure 3 contains the combined raw spectra (from TICs in Figure 2) comparision from three different mobile phase solvents for intact mass analysis of NISTmAb (left) and the overlay of the three spectra for the 50+ charge state (right). All three mobile phases produced similar charge envelops for the NISTmAb raw spectra. However, the overlay of the zoomed 50+ charge state indicates that IPA (black trace) and ACN (blue trace) produced nominally better raw spectra than MeOH, with lower inter-glycoform valleys (17% vs 20% as shown in figure 3). For the NISTmAb, the top five glycoforms are identified as G0F/G0F, G0F/G1F, G1F/G1F, G1F/G2F, and G2F/G2F.6 Lower glycoform valleys usually indicate better desolvantion process in the source of the mass spectromety (better declustering). Therefore, IPA and ACN was observed to produce better quality spectra than MeOH for intact mass mAb analysis, although this effect is not pronounced.
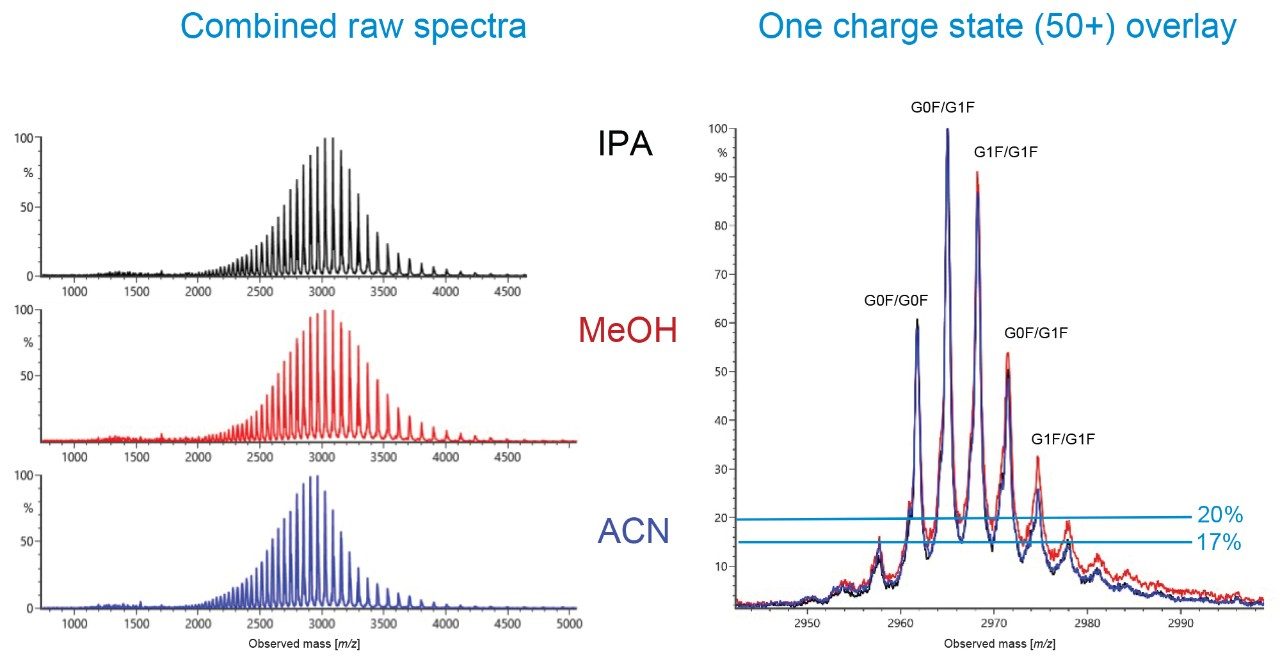 Figure 3. Combined raw spectra comparision for three different mobile phases (as solvent B) used for intact mass analysis of NISTmAb (left) and the comparable overlay of the three resulting deconvoluted spectra of 50+ charge state signals for the various glycoforms (right).
The deconvoluted spectra from all three mobile phases generated comparable spectral quality and mass accuracy (data not shown). The relative MS responses (after charge deconvolution) for the top five major glycoforms (G0F/G0F, G0F/G1F, G1F/G1F, G1F/G2F, and G2F/G2F) were similar as displayed in Figure 4. Figure 4 is a summary plot of relative MS response of repeated sample injections generated in waters_connect software. It shows that IPA and ACN mobile phase have similar relative MS response, while MeOH reports slightly different results. This observation was validated on other mAbs, such as Transtuzumab and infliximab (data not shown).
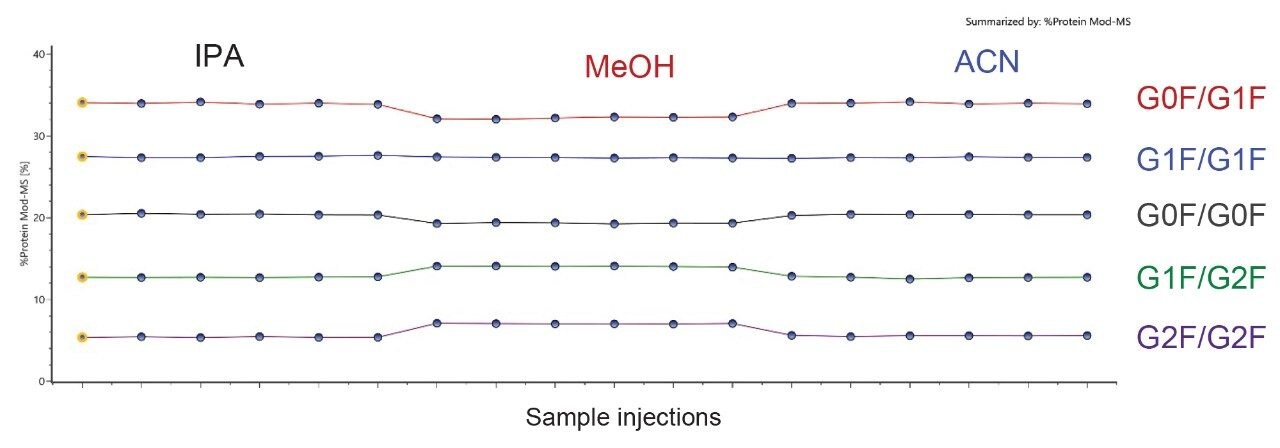 Figure 4. NIST mAb intact mass analysis deconvoluted spectra relative MS response comparison for the five major glycoforms (G0F/G0F, G0F/G1F, G1F/G1F, G1F/G2F, G2F/G2F) for replicates (n=6) of the three RP solvent systems.
mAb Subunit (scFc, LC, and Fd) Analysis
Subunit analysis was performed using the Waters mAb subunit standard and a five minute gradient LC-MS method. Figure 5 (left) shows the TIC comparison with IPA, MeOH, and ACN as the mobile phase B respectively. Chromatograms indicate well separated subunits (scFC, LC, and Fd) under all mobile phase coditions. The combined raw spectra of scFc were displayed in Figure 5 (right). Overall, no major differencce in signal quality were observed for all three subunits when different mobile phase solvents were used. If we considerd the average TIC intensities from three injections when using ACN as the mobile B was 1.00, the calculated average TIC intensities for IPA and MeOH as the mobile phase B were 1.18 and 1.06 respectively. Similar signal response ratios were observed from the raw MS spectra. This experiment results suggested that both IPA and MeoH performed at least as well as ACN for mAb subunit MS response.
 Figure 5. TIC comparison of Waters NISTmAb IdeS digested and reduced subunit standard using IPA, MeOH, and ACN as mobile solvents (left). Combined raw spectra comparision of the scFc subunit (right) is shown to demonstrate comparable MS spectra quality.
After MaxEnt1 charge state deconvolution in UNIFI/waters_connect, the major identitied subunits (scFC, LC, and Fd) are listed in Table 2. Similar mass accuracy (less than 15 ppm) and relative abundances of the major proteoforms were obtained for the three subunits across experiments.
 Table 2. Mass accuracy and relative abudance comparison of Waters NISTmAb IdeS digested and reduced subunit standard analysis using IPA, MeOH, and ACN as solvents for LC-MS.
During this study, LC system pressure varied significantly between solvent systems. Figure 6 is the system pressure overlay from the three organic solvents. When IPA was used, the system pressure was much higher (7500 psi) than those of MeOH (3000 psi) or ACN (2500 psi). The system pressure differences reflected the fact that IPA has much higher viscosity 6, 7, 8 than the other two solvents when used by itself or mixed in the gradient with water. The flow rate used in this study was 0.4 mL/min with a column (2.1 x 50 mm) held at 80 °C, keeping system pressures well within the 18k psi limitation of the ACQUITY system. However, as an added precaution, attention should be still paid to the system pressure change whenever IPA is used as the organic mobile phase, especially if the flow rate, column dimension or column temperature is modified from this study.
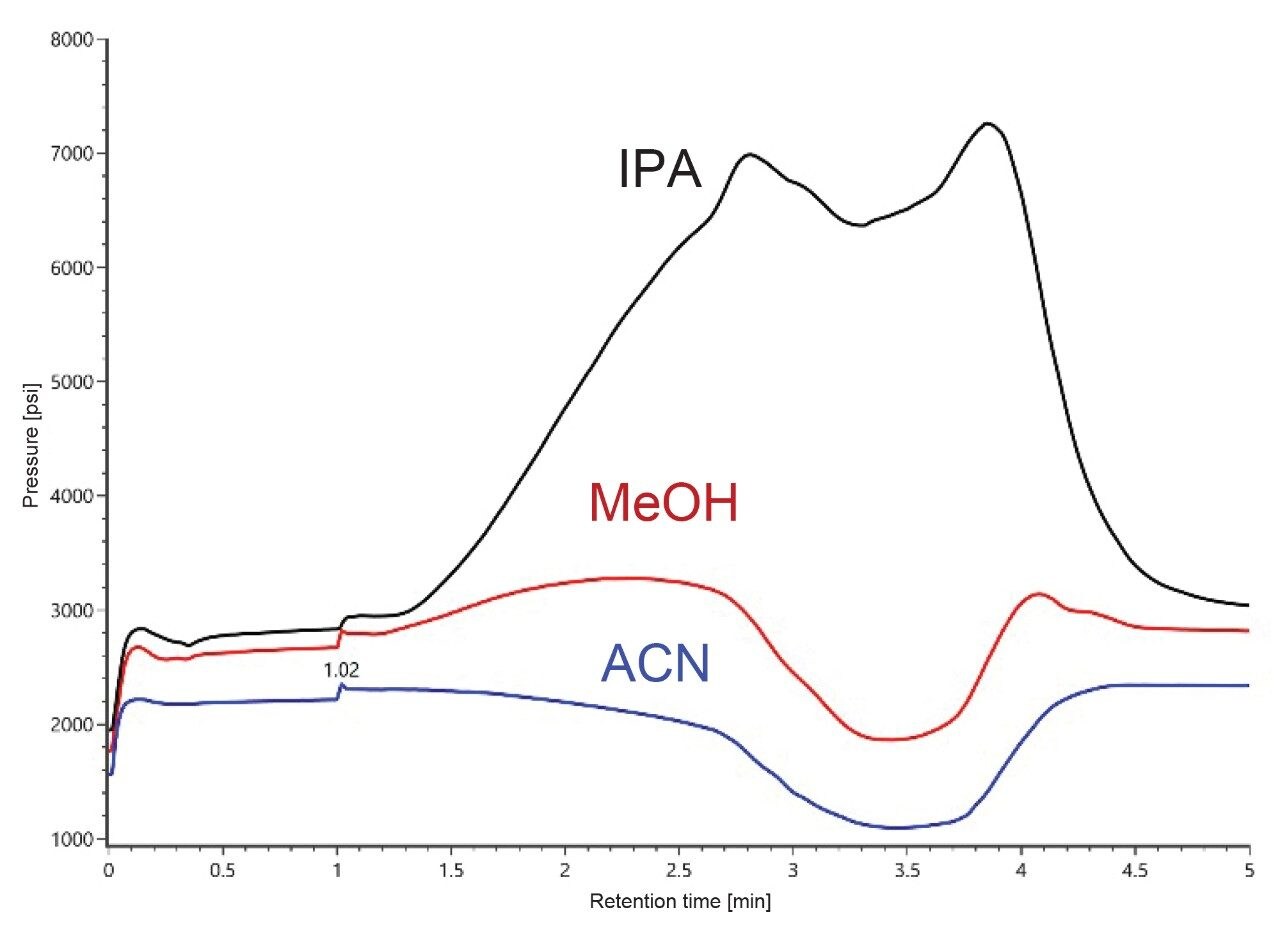 Figure 6. System pressure traces of Waters NISTmAb IdeS digested and reduced subunit standard analysis using IPA, MeOH, and ACN as mobile phase solvents.
Conclusion
In this study, we explored isopropanol (IPA) and MeOH as safer and more economical organic mobile phase solvents to ACN for intact mass analysis of biotherapeutics. The experimental results for the alcohols were comparable in terms of intact mAb data quality (e.g., peak shape, raw spectra glycoforms valley percentage), mass accuracy, and sensitivity. This observation extended to the analysis of mAb subunits (scFc, LC, and Fd) under similar LC-MS experimental conditions. Because of the mentioned environmental and cost benefits, we support the efforts of many scientists to develop greener and more cost-effective methodologies for intact protein LC-MS analysis.
References
- Welch, J., et al. Greening Analytical Chromatography, Trends in Analytical Chemistry, Vol. 29, No. 7, 2010.
- Yabré, M., et al. Greening, Reversed-Phase Liquid chromatography Methods Using Alternative Solvents for Pharmaceutical Analysis, Molecules Vol. 23, 1065, 2018.
- Funari, C., et al. Acetone as a Greener Alternative to Acetonitrile in Liquid Chromatographic Fingerprinting. J Separation Science. Volume 38, Issue 9, Pages: 1441–1624, 2015.
- FDA Q3C–Tables and List Guidance for Industry: https://www.fda.gov/media/71737/download.
- Dillon, T., et al. US patent: US 2005O161399A1, 2005.
- Waters “ACQUITY UPLC TUV Detector, Operator’s Overview and Maintenance Guide”, Waters User manual: 715004733, Page 82, 2014.
- Shion, H.; et al. Enabling Routine and Reproducible Intact Analysis When Data Integrity Matters. Waters Application Note, 720006472, 2019.
- Li, J., et al. Selection of Solvents and Mobile Phases for HPLC to Optimize Sensitivity of UV Detection, Analysis and Purification 2(1): 72–75 (1987).
- Li, J., et al. Signal-to-Noise Optimization in HPLC UV detection, LC-GC 10 (11): 856–864 (1992).
- Snyder, L. et al. Practical HPLC Method Development, 2nd ed., pp. 59-79 and 722–726, 1997.
Acknowledgements
The authors would like to thank Scott Berger (Senior Manager, Biopharmaceutical markets, Waters Corp.) for his valuable comments and editing on the draft of this application note.
720007540, February 2022