Evaluation of Multivariate Calibration with RADIAN ASAP Data for the Quantitation of Edible Oil Blends
This is an Application Brief and does not contain a detailed Experimental section.
Abstract
Blending of edible oils can improve the functional properties, stability, and sensory characteristics for the manufacturing of food products. In addition, adulteration of high-quality edible oils with cheap alternatives is a reoccurring issue. Therefore, rapid analytical tests are required to quickly determine the authenticity of edible oils, and for quality control during the preparation of edible oil blends. In this study, the use of a direct analysis mass spectrometer, RADIAN ASAP, along with multivariate calibration was assessed for the quantitation of extra virgin coconut oil and soybean oil blends. An orthogonal partial least squares (OPLS) regression model (n = 130) was built, showing a linear response between percentage oil blends and predicted percentage oil blends (R2 = 0.985). The model was validated with blind samples (n = 57) and the mean predicted percentage of oil blends per technical replicate were within ±5% of the actual value.
Benefits
- Quick and easy fingerprinting tool for manufacturing quality control
- Rapid determination of the percentage blend of edible oils
Introduction
Oils and fats are used for cooking and frying as well as in food formulations. Most vegetable oils have limited technological application in their original forms because of their specific chemical and physical properties, including functionality, stability, and antioxidative characteristics. To enhance their commercial application, vegetable oils are often modified using four different methods: hydrogenation, interesterification, fractionation, and blending.1 Mixing different vegetable oils can change fatty acid composition and give higher levels of natural antioxidants and bioactive lipids in the blends, as such blending can improve the nutritional value and the stability of oils. For example, blending of extra virgin coconut oil and soybean oil modifies the ratio of saturated and polyunsaturated fatty acids which improves the shelf life of the oil blend and enhances the taste of fried products.2 Oil blending is also used to adulterate premium products with less expensive seed oils for financial gain. Rapid tests are required not only during production to determine the quality of blended products, but also for enforcement of regulations around the labeling of blended oil products.
RADIAN ASAP is a compact ambient ionization mass spectrometer with an Atmospheric Solids Analysis Probe (ASAP) source. The absence of any sample preparation or chromatography steps when combined with a simple results dashboard makes results possible in seconds, thus speeding up decision making. Mass spectra generated using the RADIAN ASAP are used to create multivariate statistical models, including multivariate calibration which is the process of building mathematical models of calibration curves with multiple variables to predict physio-chemical properties of interest.3,4
In this application brief, the use of multivariate calibration with RADIAN ASAP data is evaluated for the quantitation of edible oil blends.
Results and Discussion
Principal component analysis (PCA) was carried out to assess the reliability of the data in generating a robust model focusing on maximum variance. PCA demonstrated separation of extra virgin coconut oil and soybean oil samples (Figure 1) with clear groupings observed. A total variance of 98.6% (PC1 ~ 96.0%, PC2 ~ 1.4%, and PC3 ~ 1.3%) of the model was explained by the first three principal components.
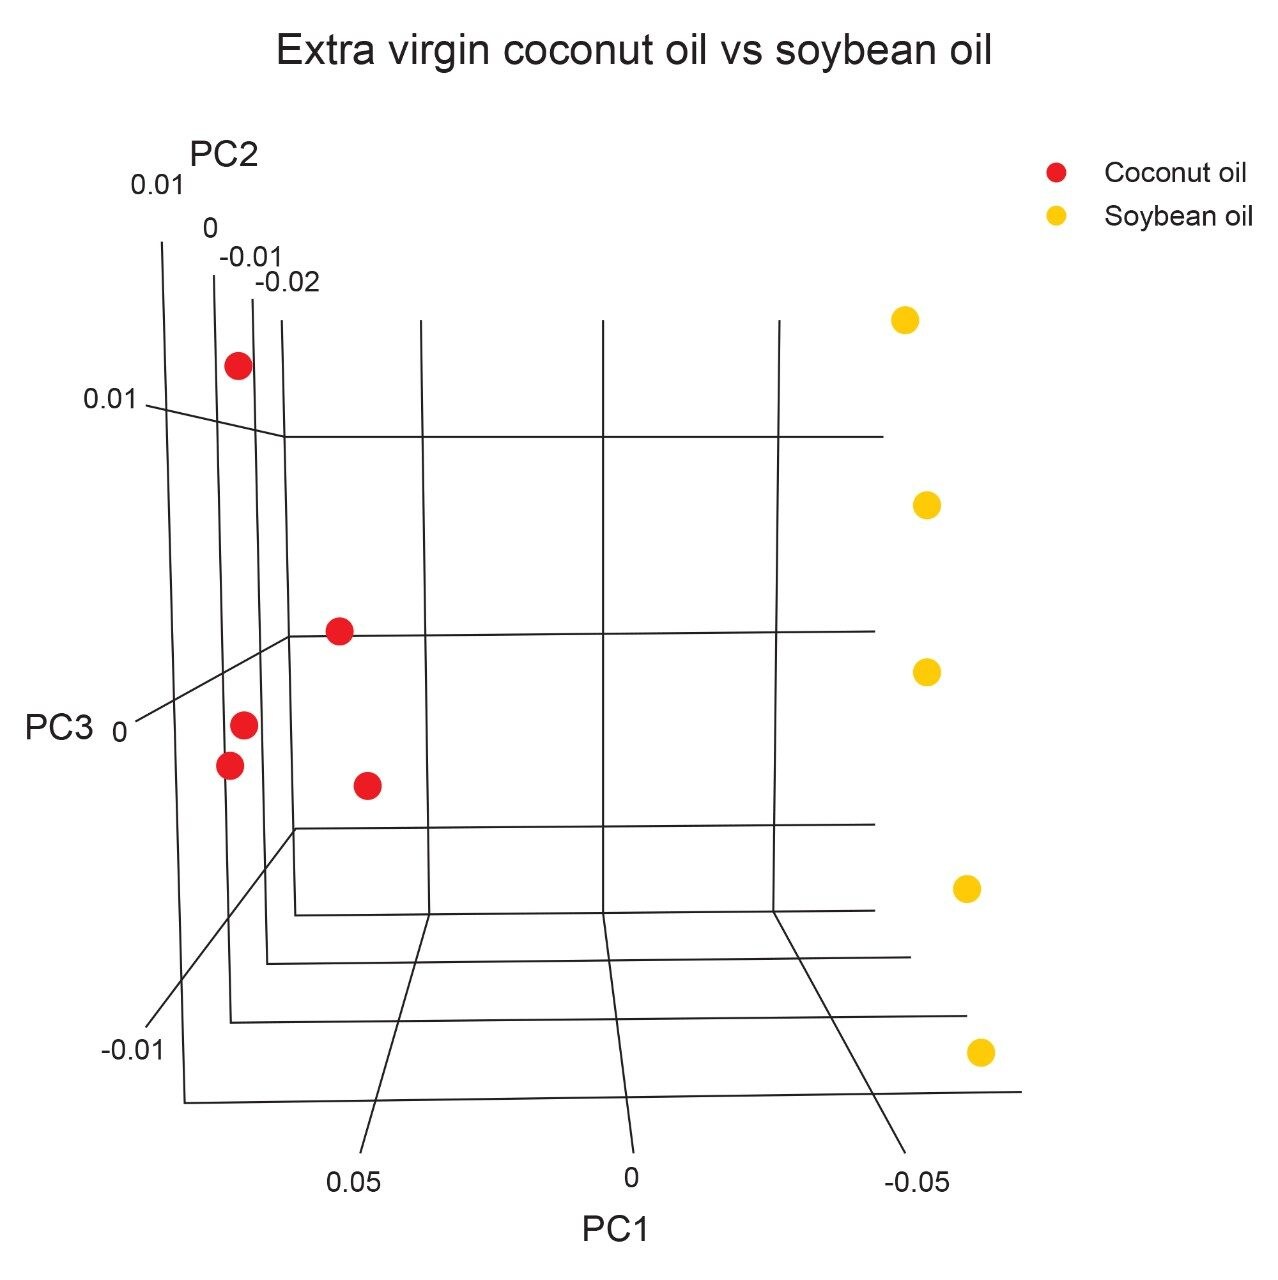 Figure 1. 3D-PCA score plot of extra virgin coconut oil and soybean oil from LiveID 2.0.
A multivariate calibration training model of oil blend admixtures (Table 1) was built using orthogonal partial least squares regression (OPLS) with 1 predictive component and 2 orthogonal components (n = 130). The training model captured 98.6% (R2Cum = 0.986) and predicted 97.0% (Q2Cum = 0.97) of the variation in the model. Of the total variation captured by the model, the predictive component accounted for 51.7% (R2X = 0.517) of the variation in the model. The OPLS score plot of the training model in Figure 2 shows a trend of sequentially increasing extra virgin coconut oil percentage in the oil blend from left to right of the predictive component t[1]. The multivariate calibration curve in Figure 3 shows a linear response (R2 = 0.9853) between the actual and predicted percentage of extra virgin coconut oil blend from the model.
 Table 1. Oil blend samples of extra virgin coconut oil and soybean oil for multivariate calibration training set.
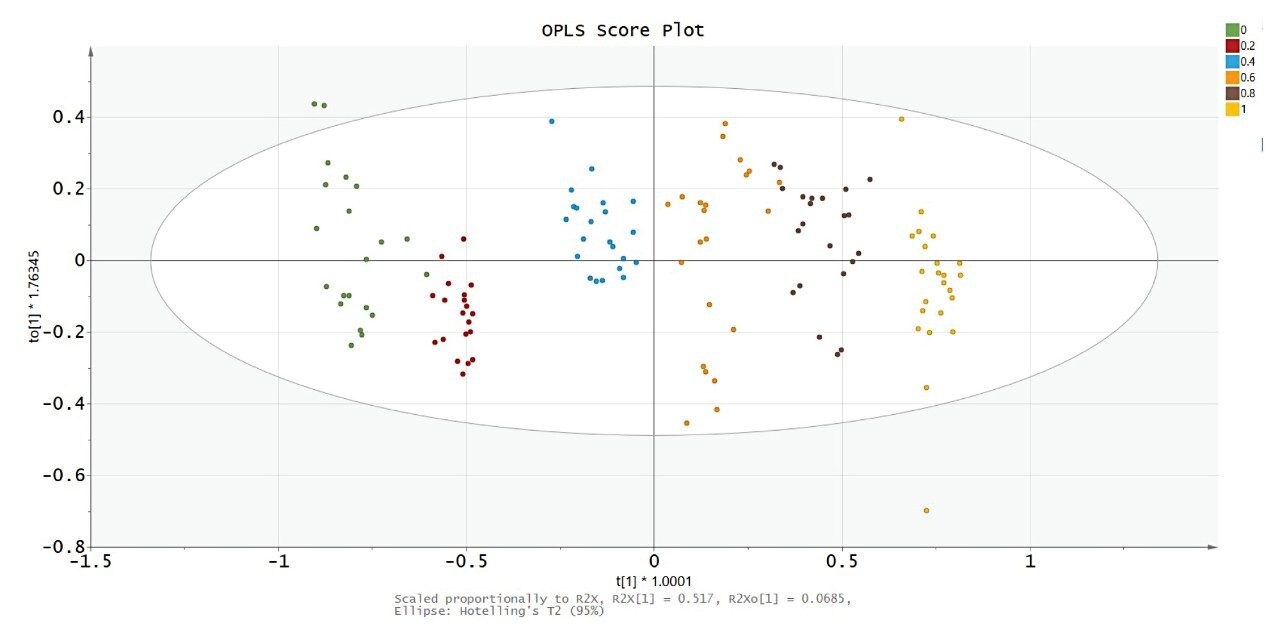 Figure 2. OPLS score plot from SIMCA® showing the predictive component t[1] and the first orthogonal component t[1] of oil blends comprising of 0% (0), 20% (0.2), 40% (0.4), 60% (0.6), 80% (0.8), and 100% (1) extra virgin coconut oil.
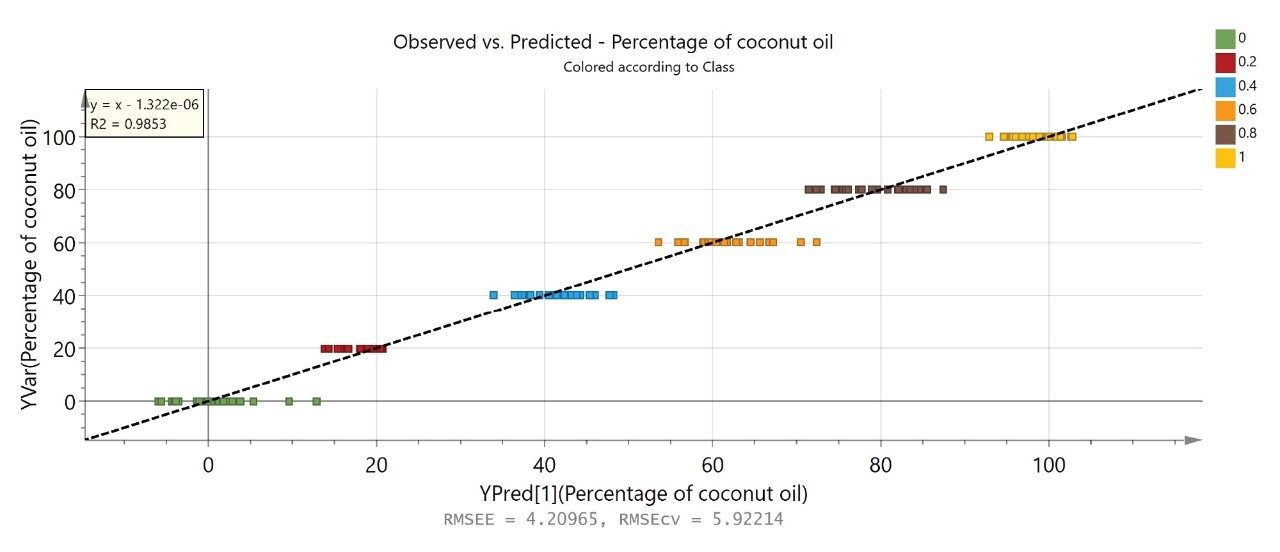 Figure 3. Multivariate calibration curve from SIMCA® of oil blends comprising of 0% (0), 20% (0.2), 40% (0.4), 60% (0.6), 80% (0.8), and 100% (1) extra virgin coconut oil.
The OPLS loadings plot in Figure 4 highlights mass spectral regions of m/z 390–530 and m/z 610–750 that are highly correlated with higher extra virgin coconut oil percentages, and spectral regions of m/z 850–920 that are highly correlated with higher soybean oil percentages. The mass spectral region of m/z 390–530 could consist of diacylglycerols;5 m/z 610–750 triacylglycerols with capric acid, lauric acid, myristic acid, and oleic acid fatty acid side chains;6,7 m/z 850–920 triacylglycerols with palmitic acid, linoleic acid, oleic acid, and stearic acid fatty acid side chains.6,7 The identities of these lipids can be further elucidated with complementary technologies such as liquid chromatography coupled with high resolution mass spectrometry (LC-HRMS).
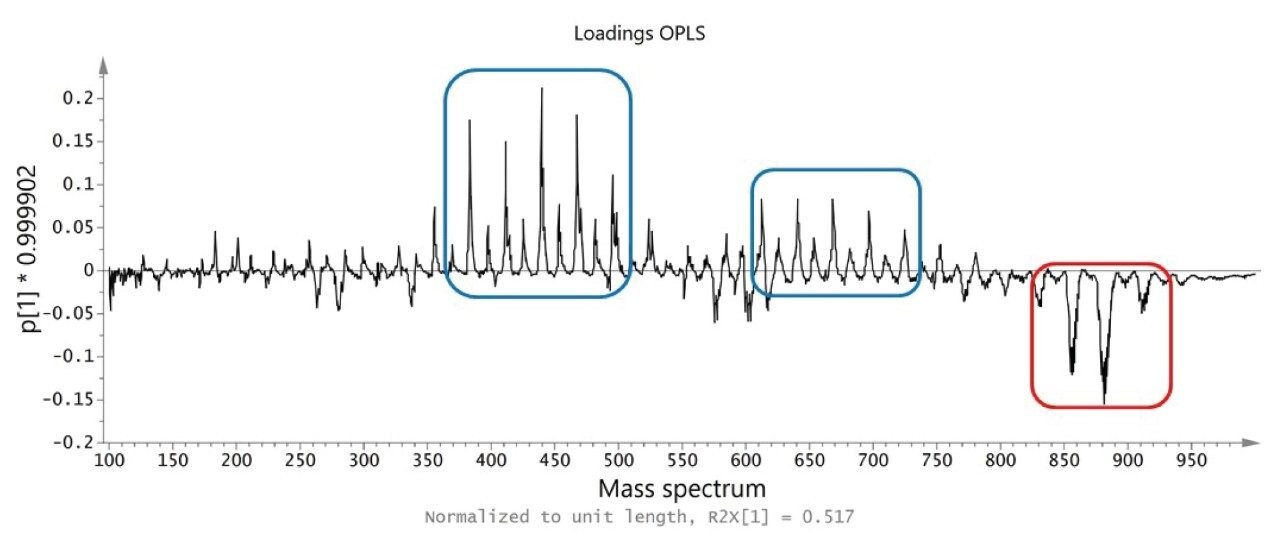 Figure 4. OPLS loadings plot from SIMCA® of predictive component (p[1]) showing the mass spectral regions which correlate with percentage of extra virgin coconut oil. Blue boxes indicate mass spectra that correlate with higher extra virgin coconut oil percentages and red boxes indicate mass spectra that correlate with higher soybean oil percentages.
The training model was used to predict oil blend admixtures in the independent validation test set (Table 2). Two technical replicates of each oil blend consisting of four to six repeat injections were acquired to validate the model (n = 57). The mean value for each technical replicate was compared against the actual percentage of oil blend (Figure 5). Overall, the mean predicted values per technical replicate for the percentage of oil blend were within ±5% of the actual value.
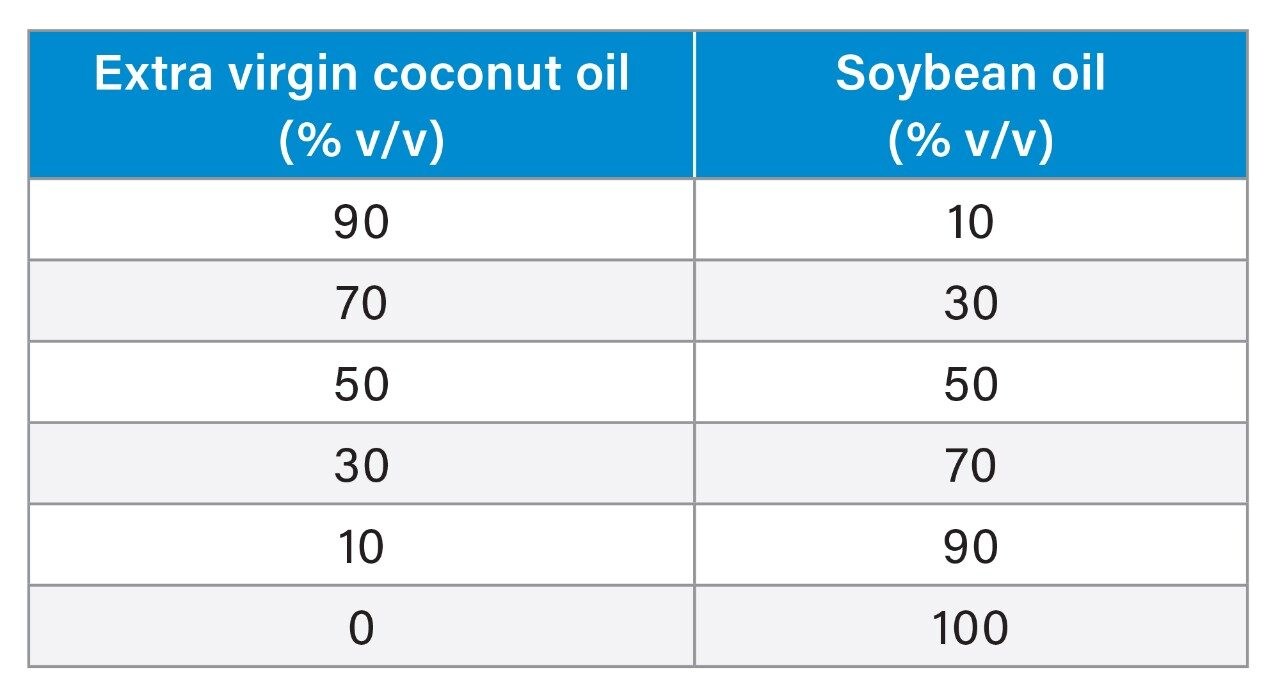 Table 2. Oil blend samples of extra virgin coconut oil and soybean oil for multivariate calibration validation test set.
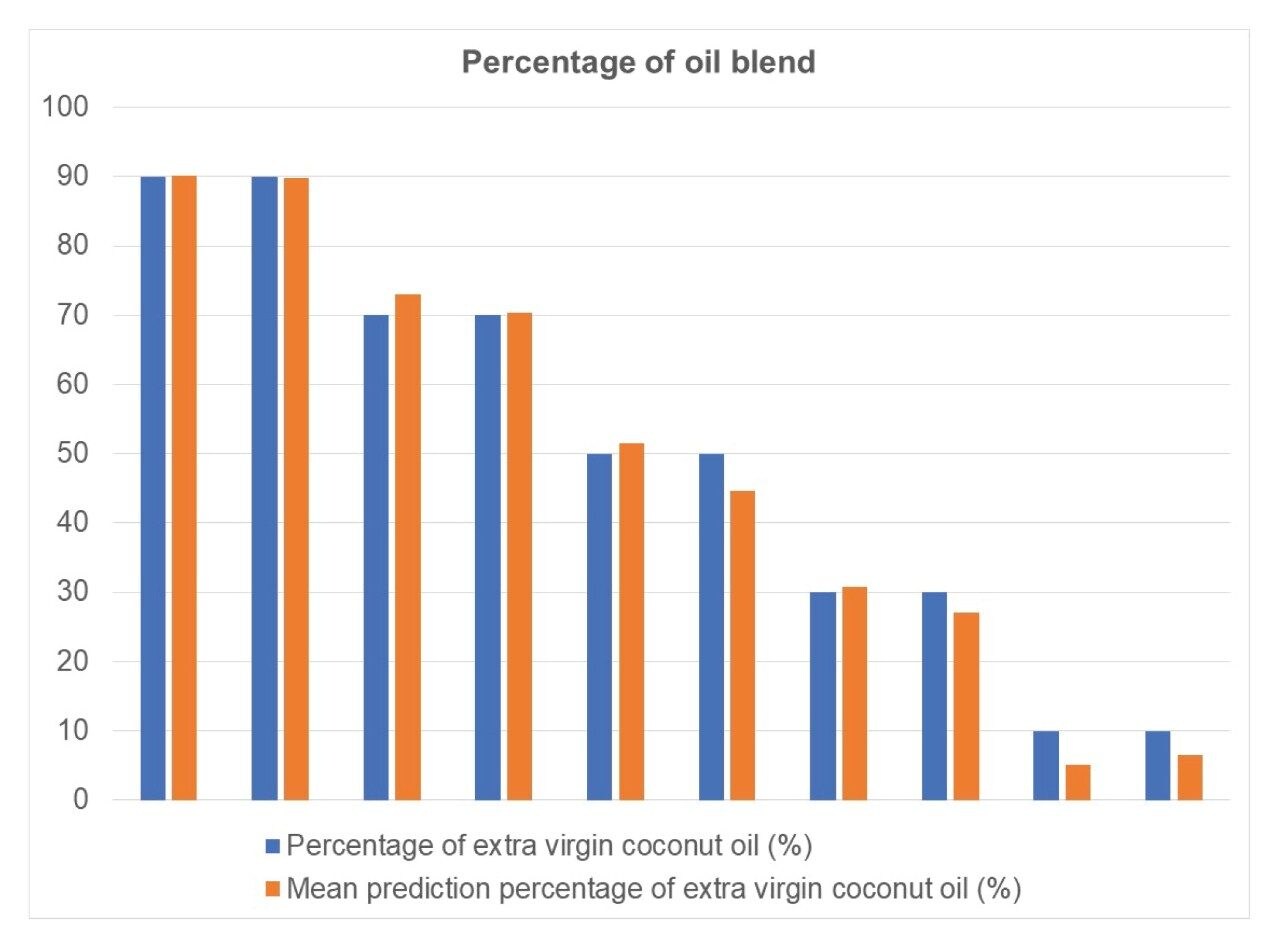 Figure 5. Mean predicted extra virgin coconut oil percentage per technical replicate compared to actual value.
Conclusion
The RADIAN ASAP is a compact and rapid analytical tool which facilitates decisions to be made faster. In this study, data from the RADIAN ASAP was used to create and validate a multivariate calibration model for the determination of the proportion of individual oils in blends of extra virgin coconut oil and soybean oil. The OPLS loading plots provide mass spectral information which can support putative identification of possible markers which can be confirmed using direct analysis on a high-resolution mass spectrometer.
References
- Senanayake SPJN, Shahidi F. Modification of Fats and Oils via Chemical and Enzymatic Methods. Bailey’s Industrial Oil and Fat Products. 2005.
- Srivastava Y, Semwal AD, Sajeevkumar VA, Sharma GK. Melting, Crystallization and Storage Stability of Virgin Coconut Oil and Its Blends by Differential Scanning Calorimetry (DSC) And Fourier Transform Infrared Spectroscopy (FTIR). J Food Sci Technol. 2017 Jan;54(1):45–54.
- Bro R. Multivariate Calibration: What Is in Chemometrics for the Analytical Chemist? Anal Chim Acta. 2003;500(1):185–94.
- Forina M, Lanteri S, Casale M. Multivariate Calibration. J Chromatogr A. 2007;1158(1–2):61–93.
- Ferreira JA, Santos JM, Breitkreitz MC, Ferreira JMS, Lins PMP, Farias SC, et al. Characterization of the Lipid Profile From Coconut (Cocos nucifera L.) Oil of Different Varieties by Electrospray Ionization Mass Spectrometry Associated With Principal Component Analysis and Independent Component Analysis. Food Res Int. 2019;123:189–97.
- Bataglion GA, da Silva FMA, Santos JM, Dos Santos FN, Barcia MT, de Lourenço CC, et al. Comprehensive Characterization of Lipids From Amazonian Vegetable Oils by Mass Spectrometry Techniques. Food Res Int. 2014 Oct;64:472–81.
- Pizzo JS, Galuch MB, Manin LP, Santos PDS, Zappielo CD, Santos Junior O, et al. Direct Infusion Electrospray Ionisation Mass Spectrometry Applied in the Detection Of Adulteration of Coconut Oil With Palm Kernel Oil. Food Addit Contam Part A, Chem Anal Control Expo risk Assess. 2019 Nov;36(11):1597–604.
Featured Products
720007437, November 2021