Evaluation of Arc™ Premier Pump Performance for Long Shallow Gradient Peptide Mapping Analysis
Abstract
The complex nature of protein digestions requires demanding conditions for liquid chromatography (LC) systems to separate the large number of peptides with similar chemical properties by reversed-phase. Due to the demanding conditions of low flow rate and shallow gradient change, it is critical to have accurate and precise pump performance to deliver reproducible results. In this study, a peptide mapping method with a low flow rate and shallow gradient change (0.5 %B/min) is used to measure the suitability of the Arc Premier Binary System by examining retention time precision and baseline performance. The system is evaluated and compared to a competitive bio-LC system.
Benefits
- The Arc Premier Binary System provides improvement in data quality and reproducibility
- The Arc Premier System delivers improved sensitivity due to mixing characteristics and HPS technology improving chromatographic baseline
Introduction
The goal of a developed liquid chromatography method is to reliably generate results that are both accurate and reproducible. Ultra-High-Performance Liquid Chromatography (UHPLC) systems like the Arc Premier are designed to analyze a wide variety of samples. This leads to method conditions that can vary in many ways, and as such, it is critical that the LC system exhibits high performance regardless of the method. Peptide mapping analysis presents ideal method conditions for evaluating LC pump performance. These methods, often in conjunction with mass detection, use lower flow rates and long, shallow gradients; conditions which are some of the most challenging for a pump to reliably reproduce.1-3 The sample complexity for peptide mapping of protein digests requires these strenuous conditions to achieve separation of the large number of digestion products. Additionally, the peptide samples may contain acidic or phosphorylated peptides which can interact with metal surfaces making analysis challenging on traditional LC systems.4
The Arc Premier System is ideally suited for HPLC reversed-phase separation of peptide mixtures and protein digests. The system features MaxPeak™ High Performance Surfaces (HPS) Technology, which reduces interactions between the system and metal-sensitive analytes. The Arc Premier System can be configured with either a quaternary solvent manager (QSM-R) or binary solvent manager (BSM-R). Binary pumps are more effective at producing the required gradient fidelity for peptide mapping assays due to improved accuracy at low composition ratios. The system also features a larger 50 µL mixer, which is critical to ensure reproducible solvent delivery without any baseline fluctuations during optical detection. A fluctuating or “wavy” baseline leads to inconsistencies between injections and runs, typically in the form of retention time shifts and peak area and sensitivity variability. This fluctuating baseline is also impacted by the use of trifluoroacetic acid (TFA) as a mobile phase additive.1 TFA has a low UV cutoff of 210 nm, so any differences in solvent composition will hinder baseline performance. A fluctuating baseline also leads to inconsistent integrations as portions of peaks can be hidden underneath an elevated area of the baseline.
In this study, retention time and signal-to-noise are examined for the Arc Premier System configured with a binary solvent manager and a competitive quaternary bio-LC system. Both the Arc Premier System and competitor system contain an inert or bio inert flow path designed to minimize system to analyte interactions. However, the default flow path of the competitor system does not contain a mixer.
Experimental
Sample Description
Waters MassPREP Enolase Digestion Standard (p/n: 186002325) was reconstituted in 100 µL of 0.1% trifluoracetic acid in water (mobile phase A) per the Care and Use Manual. Vials were pooled to yield sufficient sample for all systems then redistributed as needed. Mobile phases were also prepared as a batch and distributed amongst systems to minimize variability. Samples and mobile phases were prepared daily.
LC Conditions
|
LC system: |
Arc Premier System with CH-A and BSM-R |
|
Detection: |
Arc Premier 2998 PDA Detector with 10 mm analytical Arc Premier flow cell |
|
Sample: |
MassPREP Enolase Digestion Standard (p/n: 186002325) |
|
Column: |
XSelect™ CSH™ C18 2.5 μm, 4.6 × 150 mm (p/n: 186006729) |
|
Column temperature: |
60 °C |
|
Sample temperature: |
10 °C |
|
Injection volume: |
25 μL |
|
Flow rate: |
0.500 mL/min |
|
Mobile phase A: |
0.1% Trifluoroacetic acid in water |
|
Mobile phase B: |
0.1% Trifluoroacetic acid in acetonitrile |
|
Needle wash: |
50/50 Mobile phase A/Mobile phase B |
|
Seal wash: |
90/10 Water/Methanol |
|
Wavelength: |
214 nm |
|
Collection rate: |
10 Hz |
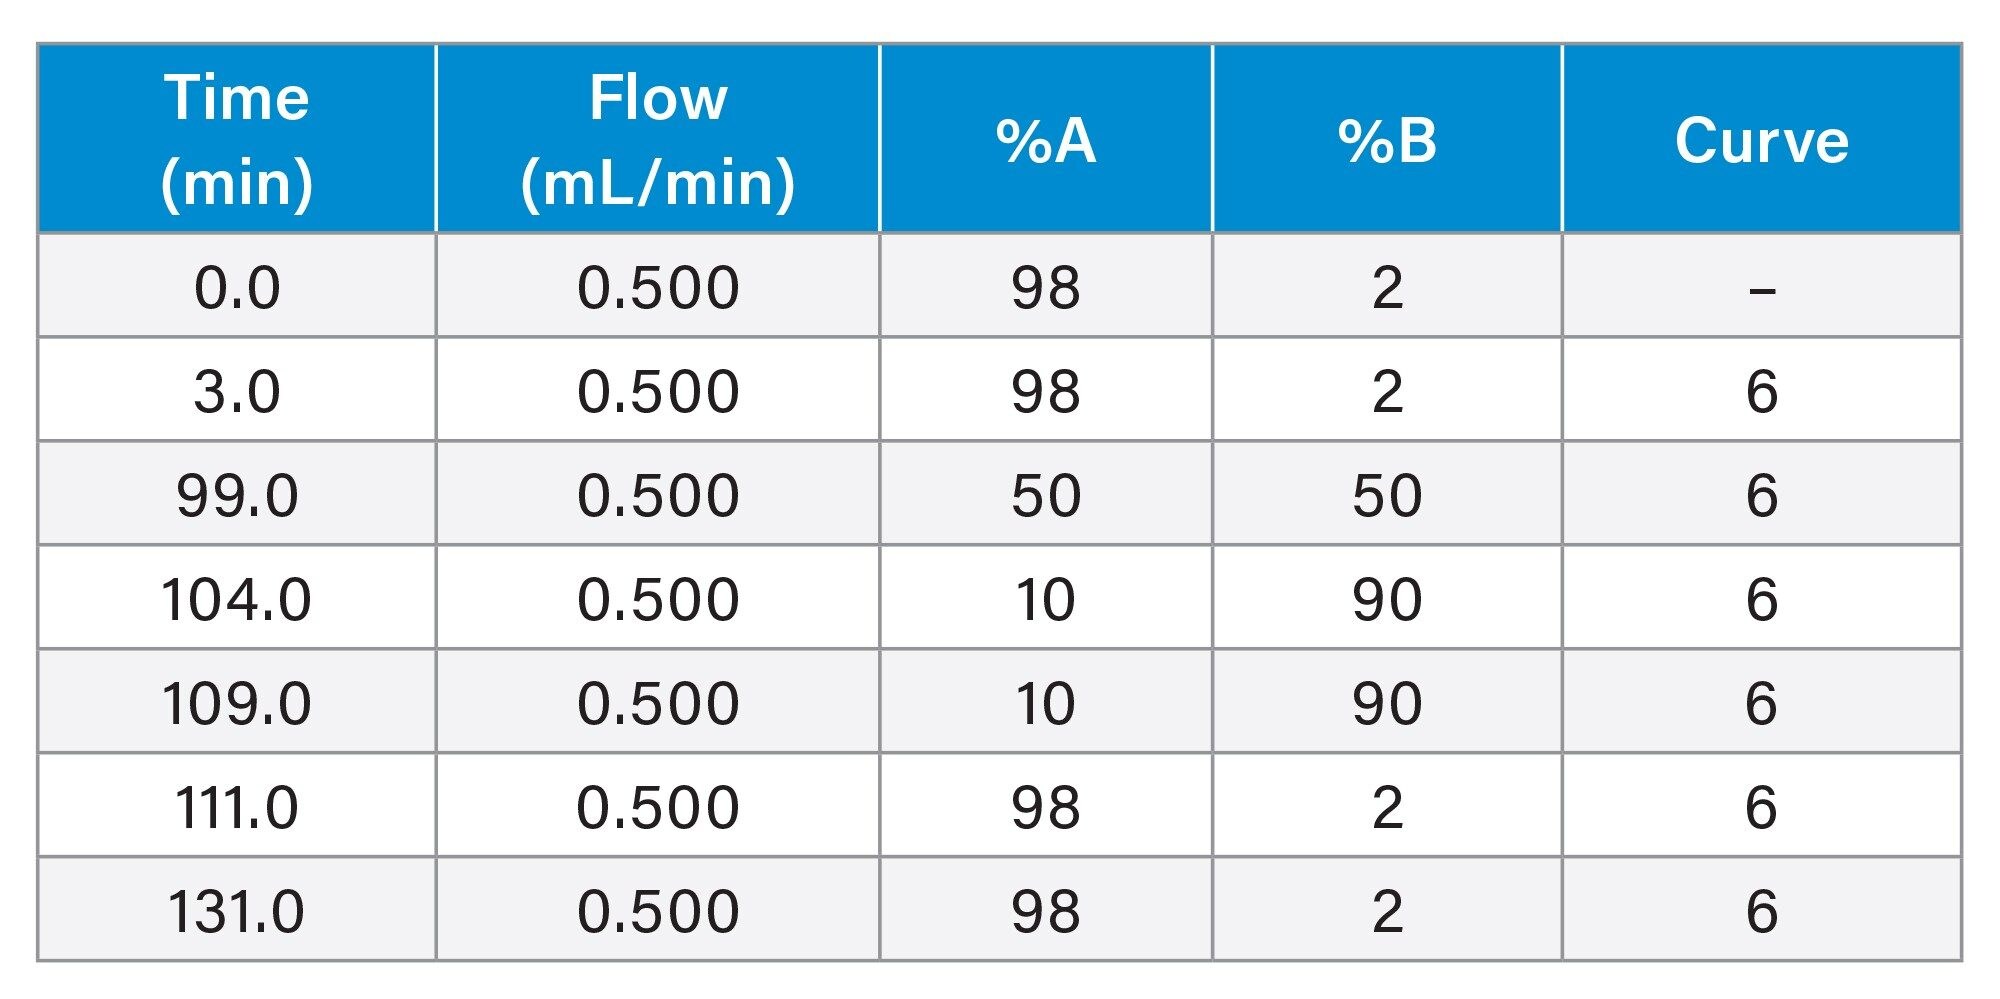
Gradient
Data Management
|
Software: |
Empower™ 3.6.1 |
Results and Discussion
To adequately separate the many digested peptides in the sample, peptide mapping methods most commonly include a long, shallow gradient and lower flow rate. In the method used for this study, there is an increase in organic mobile phase at a rate of 0.5 %B/min over 96 minutes at a flow rate of 0.500 mL/min. Each sample set contained 6 injections from the pooled enolase digest sample and sample sets were replicated four times on each system over the course of four days. Figure 1 shows an overlay of six replicate injections acquired from a single sample set using the Arc Premier System configured with the BSM-R. The replicate injections show a strong visual representation of system reproducibility. Also shown are eleven labeled peaks which will be used to monitor system performance.
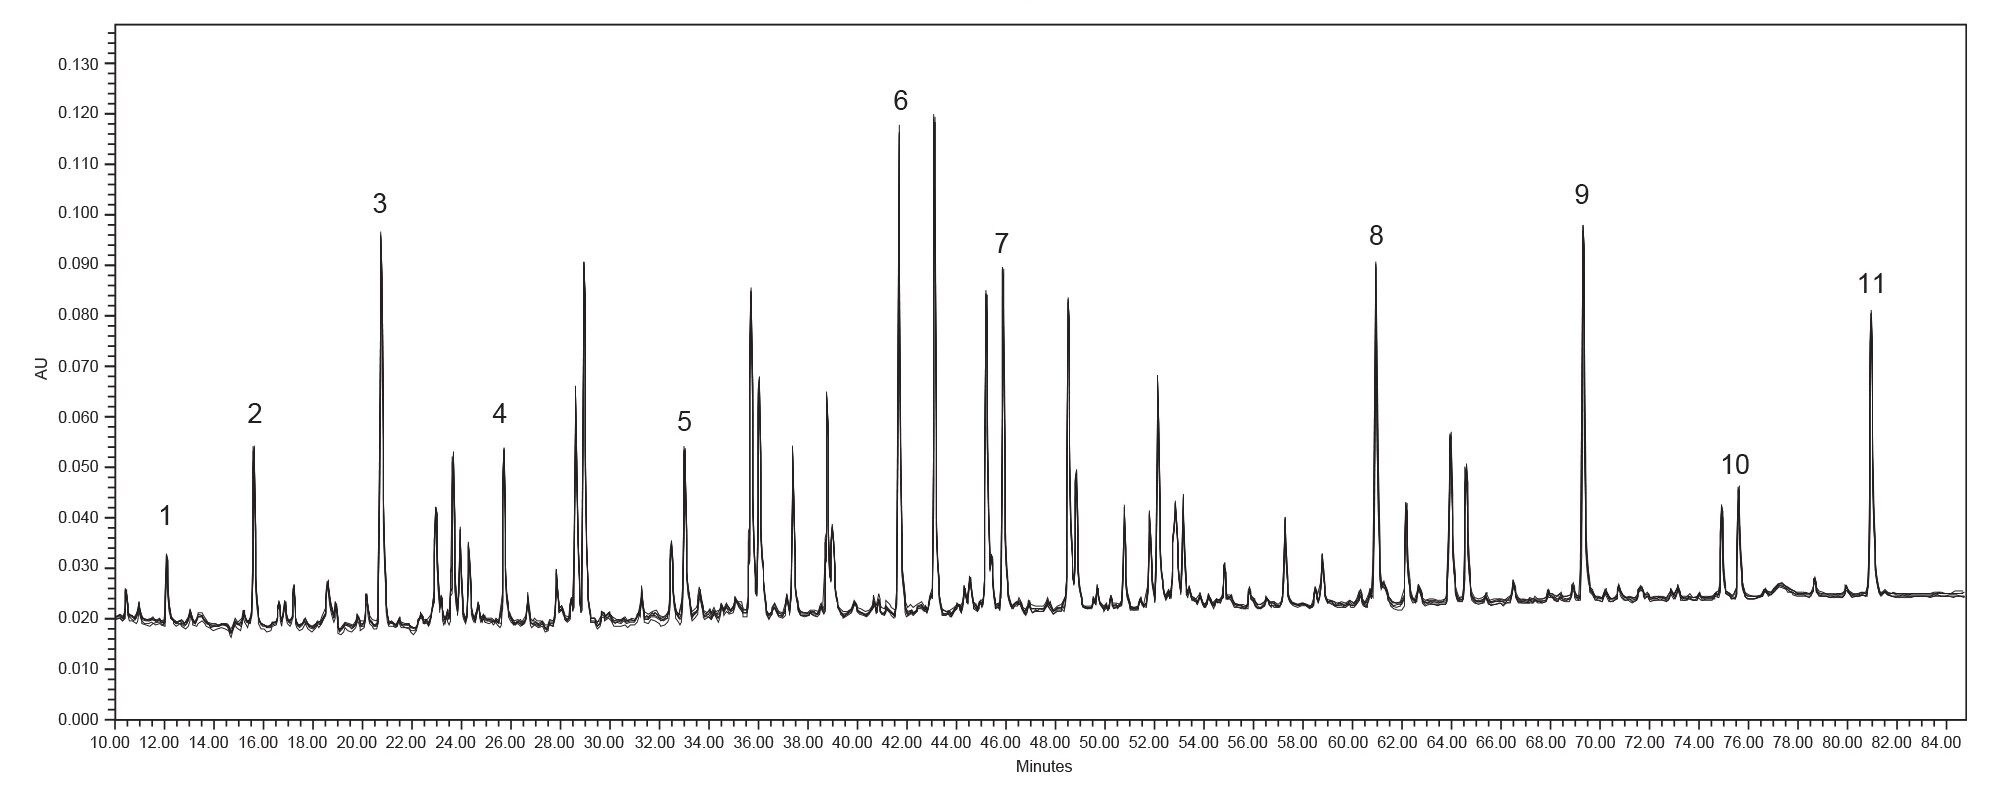 Figure 1. Overlay of six replicate injections of MassPREP Enolase Digest with labeled peaks included in subsequent analysis
There are several instances in the above chromatogram of incomplete resolution between peaks. To monitor performance characteristics such as signal-to-noise, a peak should be fully resolved on all systems to ensure accurate comparison. A peak that is not fully resolved will generate less reproducible results both within a sample set and across multiple days of testing. For this reason, the peaks selected to monitor demonstrated sufficient resolution on all systems despite chromatographic differences between the systems. Additionally, the selected peaks eluted over a wide range of gradient conditions, enabling monitoring of performance differences over the course of the gradient profile. An example of one such chromatographic difference is shown below in Figure 2. Figure 2 shows a fifteen minute window of chromatographic results taken from a sample injection run on the same day on both systems. While the actual time range varies due to factors such as delay volume, there are some selectivity differences across the systems for the same overall set of peaks as shown in both chromatograms. On the Arc Premier System, there are four distinct peaks in the 22.5 to 25 minute range. However, in the 26.5 to 29 minute range on the competitor LC system there are only two distinct peaks. For this reason, it is not possible to use any of the four peaks visible in the Arc Premier chromatogram for any quantitative measurements that would compare to a peak in the competitor chromatogram within this range.
 Figure 2. A comparison of chromatographic differences between systems using a selected fifteen minute window. A) Fifteen to thirty minutes on Arc Premier System’s chromatogram with four highlighted peaks in the 22.5–25 minute range. B) 19–34 minutes of Vendor X System with two highlighted peaks in the 26.5–29 minute range.
Most significantly, there is a large baseline ripple in the competitor chromatogram shown in Figure 2, while the Arc Premier chromatogram does not have any visible ripple at this scale. One possible explanation for this behavior is the lack of mixer within the flow path of the competitor system. The Arc Premier System contains a 50 µL mixer within the pump which helps to minimize noise and flatten the baseline. This baseline fluctuation is most noticeable at the beginning of each chromatogram from the competitor system where the smallest ratio of mobile phase B to mobile phase A is being delivered by the pump. As the ratio of solvent delivery gets less demanding on the pumps, the observed noise of the competitive quaternary pump is similar to levels seen on the Arc Premier BSM-R. As a result, the average peak-to-peak noise measurement is lower on the Arc Premier System throughout the early portion of the gradient, while both systems produce similar noise levels for the remainder of the gradient (Figure 3). In Figure 3, noise ranges have been selected for both systems that surround the eleven peaks being monitored. The noise ranges are equivalent in total time and segment width, with small differences in start and end time due to factors discussed above that change absolute retention time. The noise value measured before peak 1 is more than five times lower in the Arc Premier System than the competitor and remains lower through the middle portion of the gradient. By peak 8, where over 30% B is being delivered and there is no visible ripple in the baseline, the peak-to-peak noise values are similar for both systems.
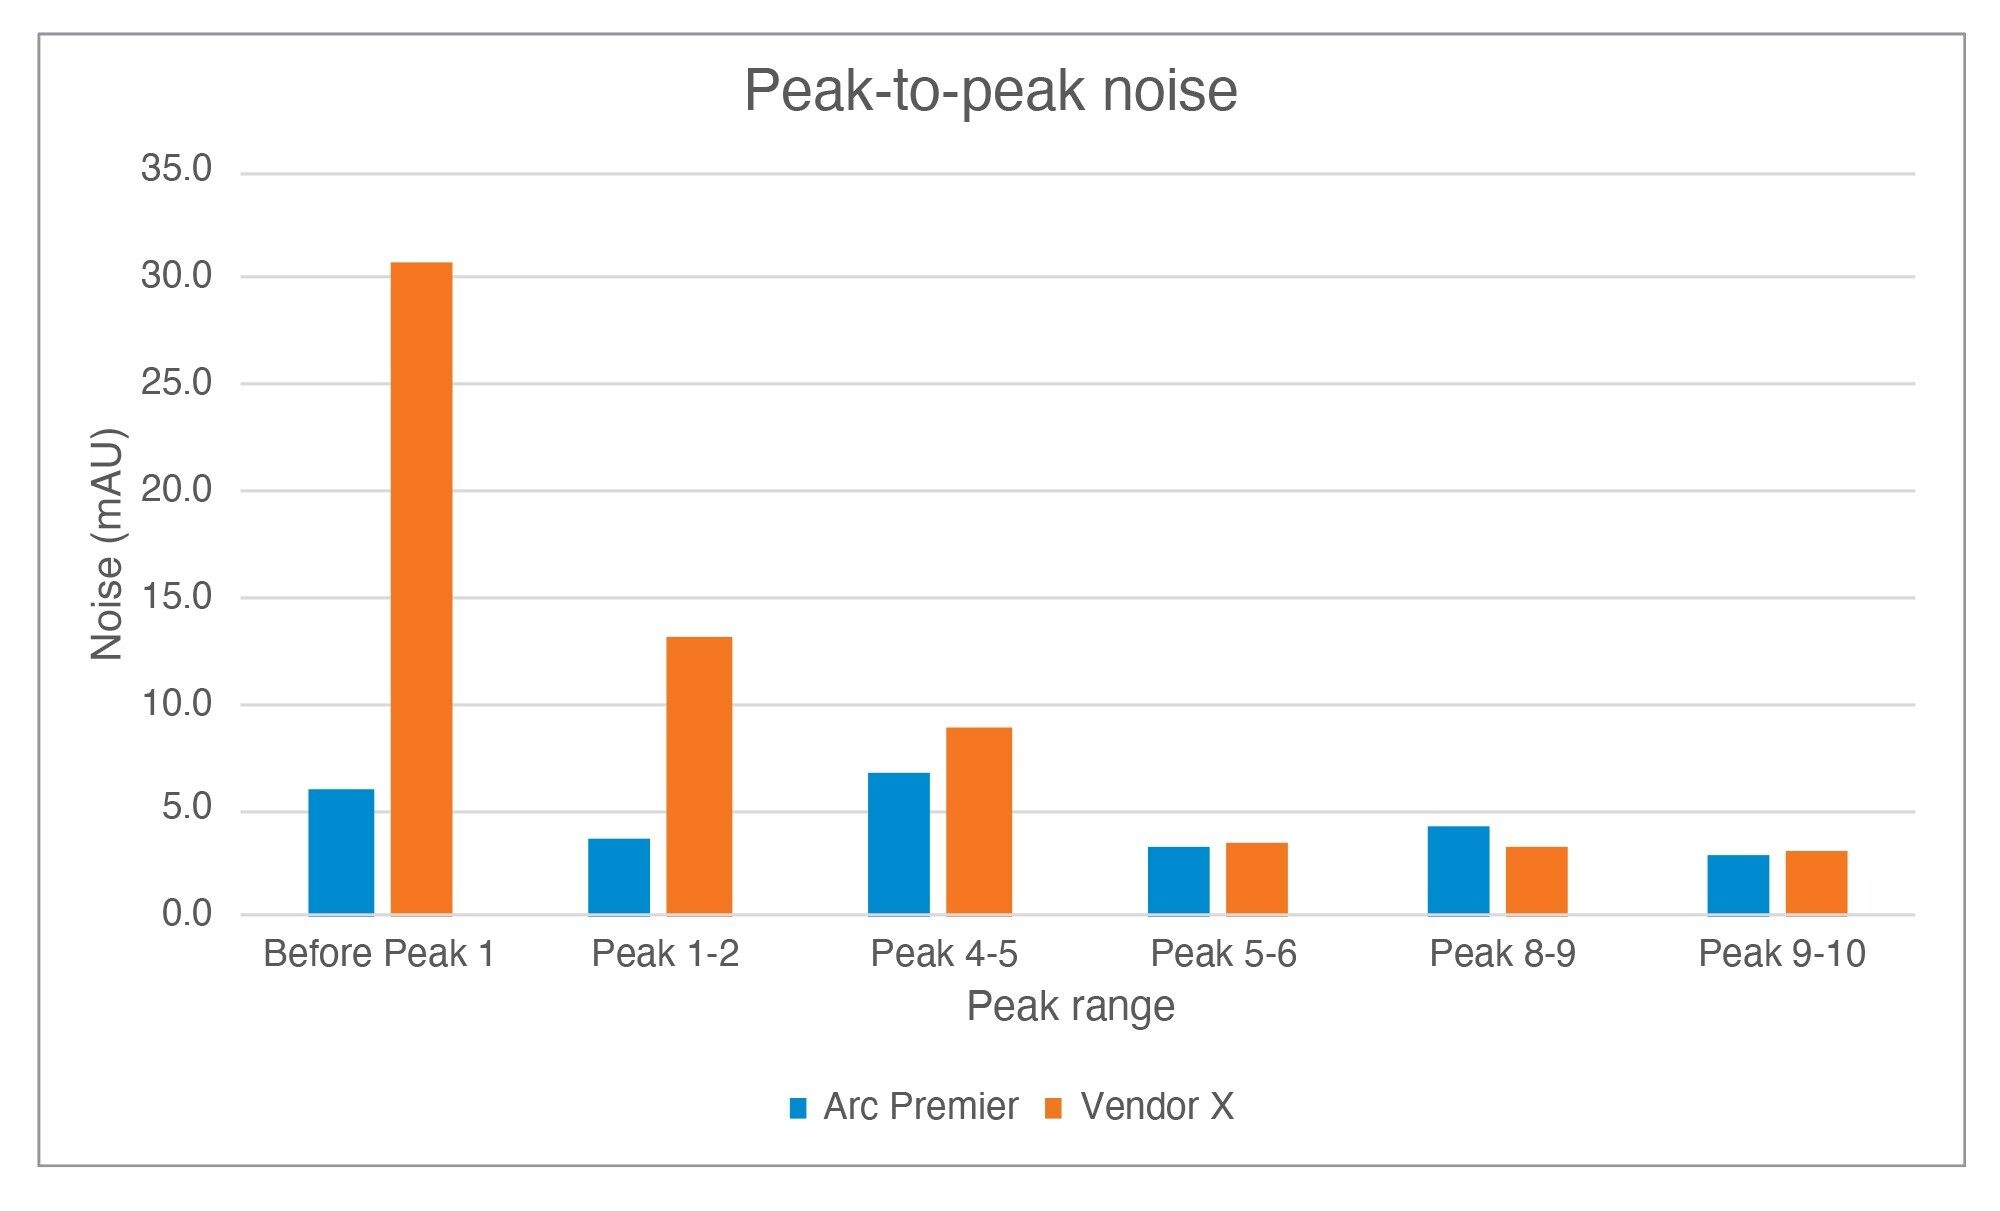 Figure 3. Average peak-to-peak noise results for selected ranges throughout sample injections of the Arc Premier System and Vendor X System. Noise ranges are the same time length with small shifts in start and end time as appropriate.
As the peak-to-peak noise data indicates, the two chromatographic baselines range from comparable to significantly lower for the Arc Premier System. This is reflected in the average signal-to-noise as well. The absolute signal response in both systems is similar thus the flatter baseline in the Arc Premier System yields signal-to-noise values that are larger than in the competitor system. This improved sensitivity is demonstrated below in Figure 4 where the measured signal-to-noise is larger for all peaks on the Arc Premier System.
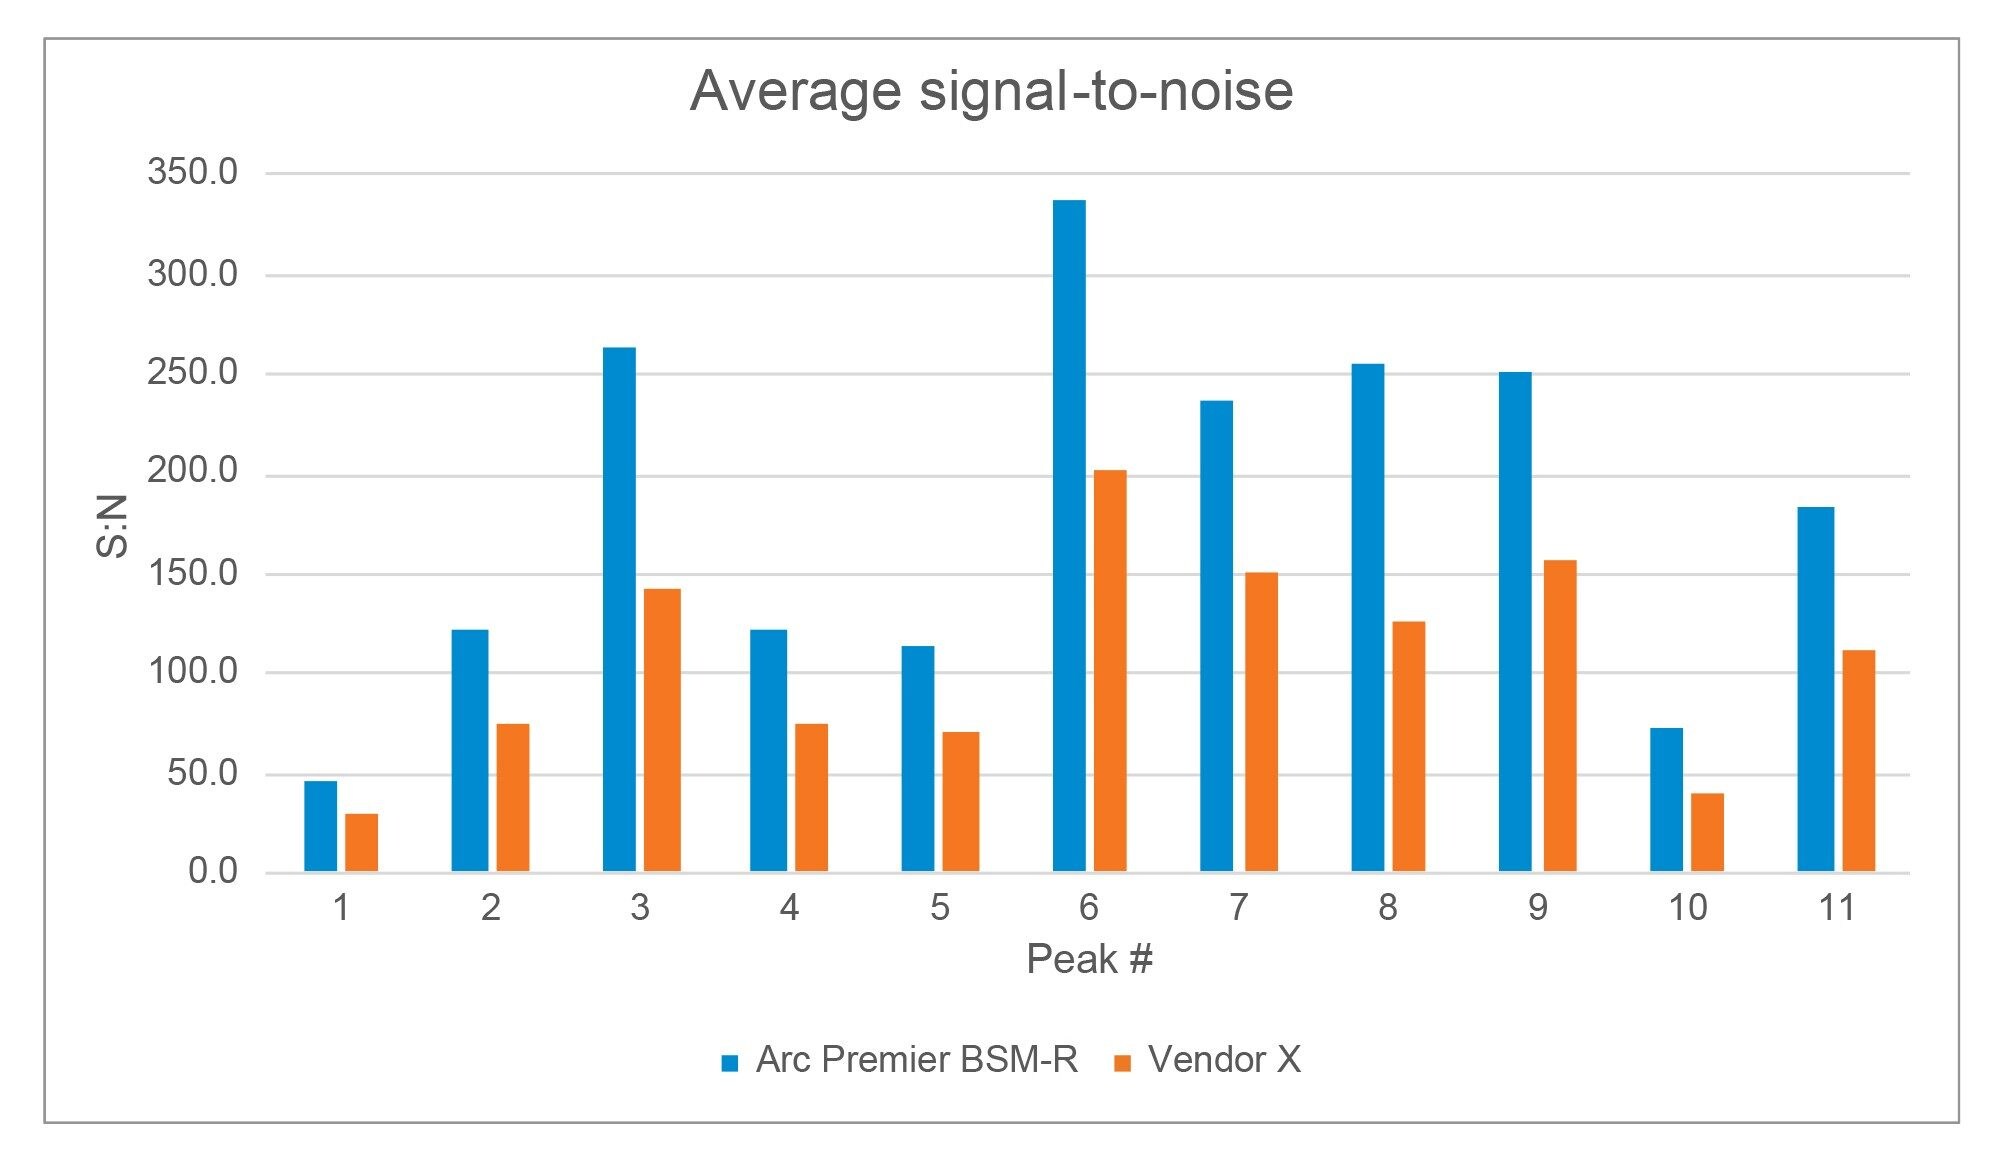 Figure 4. Average USP signal-to-noise results for all highlighted peaks on both the Arc Premier System and Vendor X System.
In addition to examining the baseline, peak-to-peak noise, and signal-to-noise data, the retention time reproducibility is another quantitative measure of system performance focused on the pump. As shown in Figure 5, the average retention time standard deviation is lower using the Arc Premier BSM-R than the competitive alternative for all peaks monitored. Poor retention time reproducibility is especially pronounced for the earliest eluting peaks where the baseline is the least stable on the competitive system. On the competitor system, the average deviation of the first five peaks is almost double that in peaks 6–11 (0.031 min to 0.016 min). Though Peak 1 has the largest overall error for any Arc Premier System peak, the average deviation for the first five peaks of the Arc Premier System is similar to that of peaks 6–11 (0.014 min to 0.012 min). This shows the Arc Premier System is capable of maintaining excellent performance even under the most demanding conditions.
 Figure 5. Average retention time standard deviation results obtained on the Arc Premier with BSM-R System and Vendor X System. Averages were first calculated within sample set (six injections) followed by aggregating over four samples sets.
Conclusion
Peptide mapping analysis requires demanding methods where small changes in system performance can yield a large impact on chromatographic results. Given the method conditions in this study, a system with a binary pump is expected to have the strongest performance. When compared to another bio-LC solution, the Arc Premier with BSM-R System yielded more reproducible retention time results while also producing a flatter and less noisy baseline. These baseline improvements produce greater signal-to-noise and lower peak-to-peak noise, and yield more consistent integrations, all of which are critical to system performance. For this reason, the reliability and flexibility of the Arc Premier System with binary solvent manager makes it an ideal system for this type of analysis.
References
- Simeone J, Hong P. Peptide Mapping using Binary Biocompatible LC Systems: Evaluation of Retention Time Precision and Mixing Effects on Waters and Competitive LCs. Waters Application Note, 720007078, Revised 2021.
- Delaney K, Birdsall RE, Yu YQ. Improving Peptide Mapping Studies and Reducing Assay Failures Through Reproducible Performance Using the ACQUITY Premier UPLC System (BSM). Waters Application Note, 720007593, 2022.
- Simeone J, Hong P, McConville PR. Performance of the ACQUITY UPLC I-Class PLUS System for Methods which Employ Long, Shallow Gradients. Waters Application Note, 720006290, 2018.
- Martin W, Shah D, Grzonka C, Dovell A, Li Z, Hong P, Turyan I, Dyke J. Recovery of Metal-Sensitive Analytes on the Arc Premier Solution: System-to-System Reproducibility and a Multi-System Comparison to Conventional LC. Waters Application Note, 720007330, 2021.
720007709, September 2022