• Application Note

Introduction to MALDI Imaging

Introduction to MALDI Imaging

  • Marten F. Snel
  • Emmanuelle Claude
  • Therese McKenna
  • James I. Langridge
  • Waters Corporation

For research use only. Not for use in diagnostic procedures.

This is an Application Brief and does not contain a detailed Experimental section.

Abstract

The last few years have seen a rapid increase in the interest in mass spectral imaging directly from tissue. The aim of this type of experiment is to obtain information on the spatial distribution of compounds in plant or animal tissue. Mass spectrometry is an attractive proposition for imaging, as a large range of different compounds can be detected simultaneously, it is relatively inexpensive compared to many other imaging techniques, and it does not require any labelling of compounds of interest.

Introduction

The last few years have seen a rapid increase in the interest in mass spectral imaging directly from tissue.1 The aim of this type of experiment is to obtain information on the spatial distribution of compounds in plant or animal tissue. Mass spectrometry is an attractive proposition for imaging, as a large range of different compounds can be detected simultaneously, it is relatively inexpensive compared to many other imaging techniques, and it does not require any labelling of compounds of interest.

Experimental

A Typical MALDI Imaging Experiment

Thin tissue sections between 10 and 20 μm thickness are produced using a cryotome and mounted on a MALDI target plate or a microscope slide. MALDI matrix is then applied, either in several coatings using a handheld aerosol sprayer or using an automated spotter or sprayer. Once the sample is coated, an area to be analyzed is identified and the coordinates for the spatial acquisition are determined accordingly.

During data acquisition, the target plate is moved in a raster pattern while the laser is being fired. The mass spectral data acquired are organized in such a way that the spatial position they were obtained from is recorded. Post acquisition mass spectral data can be converted to ion intensity maps for specific ions. An example of MALDI imaging data acquired on a Waters MALDI SYNAPT HDMS System is shown in Figure 1.

Figure 1. Examples of MALDI images obtained from a 12 μm section of rat brain (a) Photograph thin section, (b) MALDI ion intensity image of matrix ion (the lighter the colour the more intense the ion), (c) Ion map of phosphatidylcholine (16:0,16:0), and (d) intensity distribution of heme (m/z 616), the intense (light) areas match the red/brown areas in 1(a).

Results and Discussion

Challenges in MALDI Imaging addressed using Waters MALDI Mass Spectrometers

The nature of the samples being analyzed results in a number of challenges that have to be overcome during the mass spectral analysis. Three of the main factors affecting analysis are the complexity of the sample, the often low abundance of compounds of interest, and the unevenness and/or conductive properties of the sample surface. These challenges and Waters solutions are discussed overleaf.

1. Physical Properties of Tissue Samples

Tissue sections exhibit different physical properties from conventional MALDI samples. Variation in electrical conductivity and sample morphology are observed. In axial MALDI mass spectrometers, such as Tof-Tof systems, the source region, including sample holder and the sample, form part of the time-of-flight system. Therefore, the properties of a tissue sample may result in a reduction of performance of the mass analyzer, leading to a decrease in mass accuracy and mass spectral resolution. This uncertainty carries the risk of incorrectly assigning masses and hence reporting/publishing erroneous results.

The orthogonal acceleration mass analysers used by Waters MALDI Systems do not suffer from this limitation, as the source region does not form part of the mass analyzer and instrument performance is independent of the sample analyzed.

2. Sample Complexity

In order to produce unambiguous ion images, it is important to be able to separate and distinguish the compounds of interest from the complex biological and MALDI matrix background. The MALDI SYNAPT MS and MALDI SYNAPT HDMS systems achieve this by:

Mass accuracy: orthogonal acceleration (oa) Tof technology and external lockmass technology ensure low ppm deviation from theoretical mass, regardless of what type of sample is analyzed.

Mass spectral resolution: oa-Tof technology ensures excellent mass spectral resolution, regardless of sample morphology and electrical conductivity of the surface.

High efficiency quadrupole precursor ion selection: high selectivity MS/MS adds confidence for targeted analysis and improves signal-to-noise ratios. Using a quadrupole for precursor ion selection has distinct advantages over timed ion selectors, as mass selection is completely independent of source conditions, e.g. laser intensity.

Gas phase separation of ions using a MALDI SYNAPT HDMS System: Waters unique HDMS technology enables separation of ions based on their size, shape, and charge using high efficiency ion mobility.

Figure 2. MALDI SYNAPT HDMS System.

3. Abundance of Compound of Interest

Compounds of interest may be difficult to detect due to their presence at low concentration. This problem can be compounded by the sample complexity described previously. Waters MALDI Mass Spectrometers improve the sensitivity of the assay by:

Extended duty cycle techniques: through the use of T-Wave technology, the duty cycle (efficiency) of the oa-ToF mass analyzer can be increased to 100% for all (MALDI SYNAPT HDMS) or part (MALDI SYNAPT MS) of the m/z range.

Targeted MS/MS analysis: a substantial improvement in the signal-to-noise ratio can be achieved when monitoring specific fragment ions from compounds of interest in the MS/MS mode of analysis. A further advantage of this technique is that by monitoring more than one fragment ion, it is possible to validate the distribution of a compound of interest.

MALDI SYNAPT Imaging Workflow

Supported by a number of intuitive software tools, the MALDI imaging workflow on the MALDI SYNAPT HDMS System has been optimized to make the production of High Definition Imaging (HDI) data as easy as possible. The steps involved in this workflow are outlined in Figure 3.

Figure 3. Flow diagram of the MALDI SYNAPT imaging workflow.

1. Sample Preparation

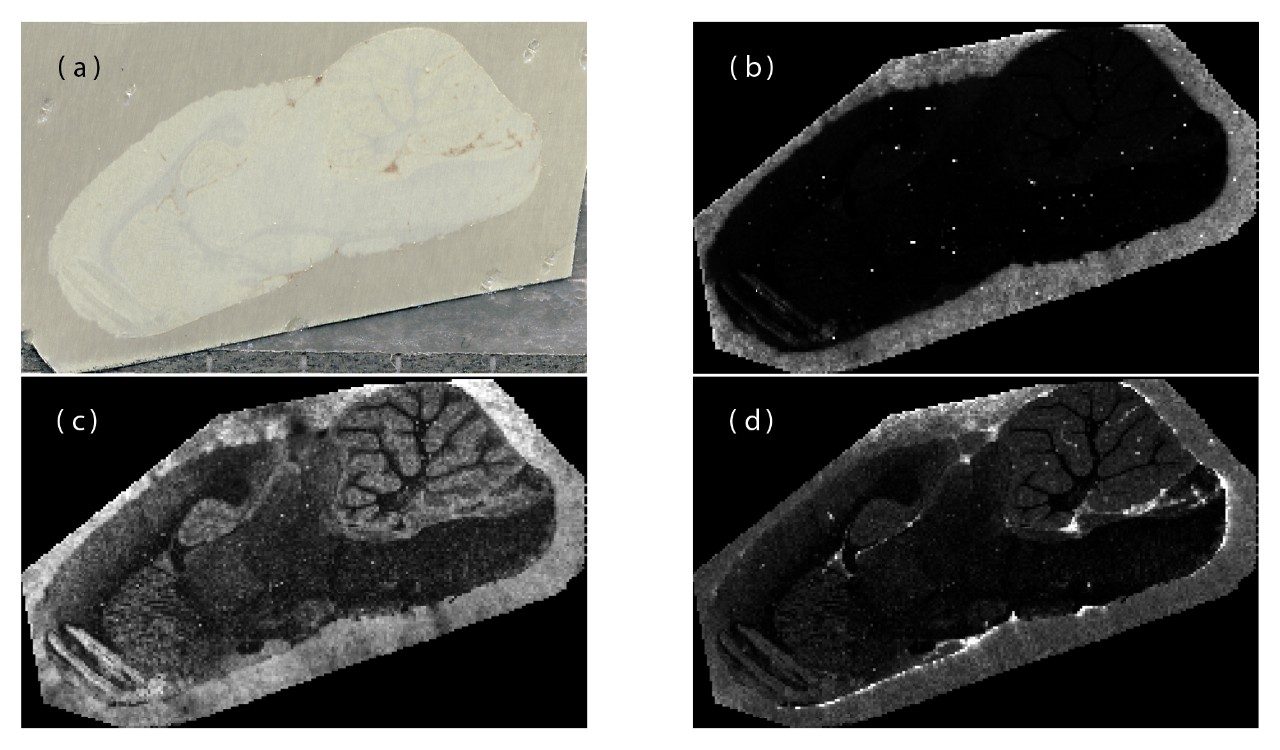
After a thin section has been made using a cryotome, matrix needs to be applied to the tissue. Several methods are available, either manual or automated. Manual methods generally involve spraying matrix solution onto the tissue section using an aerosol sprayer, such as an artist’s airbrush or a chemical sprayer. This type of matrix application is highly effective, relatively low cost, and can give very good quality images. It is, however, dependent on the user’s level of experience and, in most cases, not very reproducible.

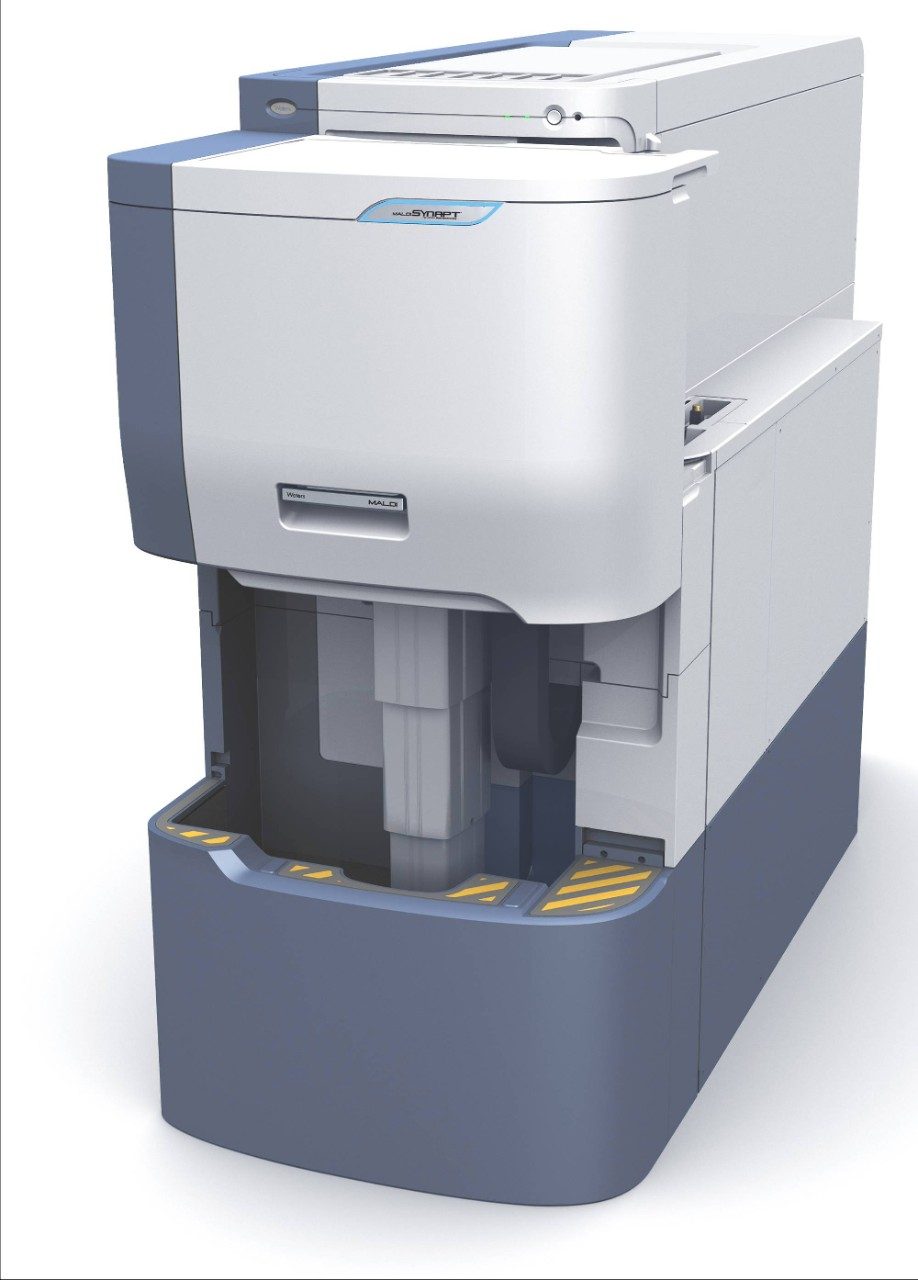
All automated systems are less user-dependent and hence produce more reproducible data. The initial setup cost is high compared to matrix application. Sample preparation devices fall into broadly two categories, sprayers and spotters. Spotters are very reproducible, easy to set up, and can also be used for targeted profiling experiments, as well as multi-reagent spotting cycles, e.g. for on-tissue digestion experiments, enzymes followed by matrix. They are limited in the absolute spatial resolution that can be achieved by the minimum droplet size they can produce, which is typically in the 150 to 250 μm range. Sprayers are not as versatile; these devices act purely as matrix application systems. They can, however, greatly improve reproducibility and are not usually the limiting factor in terms of spatial resolution. Waters imaging system is compatible with all types of sample preparation.

2. Selection of Area for Mass Analysis

It is important to limit the area to be analyzed to the tissue of interest, as this saves a great deal of instrument time, especially for high resolution images. The Waters imaging software simplifies the process, using a digital image of the prepared sample to guide selection of the areas of interest. A screenshot of the imaging selection tool is shown in Figure 4. Area selections are made using a drawing tool, allowing rectangular, elliptical, and free-drawn areas to be selected. Multiple areas can be selected for one experiment. The laser coordinates corresponding to the selected areas are automatically determined at a user definable spatial resolution and then used during data acquisition.

Figure 4. Selection of area of interest prior to MALDI imaging experiment.

3. Automated HDMS or MS Imaging Experiments

Imaging data acquisition is managed from the MassLynx sample list. Scientists can choose between MS, MS/MS, HDMS, and HDMS/MS imaging experiments. Details of these experiments are shown in Table 1.

Table 1. MALDI imaging experiments available on the MALDI SYNAPT HDMS System.

4. Ion Mobility Data Conversion to Imaging Format

After data acquisition in HDMS or HDMS/MS mode, the mobility data can be viewed and mined using DriftScope Software (see Figure 5). A specific m/z and drift-time range can be selected and converted into ion intensity maps. These intensity maps can be imported into BioMap (Novartis, CH) using the MALDI imaging converter software tool.

Figure 5. DriftScope plot of m/z vs drift-time. Data were acquired directly from tissue.

Conclusion

  • MALDI SYNAPT MS Systems enable the production of unambiguous, high resolution images, at low sample abundance, irrespective of sample morphology or electrical conductivity of the sample surface
  • MALDI SYNAPT HDMS Systems uniquely offer the possibility of performing gas phase separation of samples after desorption from tissue, in order to overcome the challenges of sample complexity associated with conventional imaging systems

References

  1. R.M. Caprioli, T.B. Farmer, J. Gile, Anal.Chem., 69, 1997, 4751.

720002511, March 2008

Back To Top Back To Top