Analytical methods are developed at various stages of the drug develoment process for samples of varying complexity. Due to the inherent nature of the method development process, redundant efforts take place across an organization, resulting in a very costly and time-consuming activities. If we can streamline the process by which we develop methods, products can be brought to market faster and in a more cost effective manner.
Many different approaches are typically used to develop chromatographic methods today including trial and error, method/column scouting, and software approaches such as first principles approaches and simplex optimization procedures. All these approaches suffer from the inability to determine complex interactions effects between method variables or measurably consider method robustness during the method development process.
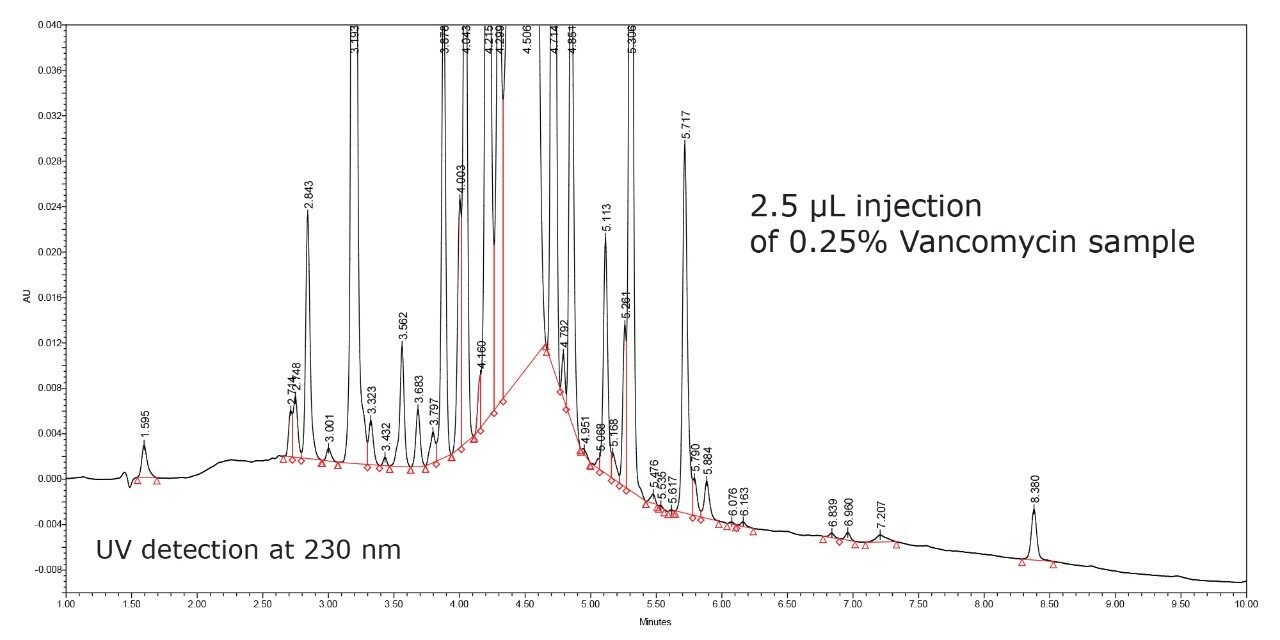
Vancomycin is a tricyclic glycopeptide antibiotic derived from Amycolatopasis orientalis (formerly Nocardia orientalis) and is indicated for the treatment of serious or severe infections caused by susceptible strains of methicillinresistant (beta-lactam-resistant) Staphylococci. Vancomycin is a large molecule (MW 1485.71 daltons) and contains many impurities that are difficult if not impossible to separate. Traditional HPLC gradient methods have shown the ability to separate out as many as 13 of these impurities, while the use of sub-2-μm ACQUITY UPLC Column chromatography has demonstrated the separation of as many as 26 impurities.
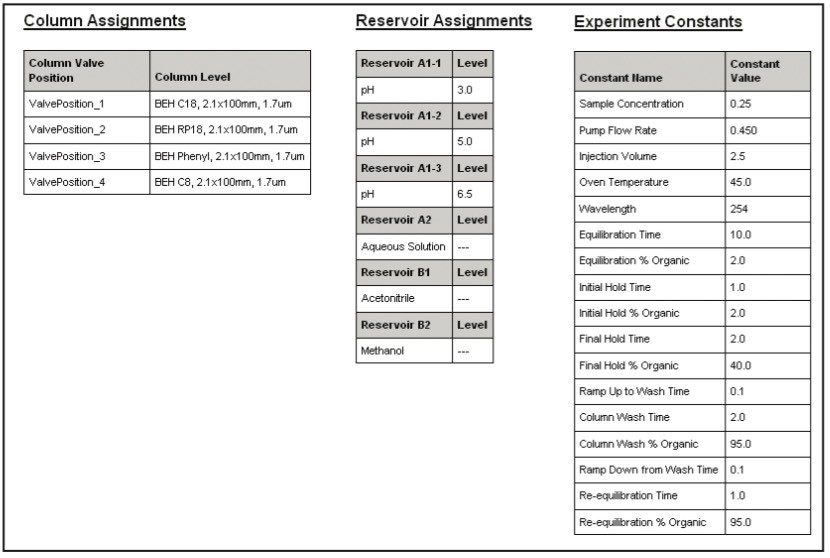
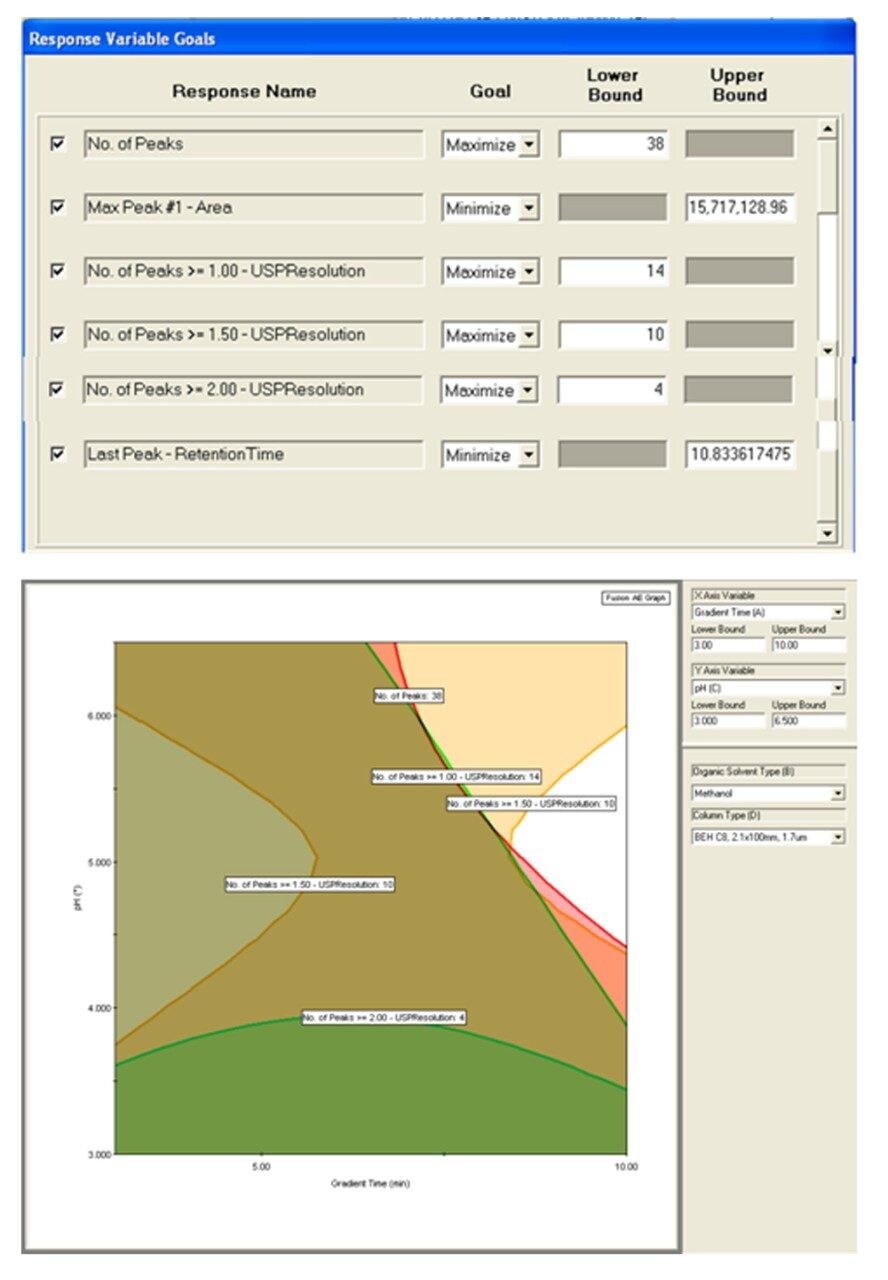
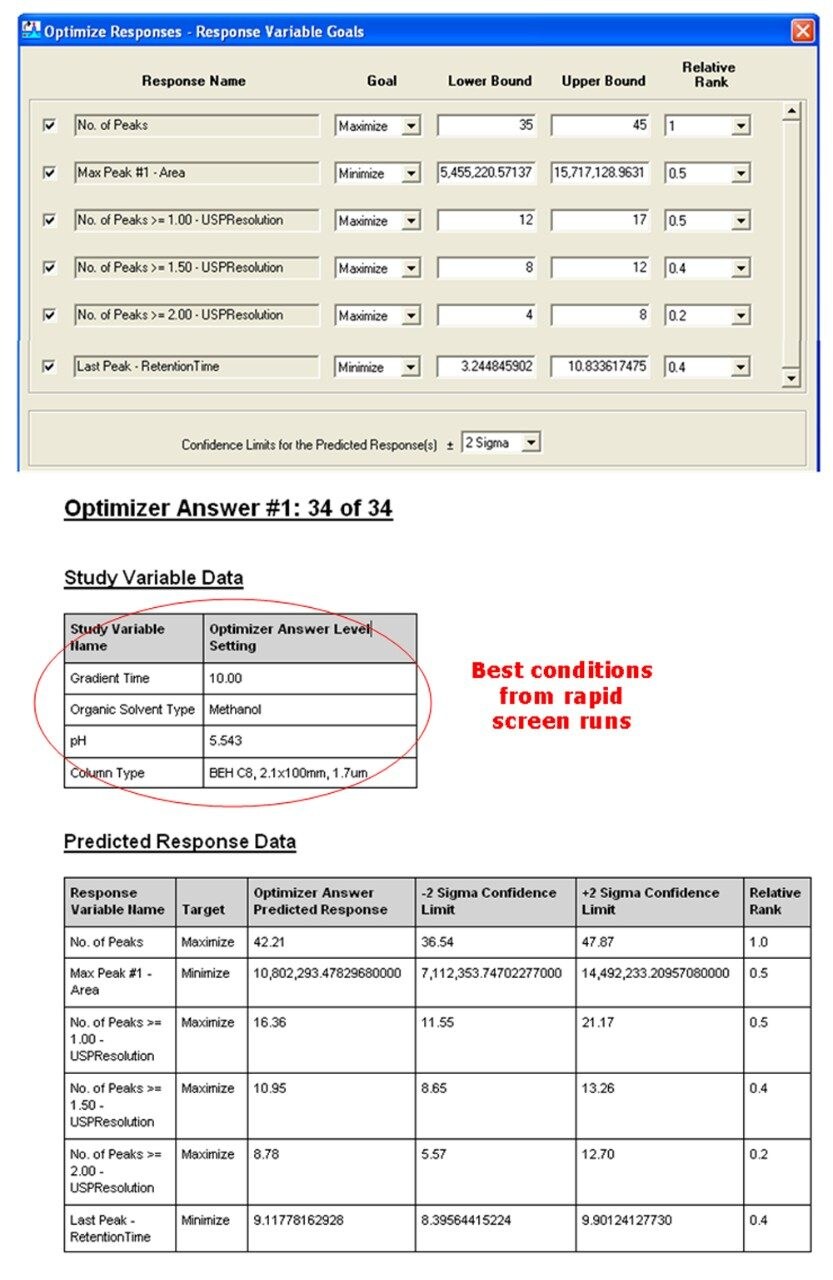
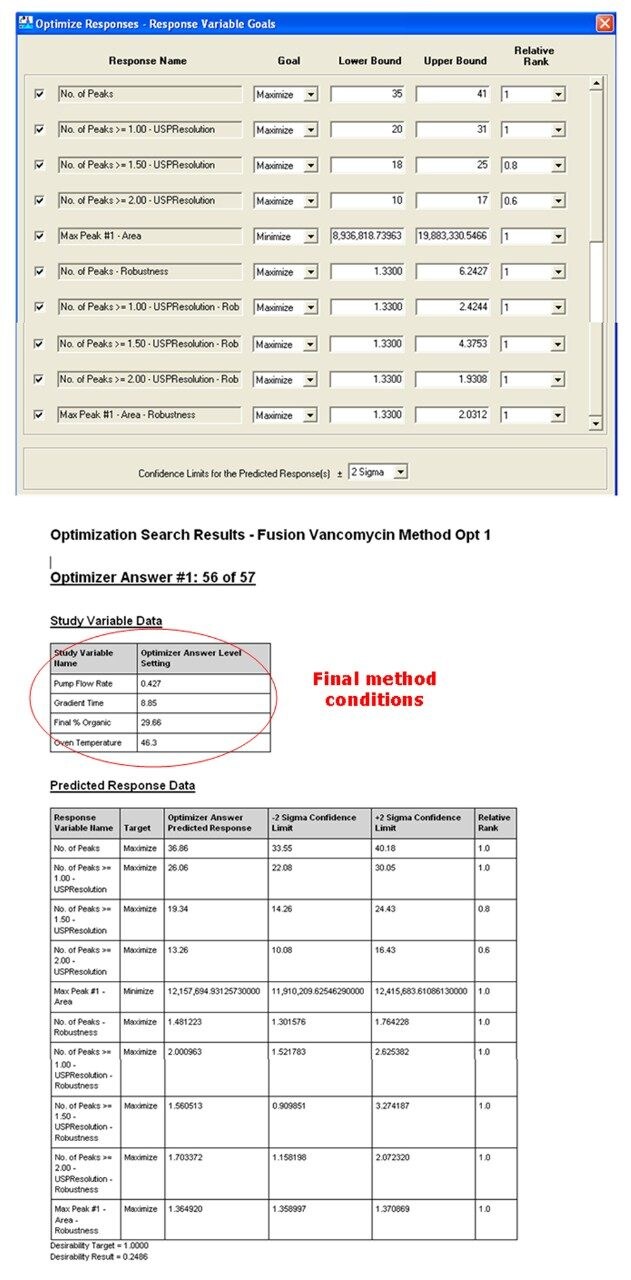
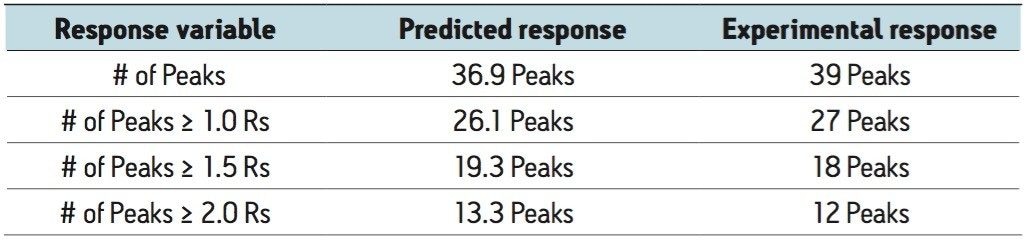
This paper describes a novel method development approach using Quality by Design (QbD) with Design of Experiments to develop a UPLC method for separating 39 impurities in vancomycin resulting in an optimally performing analytical method while simultaneously applying robustness limits to ensure success in final method validation and ultimately in method transfer.