Targeted Analysis of Drugs for Pill Testing Applications
For forensic toxicology use only.
Abstract
A rapid analysis method that leverages the benefits of ACQUITY UPLC H-Class and CSH Column Technology was developed for the analysis of ten drug substances. All ten basic drug substances, including amphetamine and 3,4-methylenedioxymethamphetamine (MDMA), were chromatographically separated in under three minutes and with a total cycle time of 6.3 minutes. The method was developed for both laboratory and field deployment.
The calibration relevant to the method ranged from 0.005 mg/mL to 0.1 mg/mL. Samples were prepared at a concentration of 0.1 mg/mL. The linearity of the calibration curves for all ten drug compounds was observed to be excellent with the coefficient of determination (R2) being ≥0.997. The accuracy of the analysis was excellent at the intended sample concentration (0.1 mg/mL) with the percent recovery for all compounds ranging from 98% to 103%.
Empower Chromatography Data System (CDS) was used to enable quantification of material sourced from music festivals. Library matching was used to improve confidence in compound identification, whilst automated peak purity calculations further increased confidence in quantitation. Lastly, the ACQUITY QDa Mass Detector was employed to demonstrate the significant benefits of mass detection with compounds displaying similar UV spectra.
Benefits
- Rapid UPLC separation of ten drug compounds
- Excellent peak symmetry for basic drug compounds
- Simple acidic MS compatible mobile phases
- Accurate quantification using Empower CDS and peak purity
- High confidence identification using library matching and mass detection
Introduction
Drug and pill testing is a harm reduction measure that aims to reduce the adverse health consequences of drug consumption at music festivals and other settings.1 Pill testing has been conducted in a range of global jurisdictions for decades and seeks to better inform clients of drug contents and provide health advice that can potentially change user behavior.2,3 There have been increasing calls for pill testing at music festivals and other settings.4,5 However, concerns have also been raised that the pill testing methods deployed to the festival environment are often qualitative in nature and cannot provide important information such as drug purity to service clients.
Current targeted LC-PDA analytical methods for the analysis of drug substances typically rely on mobile phase additives such as pyrrolidine at high pH to achieve reasonable peak shape on reversed-phase separation columns. However, there are significant health and safety concerns in deploying these types of methods to the field.
In this application note, a rapid separation and quantification of ten drug compounds is presented that uses ACQUITY UPLC H-Class with PDA and ACQUITY QDa mass detection. Charged Surface Hybrid (CSH) Column technology was used to overcome the challenges of poor peak symmetry and separation while using a common and simple acidic mobile phase composition. Since the mobile phase pH is kept low, electrospray efficiency is maximized allowing effective use of the ACQUITY QDa Mass Detector. The mass spectral data provides additional confirmatory information for improved discrimination among compounds with similar UV spectra and the ability to identify coelutions with confidence. The Empower Software is also leveraged to provide additional confidence in the results by automating the use of Peak Purity, UV spectral library matching, and MS spectral library matching.
Experimental
Standard Preparation
Standards were sourced from the National Measurement Institute (Nth Ryde, Australia) or Tasmanian Alkaloids (Westbury, Australia). Individual standard stock solutions were prepared to a concentration of 1 mg/mL 97% water/3% methanol. These were then combined to produce six mixed standard solutions with concentrations ranging from 0.005 mg/mL to 0.1 mg/mL.
Sample Preparation
A selection of solid drug substances sourced from music festivals were provided under licence by the Australian National University for component identification and purity testing. Samples were prepared with 1 mg of each substance dissolved in 97% water/3% methanol to a final concentration of 0.1 mg/mL. Sample solutions were then filtered (0.2 µm) prior to analysis.
Analytical Method
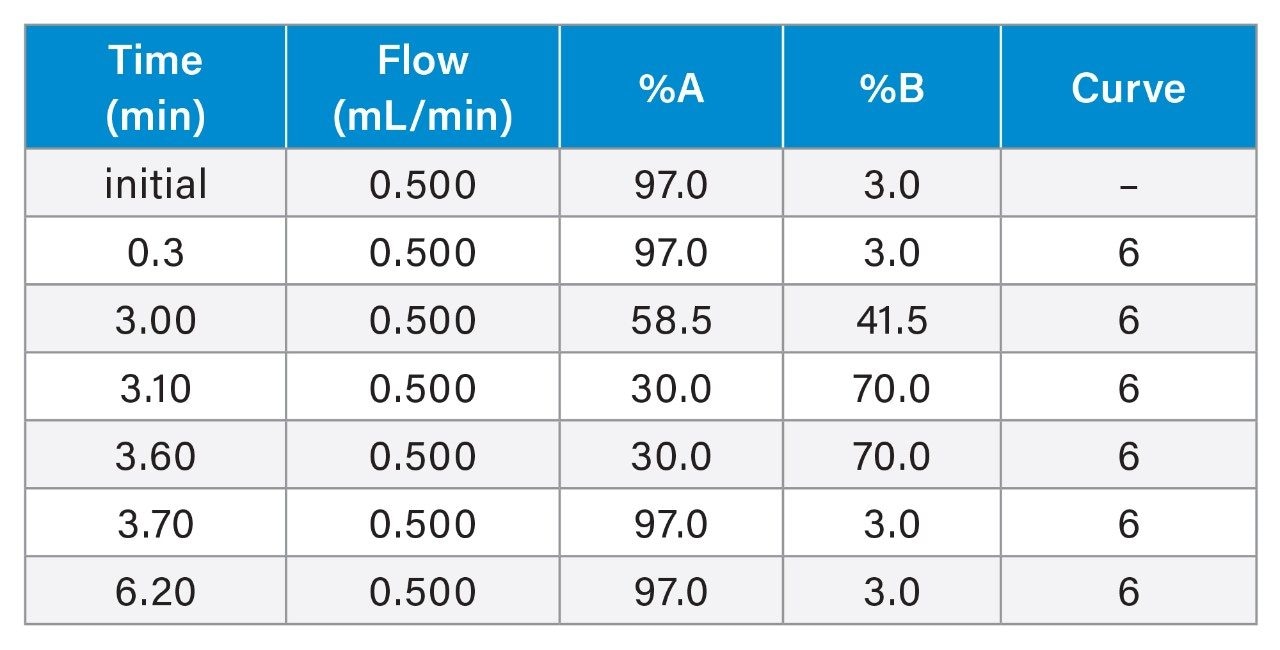
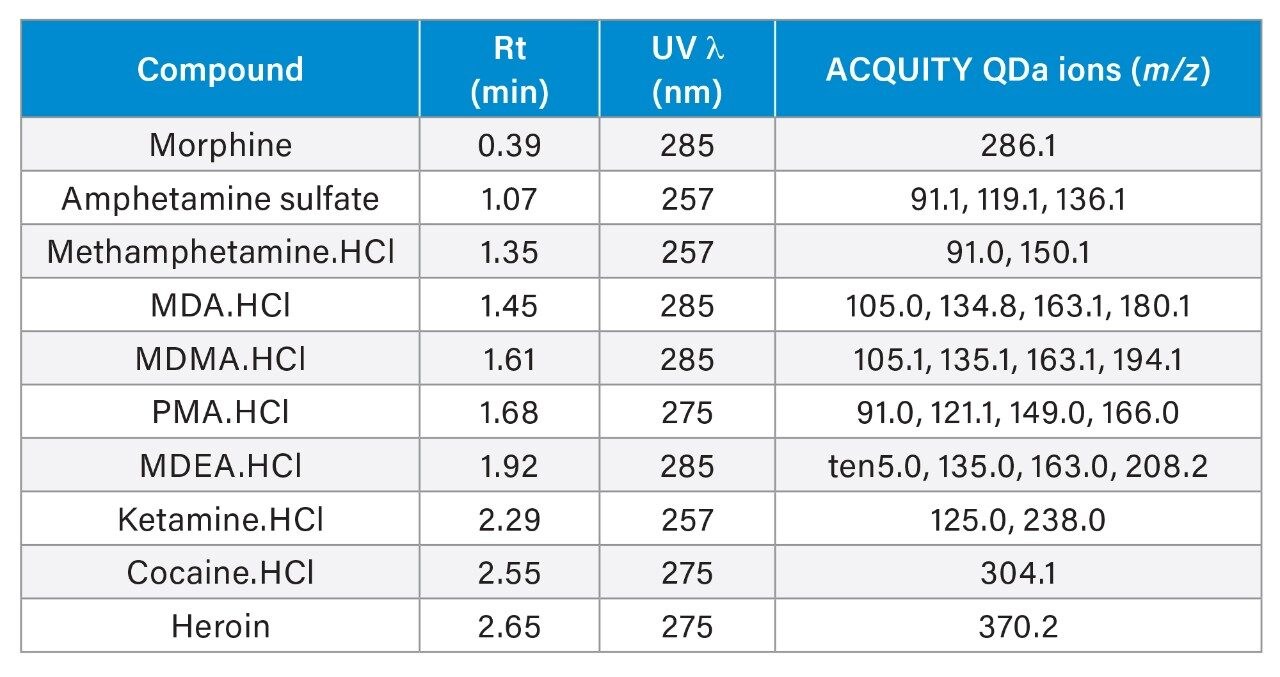
Tables 1 to 4 detail the analytical conditions applied and Table 5 summarizes the specific conditions used for the identification of the ten analytes.
|
LC system: |
ACQUITY UPLC H-Class PLUS |
|
Detection: |
ACQUITY UPLC Photodiode Array (PDA) Detector 210 to 400 nm at 20 points per second |
|
Vials: |
LCMS Certified Clear Vial (p/n: 600000668CV) |
|
Column(s): |
ACQUITY UPLC CSH C18, 50 × 2.1 mm, 1.7 µm (p/n: 186005296) |
|
Column temp.: |
40 °C |
|
Sample temp.: |
12 °C |
|
Injection volume: |
1 µL |
|
Flow rate: |
0.5 mL/minute |
|
Mobile phase A: |
0.1% Formic acid in water |
|
Mobile phase B: |
Methanol |
Table 1. LC Conditions.
|
MS system: |
ACQUITY QDa Mass Detector |
|
Ionization mode: |
ESI+ |
|
Acquisition range: |
50 to 600 Da |
|
Capillary voltage: |
1 |
|
Cone voltage: |
10 V |
Table 3. ACQUITY QDa Mass Detector settings.
|
Chromatography software: |
Empower 3 CDS |
|
MS software: |
Empower 3 CDS |
|
Informatics: |
Empower 3 CDS |
Table 4. Data Management.
Results and Discussion
UPLC-PDA
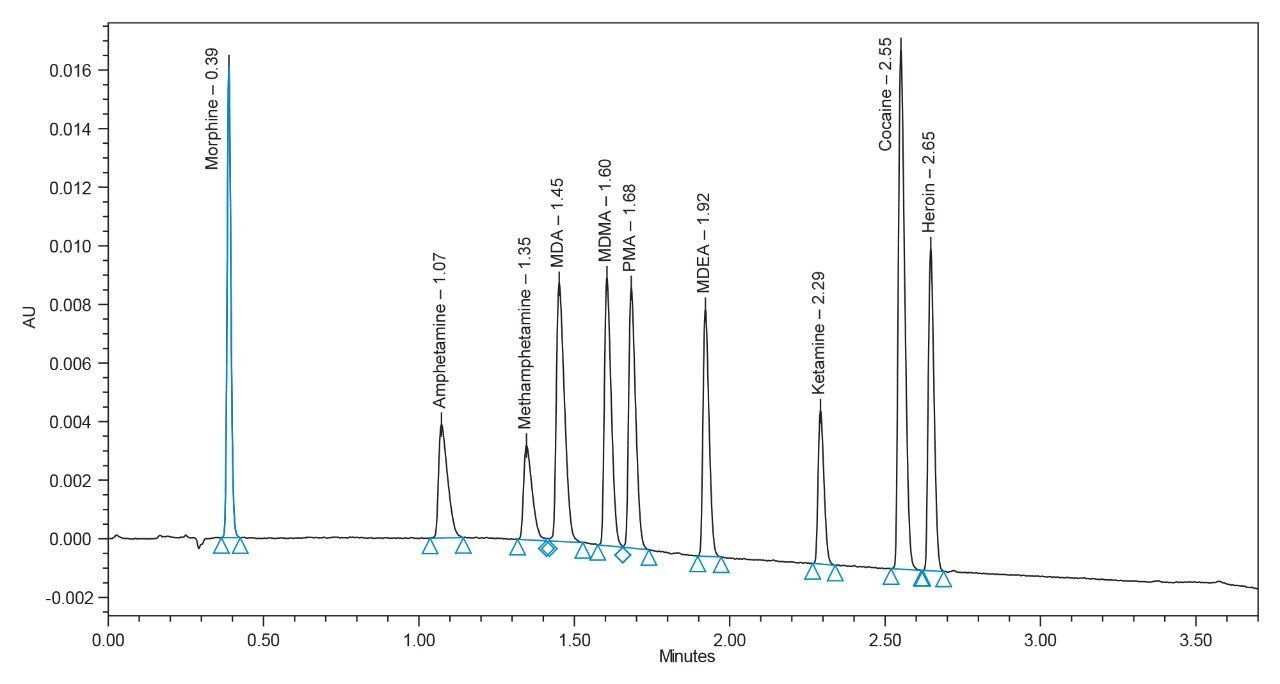
The developed separation for the ten drug substances is presented in Figure 1. All components are labelled in this chromatogram for convenience. As seen, all ten components are baseline-separated and elute in under three minutes.
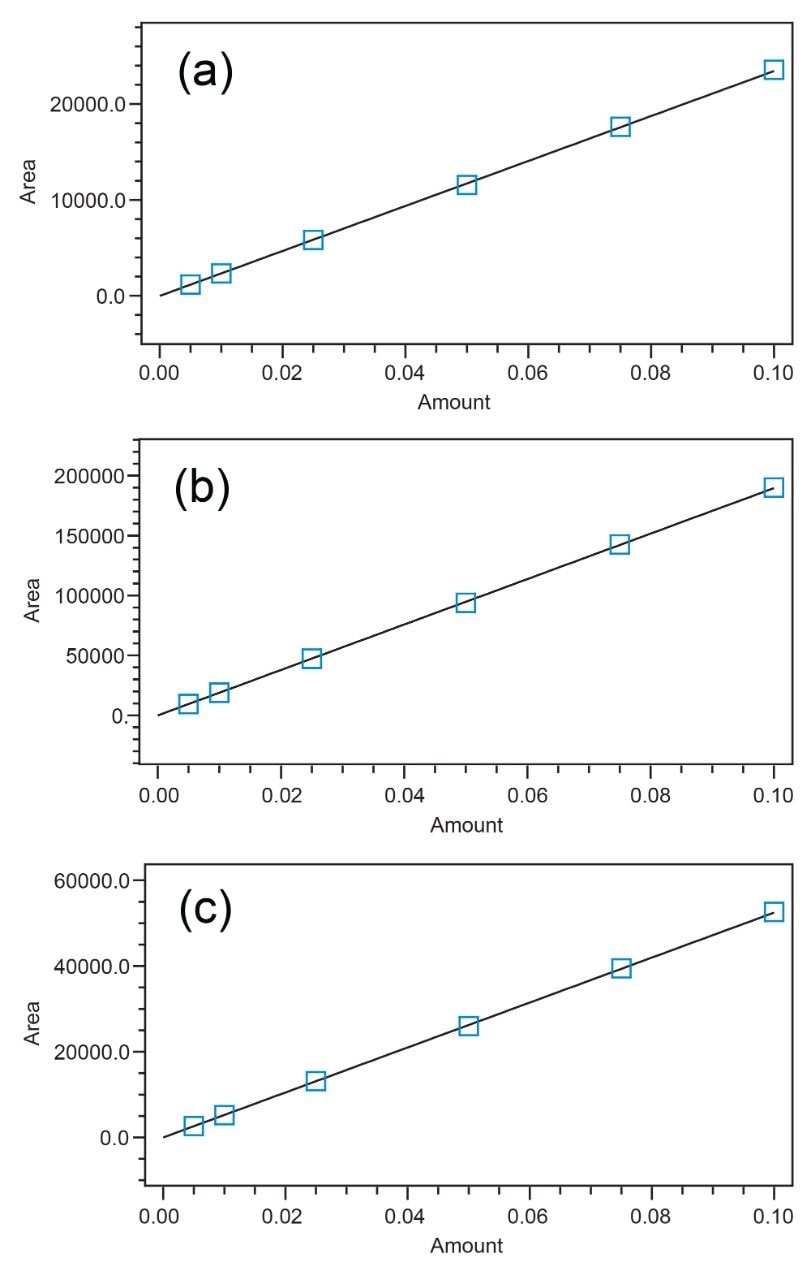
The calibration curves of the ten targeted drugs were also evaluated. A linear fit with 1/x weighting was applied. The results are presented in Table 6 below and demonstrate excellent linearity with coefficients of determination being ≥0.997 for all compounds. Example calibration curves are presented in Figure 2.
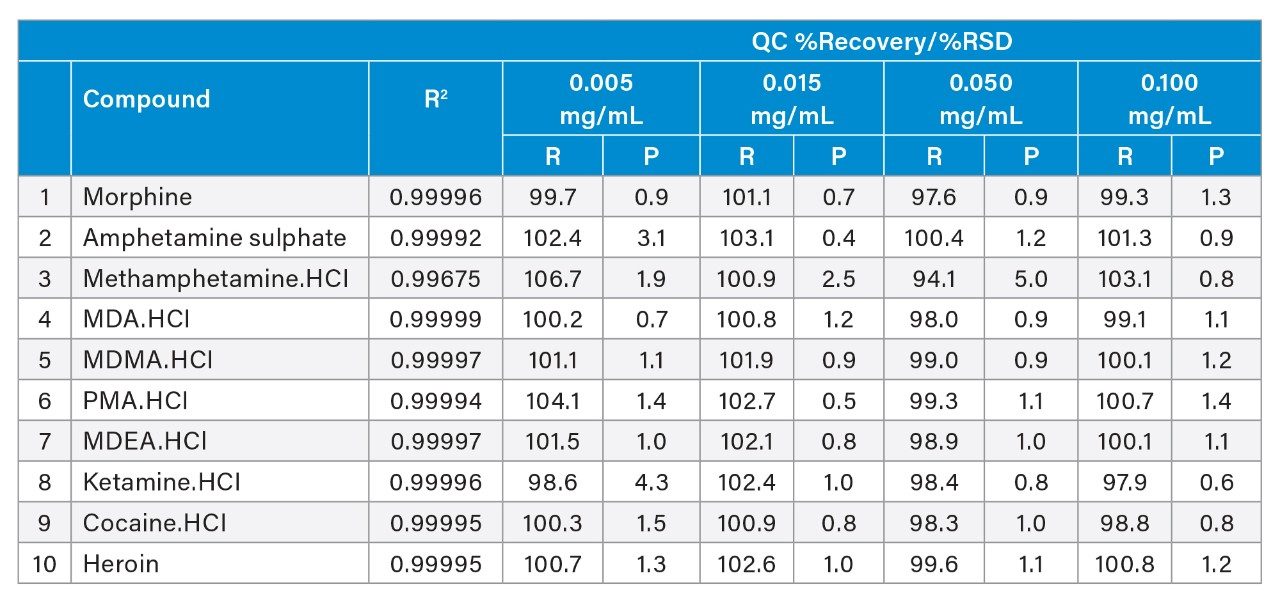
Four QC standards were prepared to assess the percent recovery of the ten components in the quantitative assay. However, based upon the application, because each sample was prepared to a concentration of 0.1 mg/mL, the quantitative amount would be expected to generally approach the upper limit. Table 6 shows that the average percent recovery, from four separate analyses, of the 0.1 mg/mL QC standard ranged from 97.9% to 103.1% which demonstrates good quantitative accuracy. Additionally, the precision of those measurements was excellent, and the percent RSDs ranged from 0.6% to 1.4%. Lower concentrations also provide acceptable accuracy.
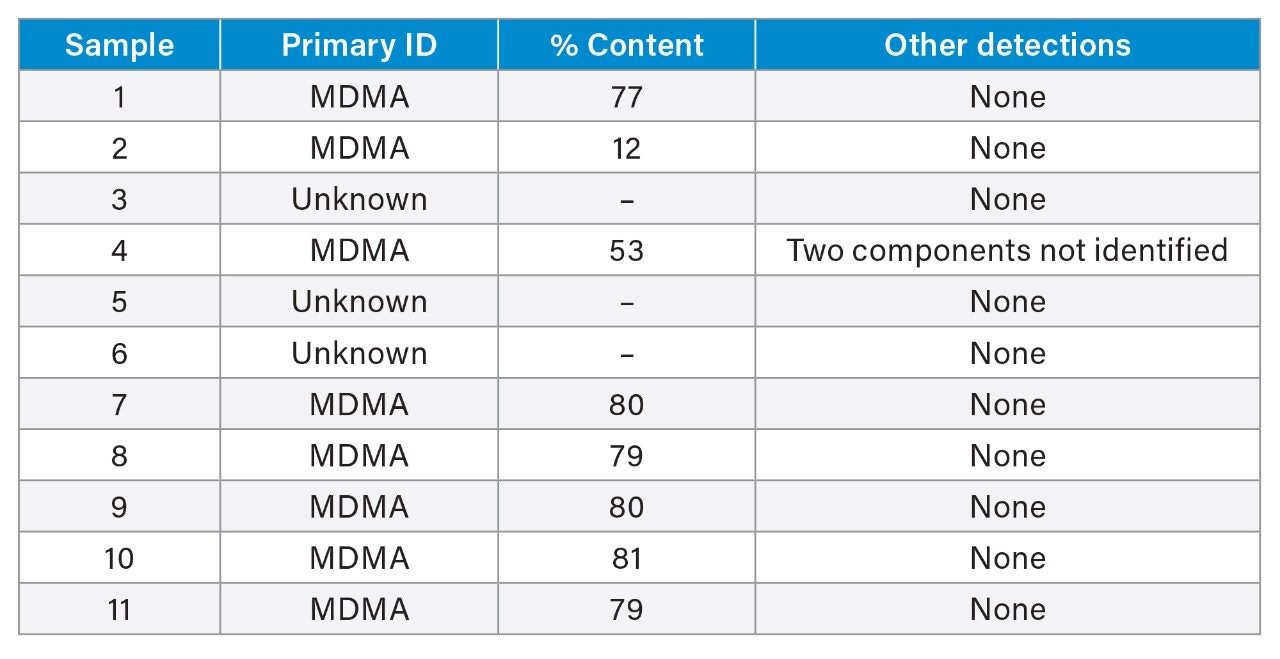
To evaluate performance of the developed method, eleven samples sourced from music festivals were investigated. These are presented in Table 7 below. As noted above, one milligram of an unknown sample is prepared to a concentration of 0.1 mg/mL; a test result of 0.1 mg/mL is equivalent to a drug purity of 100% as the hydrochloride salt or 84% as the corresponding free base. As the salt form of music festival samples is not known, the % content of MDMA is presented as the free base below. MDMA was identified to be the principle component of seven of the submitted samples and a minor component of one. This includes Samples 7–10 representing four separate samples from the same source or location, and Sample 11, which were all provided by clients attending emergency services for treatment. Three samples comprised of substances outside of the test panel, with Samples 3 and 5 identified as N-ethyl butylone and Sample 6 as N-ethyl pentylone by FTIR testing methods.
UV spectrum matching was employed to increase confidence in component identification. This is done to minimize false positive determinations for components that have similar retention times as those in the target list. An example PDA Match Plot is presented in Figure 3 that shows the comparison of a sample spectrum against a PDA library spectrum. The PDA Library Match Results Table shown in Figure 3 presents the results of the spectrum contrast evaluation. In this instance, the spectral difference, represented by the PDA Match Angle (0.065) was significantly less than the PDA Match Threshold (1.088). This indicates that the sample spectrum is statistically similar to the library spectrum.
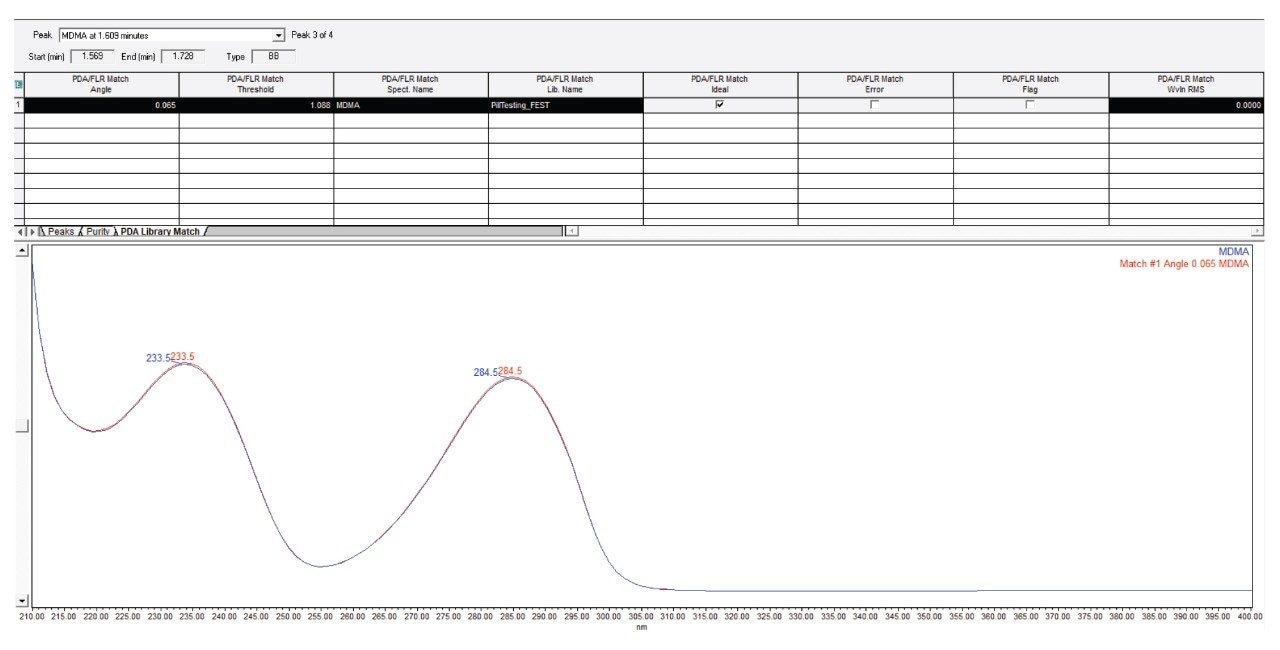
It is noted that the UV spectra of some components are almost identical, consequently, retention time filtering is required during the UV library matching process. Examples include both amphetamine and methamphetamine.
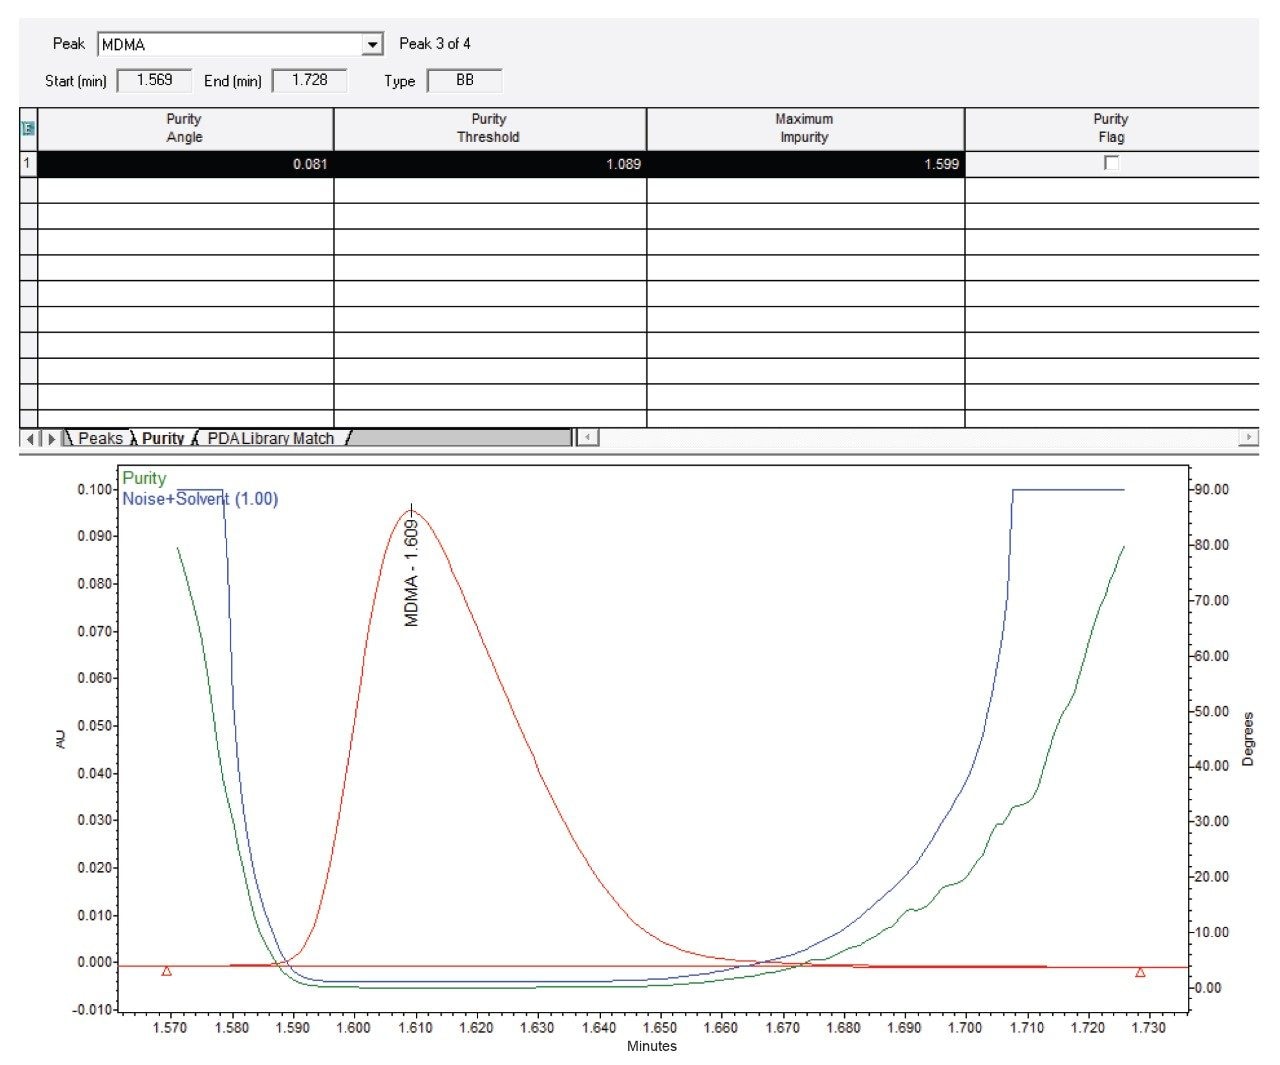
Peak purity was also employed to improve confidence in the accuracy of the quantitative result. An example of a peak purity assessment on a sample peak is presented in Figure 4 where the Purity Angle remained below the Purity Threshold across the whole peak width. This result indicates that there were no identifiable coelutions.
Reported examples are presented in Figure 5 for Sample 1 and 4. Figure 5(a) shows that Sample 1 is positive for MDMA at 0.092 mg/mL or 92% as the hydrochloride salt, or 77% as free base. The retention time is a match, the library match identifies MDMA in the LIBRARY MATCH ID column with the match quality categorized as a GOOD MATCH in the MATCHQUALITY column. The peak purity analysis has assessed the MDMA peak as being spectroscopically pure with no identifiable coelutions in the PEAKPURITY column.
Figure 5b shows a second example (Sample 4) where MDMA was identified as being present at approximately 0.063 mg/mL (63% as the hydrochloride, 53% free base). Ketamine was proposed based on retention time, but the peak was not matched in the library indicating that this component is not ketamine. By difference this seized drug substance is then 53% MDMA (free base) with a significant unknown component. The unknown component at 2.253 minutes is likely to have a different UV molar absorptivity to that of ketamine and presents a meaningless quantified amount.
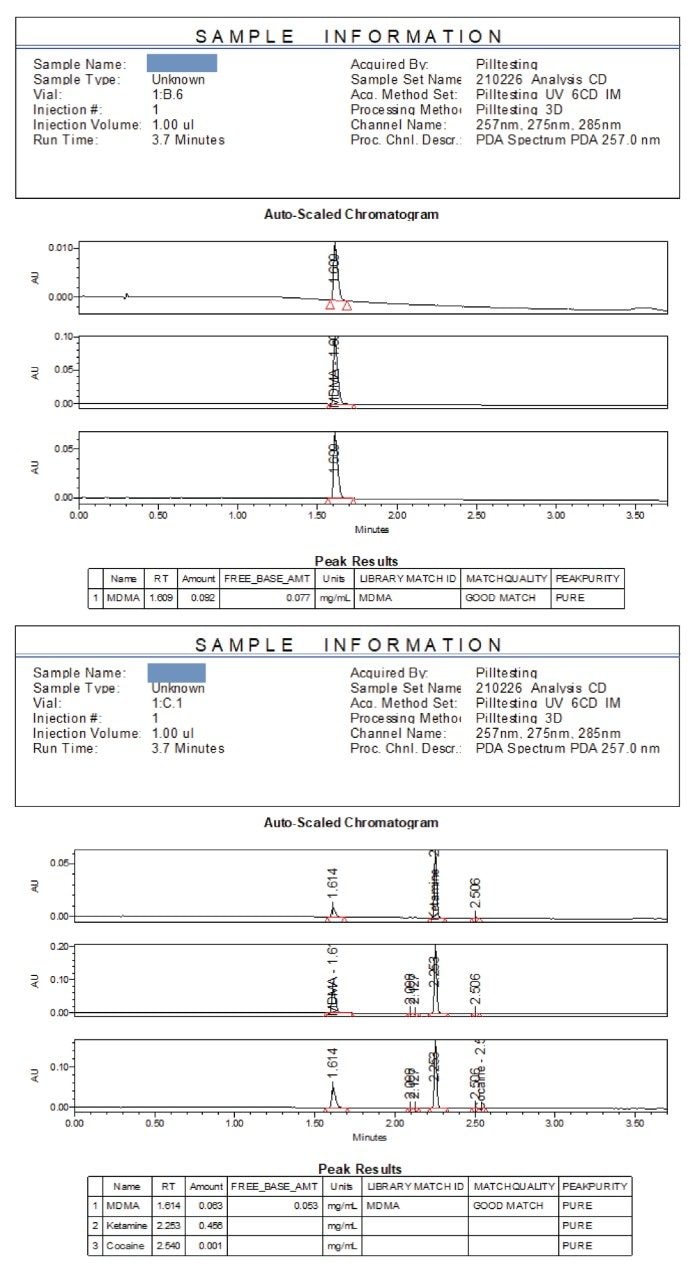
This type of information would be invaluable in a pill testing setting. It provides risk-based information to the person submitting the substance that, in addition to the major component MDMA, a substantial amount of an unknown substance is contained within the sample.
ACQUITY QDa for enhanced confidence in identification
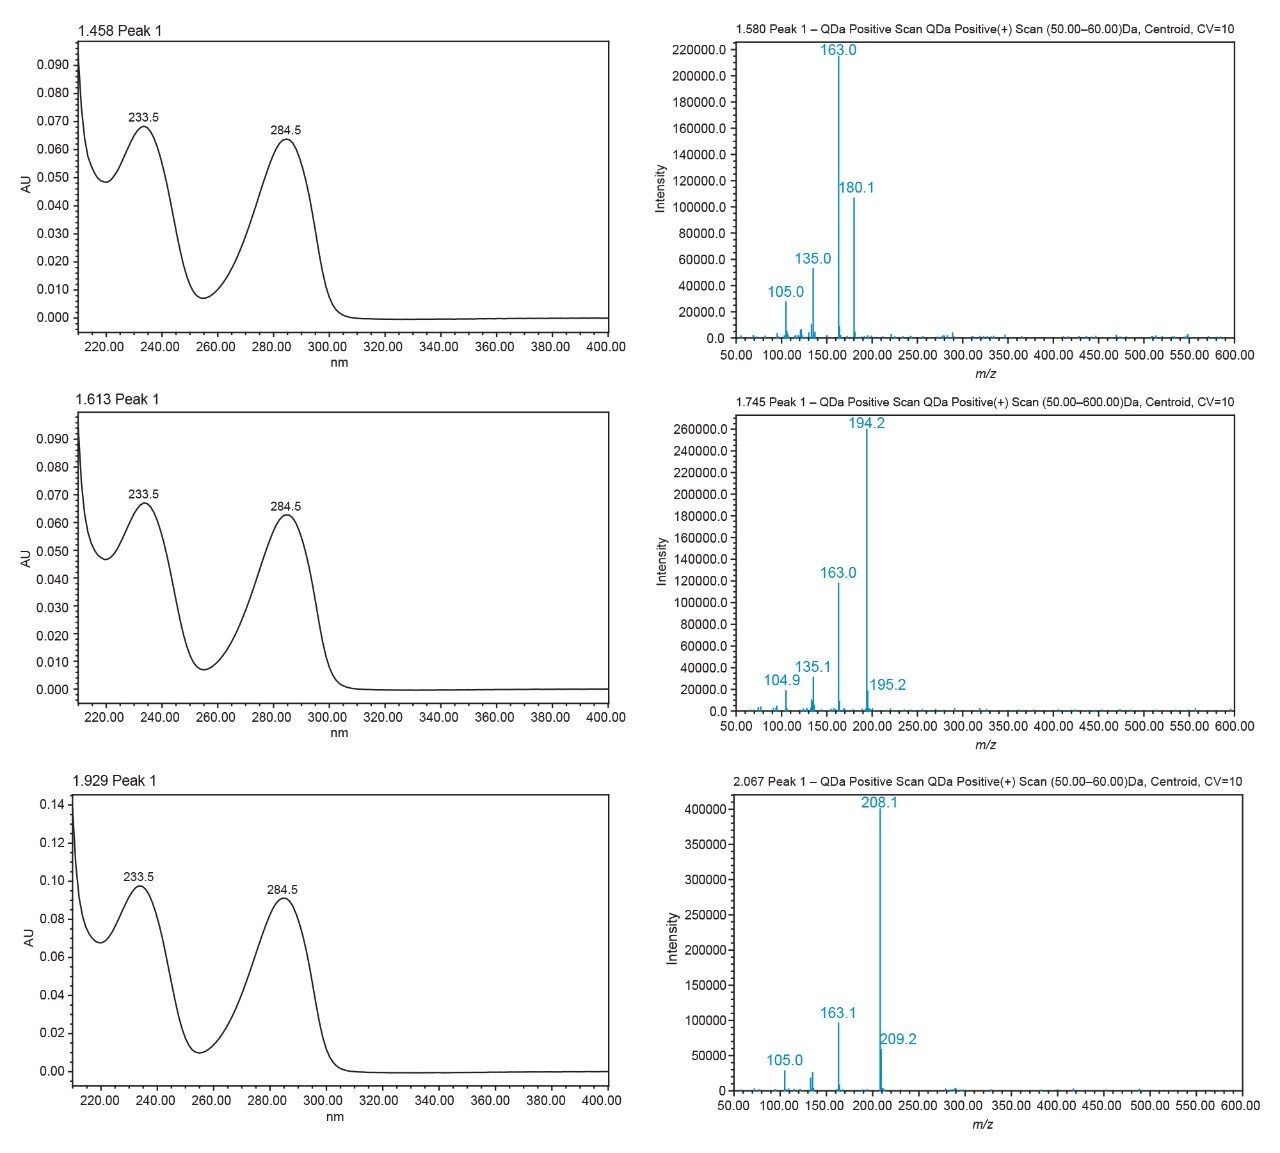
Adding mass detection to the analysis provides a significant boost in compound discrimination, especially in the context that some of the compounds included in the target list have very similar UV spectra. Figure 6 compares the UV and ACQUITY QDa spectra of MDA, MDMA, and MDEA as examples. Each of these compounds show near identical UV spectra but the ACQUITY QDa mass spectra are significantly different and present a unique mass-based fingerprint for each molecule. These stark differences in spectra clearly provide significant information in addition to retention time and UV spectra. Library matching of the mass spectra can be automated in the same fashion as the UV spectra.
Although not the focus of this study, the ACQUITY QDa may also be used for quantification providing significant gains in sensitivity and selectivity over UV detection. Potentially, this would allow the analysis to require less sample for analysis.
Conclusion
- The ACQUITY UPLC H-Class with PDA and ACQUITY QDa is demonstrated to provide an ideal solution for the rapid quantification of ten targeted drug substances.
- The UPLC cycle time is 6.2 minutes allowing for fast analysis.
- Standard Curve linearity was demonstrated to be excellent with R2 values being ≥0.997.
- Both PDA and ACQUITY QDa spectra provide additional information that improves confidence in component identification.
- Use of the ACQUITY QDa allows end users to take advantage of cost-effective mass detection to distinguish between components with highly similar UV spectra.
References
- https://www.health.act.gov.au/about-our-health-system/population-health/pill-testing.
- Moller J., Jones, A. Pill-Testing as a Harm Reduction Strategy: Time to Have the Conversation. Med. J Aust 2019; 211: 10; https://doi.org/10.5694/mja2.50385.
- Groves A. ‘Worth the Test?’ Pragmatism, Pill Testing and Drug Policy in Australia. Harm Reduct J 2018; 15: 12; https://doi.org/10.1186/s12954-018-0216-z.
- https://www.coronerscourt.vic.gov.au/coroner-calls-urgent-drug-testing-services-victoria.
- https://coroners.nsw.gov.au/coronerscourt/download.html/documents/findings/2019/Music_Festival_Redacted_findings_in_the_joint_inquest_into_deaths_arising_at_music_festivals_.pdf.
Acknowledgements
We wish to acknowledge Assoc. Prof. Malcolm McLeod, Mr Patrick Yates, and Mr Christopher Fitzgerald of the Australian National University for their invaluable assistance in this work. Assoc. Prof. McLeod serves as scientific advisor to Pill Testing Australia.
720007435, December 2021