• 應用手冊

The Use of Parallel LC-MS/MS with Automated Optimization to Increase Throughput for the Quantification of Incubated Drug Candidate Samples

The Use of Parallel LC-MS/MS with Automated Optimization to Increase Throughput for the Quantification of Incubated Drug Candidate Samples

  • Tabisam Khan
  • Kendon S. Graham
  • Paul Courtney
  • Richard Weaver
  • Waters Corporation
  • AstraZeneca

For research use only. Not for use in diagnostic procedures.

Abstract

This application note will demonstrate the use of the Waters Micromass Quattro micro with MUX-technology and QuanOptimize together with multi-pump control (four Waters 1525 μ binary pumps) in the analysis of incubated samples in order to increase throughput for quantitative ADME studies in drug discovery. 

Here we present a multiplexed electrospray ionization source interfaced to a tandem quadrupole mass spectrometer. The system is set up in such a way as to automatically generate compound optimization and integration parameters using QuanOptimize. 

This resulted in the generation of intrinsic clearance plots for 76 drug candidates.

Introduction

High throughput quantification is an essential aspect of the drug discovery process. The demands on instrumentation and the chemist are growing at a rapid pace. There is a need to perform rapid quantitative measurements for early determination of ADME properties. This information is then used to determine which of the drug candidates will progress to the development stage. The fail fast strategy is essential to prevent unnecessary work on compounds that do not fit the criteria. In this paper we meet the challenge of fast and efficient turnaround of multiple samples. 

The main bottleneck was the ability to produce samples quickly enough for analysis. With the advent of multiple robotic sample production, the bottleneck moves from preparation to the analytical stage. Since there are still many drugs, to characterize at this stage of the development process the optimization and quantification can be a time-consuming process. In order to ascertain the correct MRM transitions, looking at the precursor ion (or an adduct) and then obtaining a suitable product ion with the correct cone voltage and collision energy can take an experienced mass spectroscopist a long time. With QuanOptimze, an automatic method development and quantification tool, samples can be efficiently analyzed in two stages.

Firstly, each compound can be optimized to generate a multiple reaction monitoring experiment, where the product and precursor (with cone voltage and collision energies) ions are defined, in a run time of approximately 1 minute. Secondly, using generic HPLC fast gradients a quantification method can be produced. The whole procedure for a single compound can take as little as 2 minutes to turn around. With the addition of multiple parallel sprayers, MUX-technology, interface and sample grouping the throughput can be boosted by a factor of four. With the introduction of 4 LC systems, under full MassLynx v4.0 Software control, parallel chromatography using a 4 injection module (Waters 2777 Sample Manager) with 4 matched LC columns linked directly to a MUX source we can easily adapt to the vast number of samples being generated. 

In this paper we analyzed 76 individual compounds and 5 time points for each compound (a total of 380 samples) in two hours. The compounds were incubated with rat hepatacytes with sampling time points at 8, 20, 41, 58, and 73 minutes that were extracted in methanol.

Waters Micromass Quattro micro Mass Spectrometer.

Experimental

Figure 1 shows independent LC pumps controlled under MassLynx v4.0 delivering independent gradients to four separate analytical columns into a 4-way MUX-technology equipped tandem mass spectrometer. The individual pumps are controlled under MassLynx v4.0 with serial connections via IEEE cables. Figure 2, 3, and 4 configuration of MassLynx v4.0 for QuanOptimize-MUX and Four LC Control.

Figure 1. A schematic representation of QuanOptimize-MUX-Quattro micro with 4 LC Control.
Figure 2. QuanOptimize Method Editor.
Figure 3. QuanOptimize Enabled MUX.
Figure 4. Configuration of Multiple LC Pumps.

Figure 2 shows the method editor for QuanOptimize. Under MassLynx v4.0 control, the automatic generation of an MS method and the subsequent analytical method can be run using this configuration. Figure 3 then highlights the configuration of the multiplexed electrospray interface (MUX) with randomized sample collection from the autosampler. Finally in Figure 5, the number of probes available in the MUX settings is defined. Also, random bottle locations in the sample list and the number of LC inlets are defined.

Figure 5. QuanOptimize analytical sample list for incubated samples.

Sample Preparation

Standards for automated tuning by QuanOptimize were provided by AstraZeneca. These consisted of 76 compounds grouped into fours, diluted to approximately 5 μgm/mL in methanol, resulting in 19 different sample groups. 

AstraZeneca provided samples from hepacyte incubations at 5 different time points, in sets of six per sample group. The samples were incubated at time intervals of 8, 20, 41, 58, and 73 minutes and when the samples were taken they were quenched with methanol (2:1) to stop further metabolism.

LC Conditions

Column:

4 Waters Xterra MS C18, 3.5 µm, 3 x 20 mm

Mobile phase A:

(0.1% formic acid) acetonitrile

Mobile phase B:

(0.1% formic acid) water

Flow rate:

1.5 mL/min, post column split to generate 60 µL/min into each spray

Injection volume:

5 µL

Solvent delivery:

4 Waters 1525 µ binary gradient pumps

Autosampler:

Waters 2777, four injection valves, diluter option

Gradient

Time(min)

%A

0

100

0.3

0

1.0

0

1.2

100

MS Conditions

MS: Quattro micro

Polarity:

ES+

Capillary(kV):

3.5

Cone(V):

35

Cone gas flow(L/Hr):

62

Desolvation gas flow(L/Hr):

671

Peak width at half height:

0.7 Da

LM 1 resolution:

14.0

HM 1 resolution:

14.0

Peak width at half height:

0.7 Da

LM 2 Resolution:

14.0

HM 2 Resolution:

14.0

Gas cell pirani pressure(mbar):

5.74e-3

Results and Discussion

1. MS Data Acquisition Settings

Table 1 shows the fully optimized product and precursor ion with the correct cone voltage and collision energy. These transitions are then automatically placed into a MS Method editor and the quantification assay is then run. The results from the quantification are discussed in the result section. 

Table 1. Automatic generation of MRM transitions by QuanOptimize.

The correlation between the MRM transition obtained by QuanOptimize-MUX and by single spray was excellent. Each compound was correctly assigned the precursor and product ion as well as the correct cone voltage and collision energy. The dwell time was automatically set from the software to take into account the amount of MRM transitions per sample group and provide sufficient data points (30 points per dalton) across a chromatographic peak to allow accurate peak integration.

2. Analysis and Intrinsic clearance plots

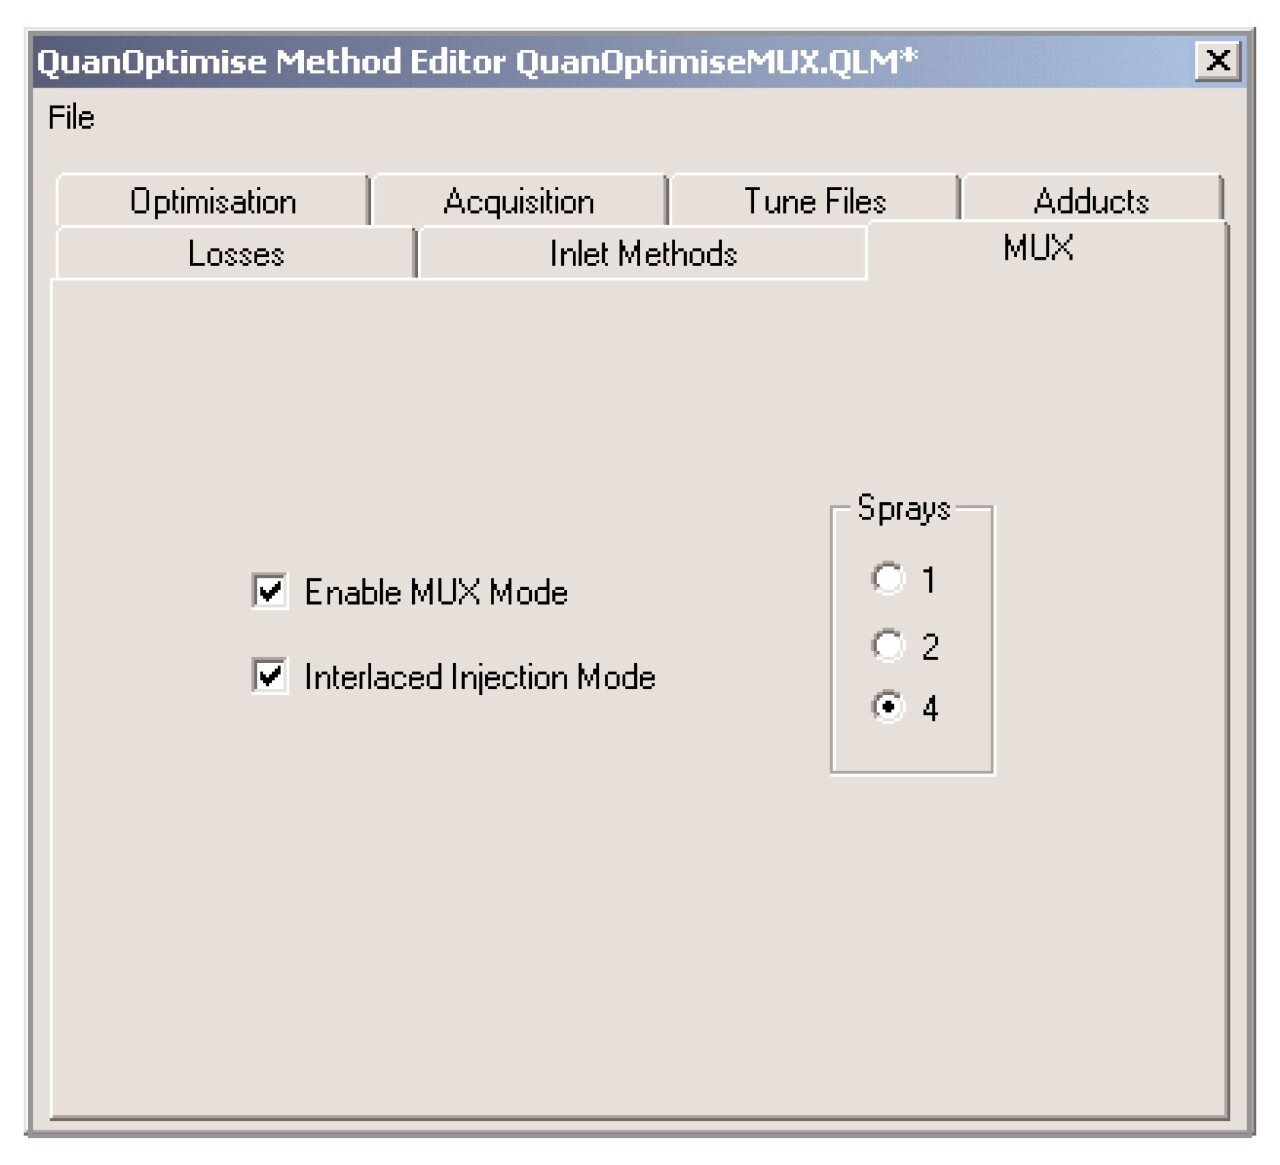
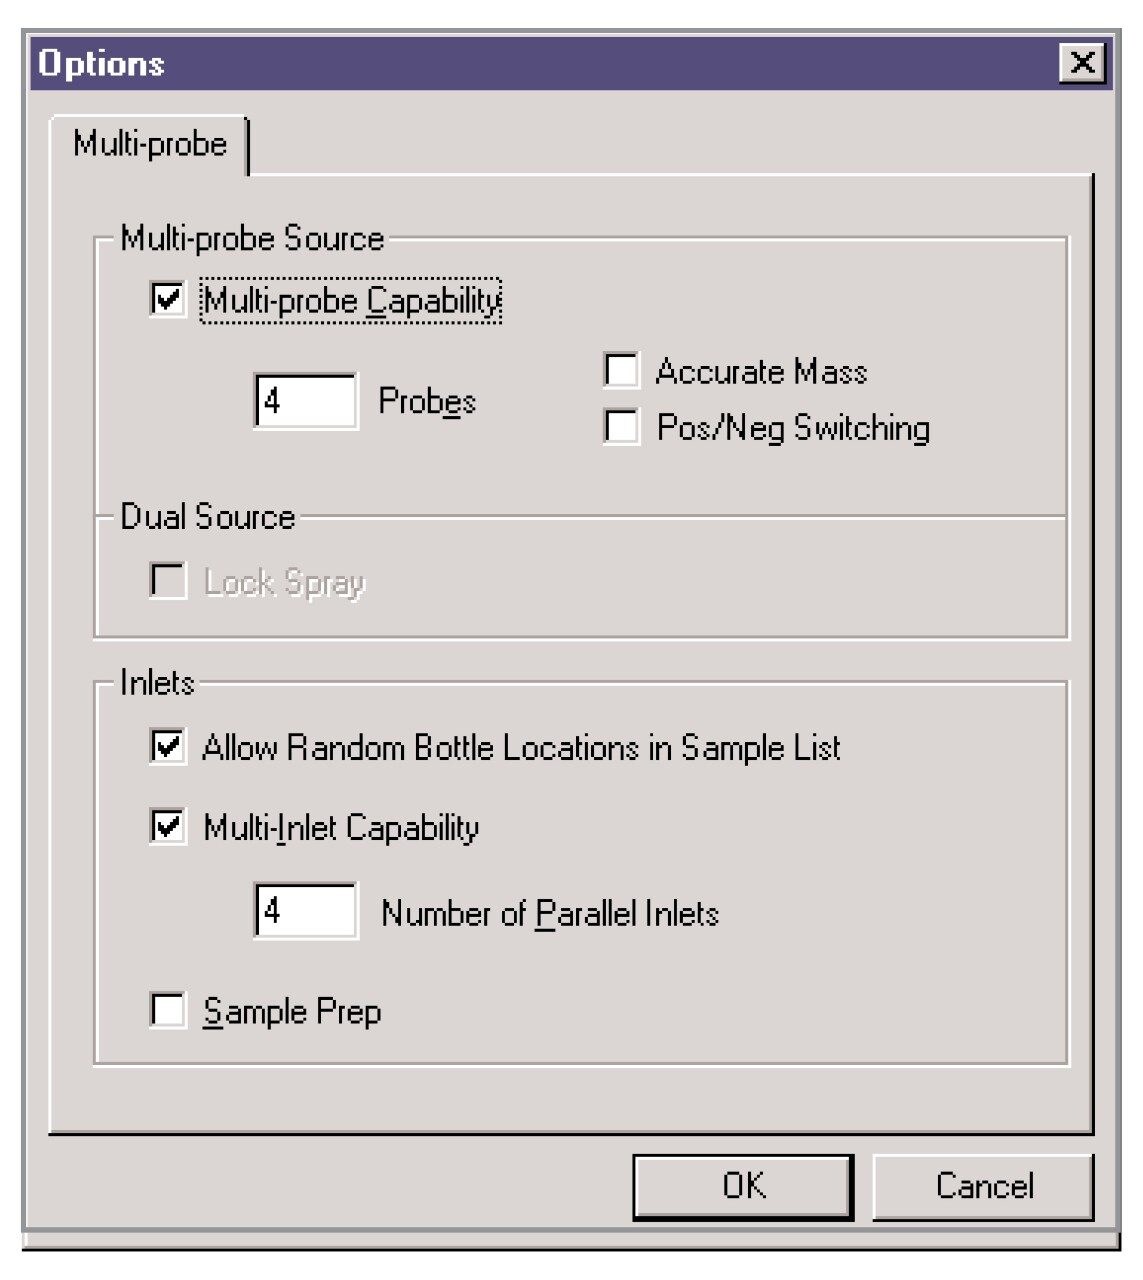
The samples were run in accordance to the group numbers with each group containing four compounds. The final group consisted of a dummy run in order to make the sample list a divisible factor of four as the running of the MUX source with QuanOptimize makes this necessary. 

The results for the optimization can be seen in the Results 1 section. Where sample was a low volume (insufficient for injections), the MS transitions obtained by AstraZeneca were used as the sample well plate had already been run at AstraZeneca and repeated at Waters Micromass. This allowed the running of all the samples in the 96-well plate. The samples were then ready for the analytical stage where the retention time would be calculated and the chromatograms integrated automatically using QuanOptimize. 

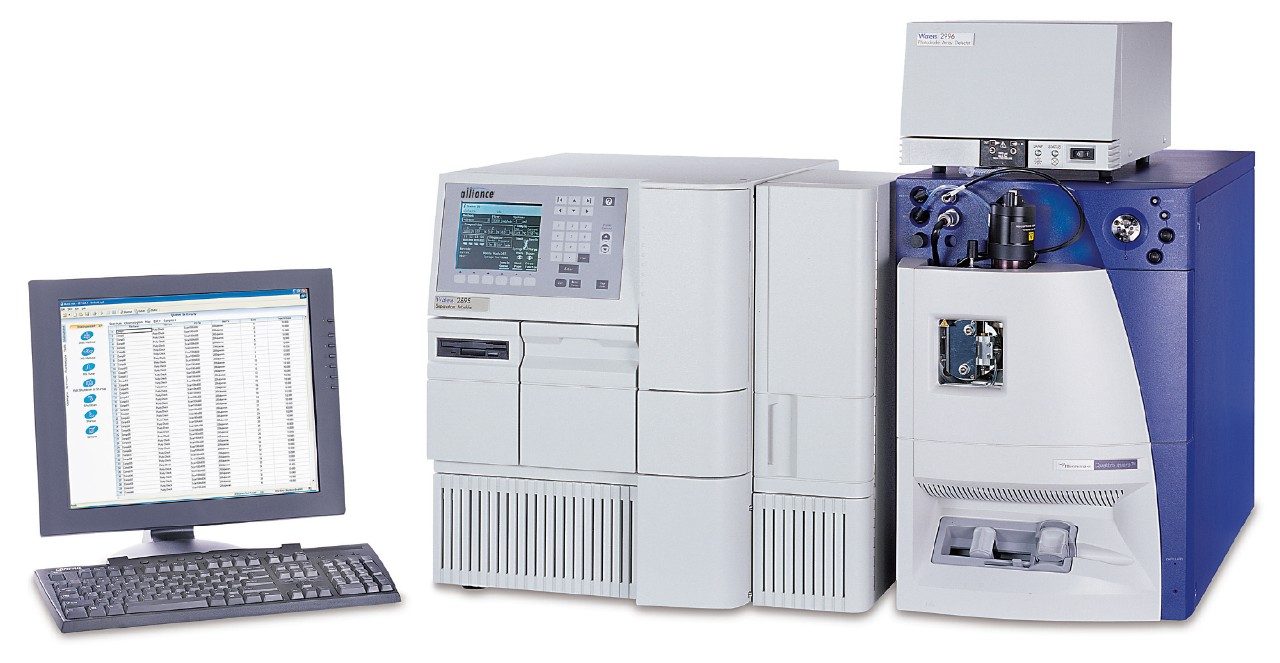
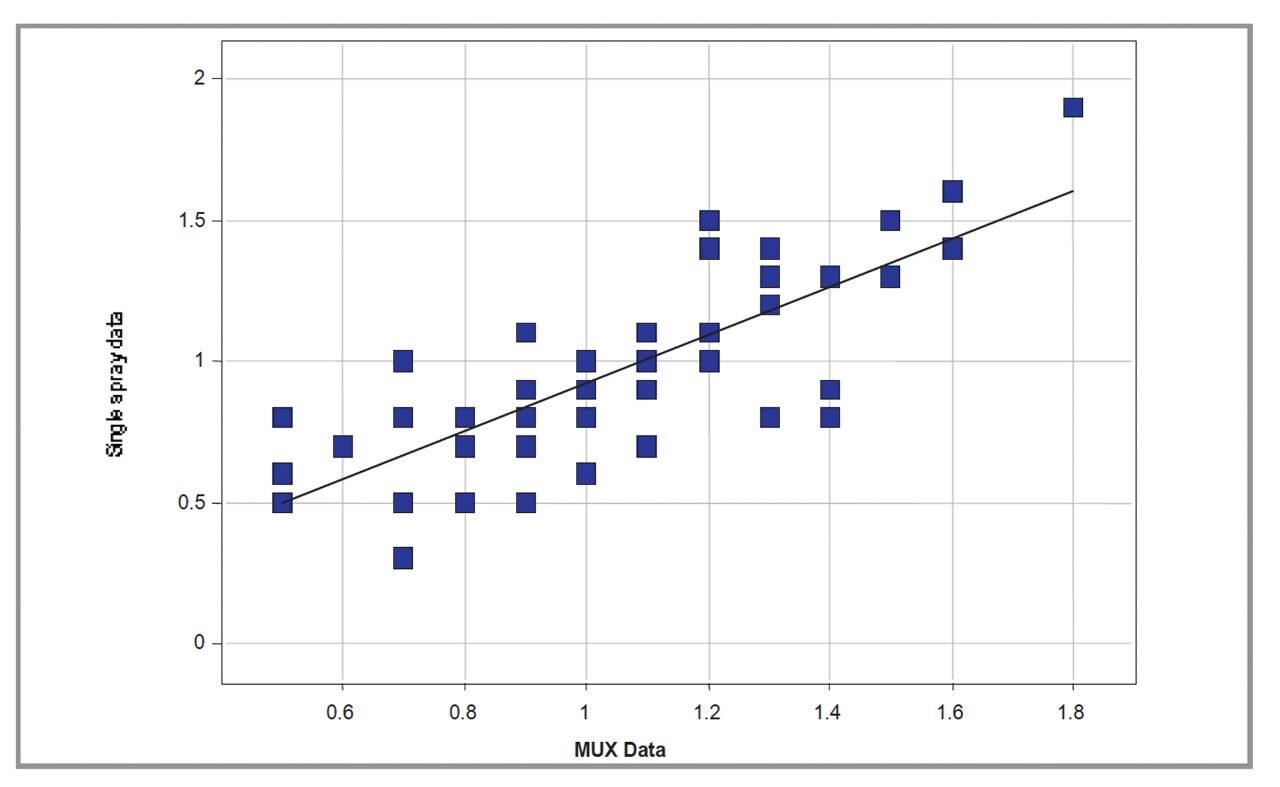
The time taken for running all the samples was approximately 2 hours using the Micromass Quattro micro MUX-QuanOptimize as opposed to a run time of 6.5 hours if the samples were run using the conventional single spray source. The following sample list indicates how QuanOptimize using MUX has run the samples.

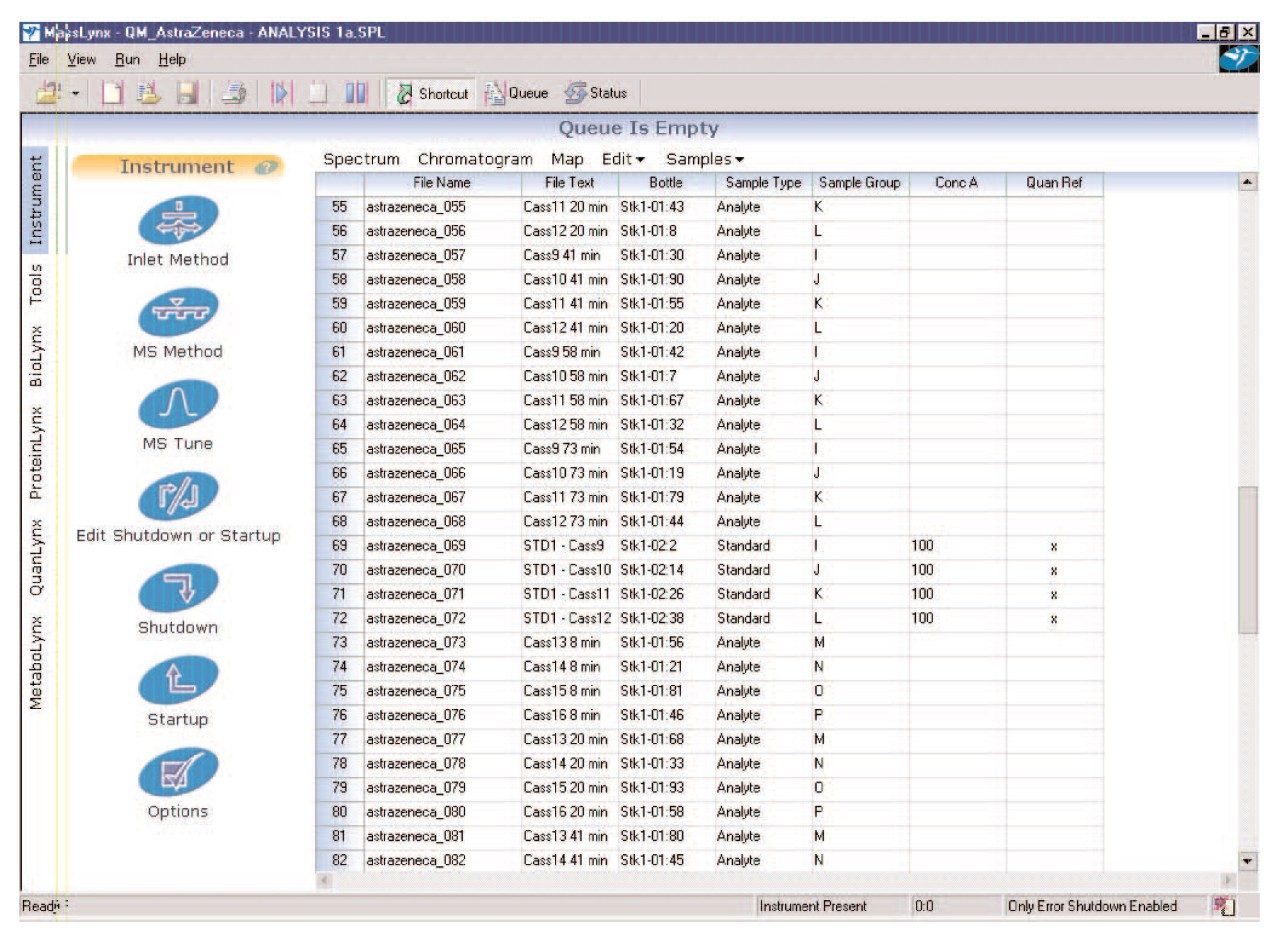
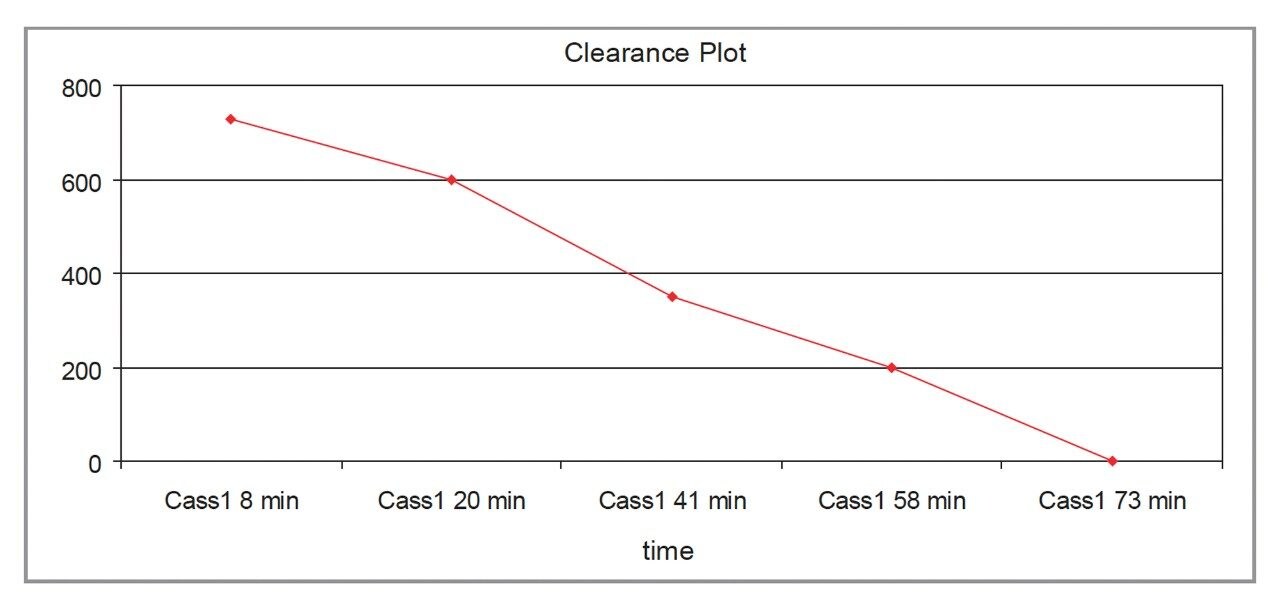
A total of 76 compounds were analyzed and for each compound five time points were analyzed (380 samples analyzed in total with 1 dummy compound and 5 dummy time points to allow a factor of four for the software to recognize MUX is being used). Each compound contained five time points at 8, 20, 41, 58, and 73 minutes and the peak areas of each were plotted against time as shown in the analytical sample list (Figure 5).

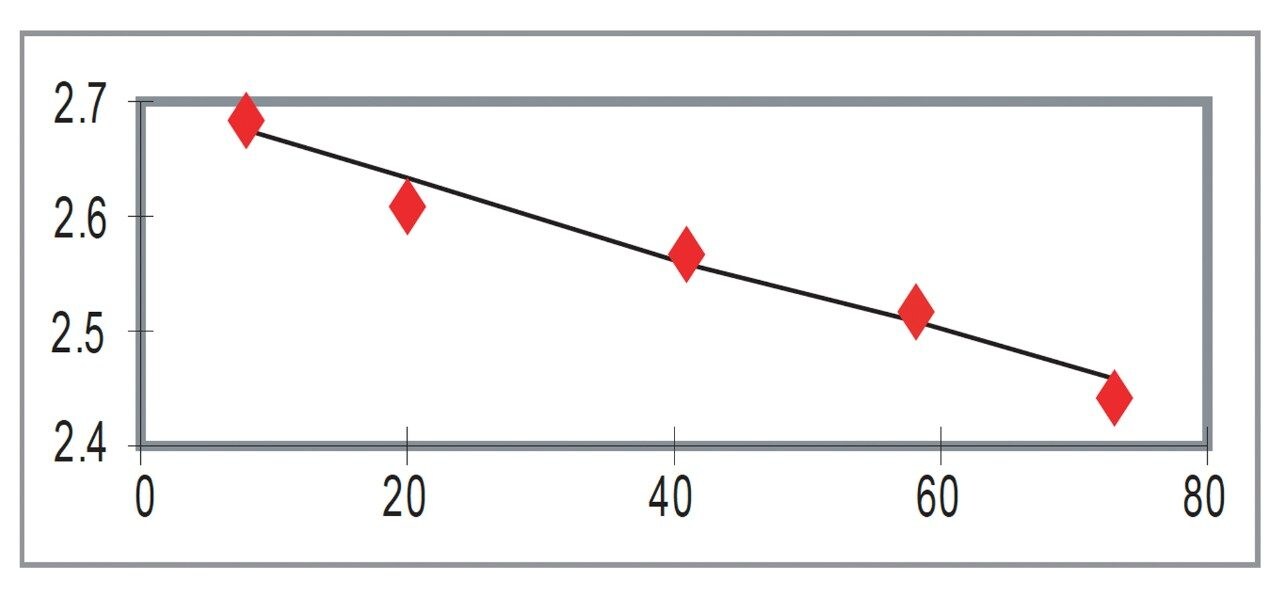
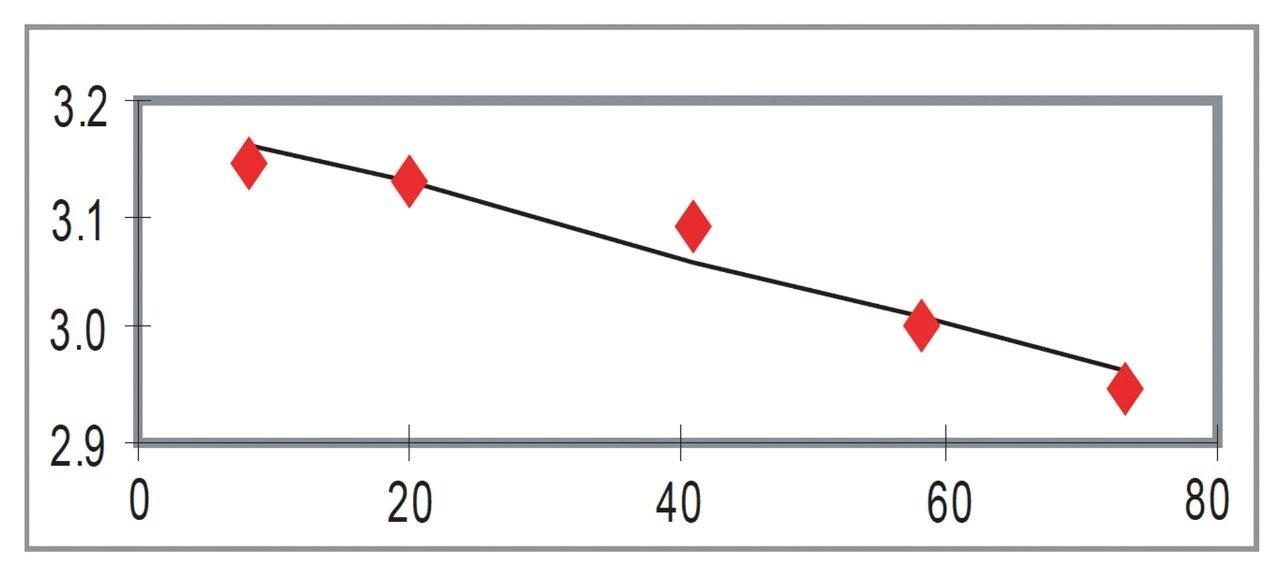
The following clearance plot diagrams give an indication of the incubated samples clearance with time:

Figure 6. Example of the clearance of drug candidate A with time.
Figure 7. Example of the clearance of drug candidate B with time.

The clearance plots above (Figures 6 and 7) are some of the examples run and show a good correlation to the data obtained with a single sprayer instrument. The samples show the reducing peak areas with the set time points from the incubated samples. For the plots individual peak areas are taken from the MUX source. This data is then plotted onto logarithmic scale [log peak area] versus [time] and gave the following results (Figures 8 and 9).

Figure 8. Intrinsic Clearance plot of drug candidate A.
Figure 9. Clearance plot of drug candidate B.

All the data analyzed in this way resulted in Rvalues of greater than 0.9, which shows excellent correlation between MUX and single spray. 

The combined data for all 76 compounds into 19 sample groups and the subsequent sampling time points was plotted for the MUX and directly compare to the results generated by a single sprayer, the graph below shows the excellent correlation (Figure 10). The data in Figure 10 shows how the single sprayer compared with the MUX source on the Quattro micro. The correlation between the two was R2>0.8.

Figure 10. Intrinsic Clearance Data: Single spray vs MUX.

This result shows that the single spray and MUX source are capable of close correlation for the analysis of compounds with a range of intrinsic clearance values. This means that the compounds that pass the initial stage of analysis can be moved onto further pharmacokinetic studies. It also highlights that the conclusion drawn at this stage of the drug discovery process can be arrived at much quicker with a MUX source than the single sprayer source whilst maintaining the integrity of the data.

Conclusion

The system that has been employed in this study was designed to meet the challenge of high throughput analysis, to come to a conclusion on whether or not to carry the drug candidates through to the next stages of the drug discovery process. Using the 4 LC pumps, the 1525 μ Waters binary pumps under full MassLynx control, and the MUX source the data was reliable and accurate. The comparison with the data was excellent with good correlation, R2>0.8.

The Quattro micro MUX with QuanOptimize demonstrated that the clearance plots could be generated in approximately two hours with fast and accurate information for the tuning conditions. The speed which samples for each group being analyzed allows fast interpretation of the clearance plots using QuanLynx Software. 

The use of multi-pump control with the four 1525 μ Waters binary pumps overcomes the issues associated with having potential blockage of columns. If one column does have a problem the data on the remaining columns is not affected. With the Waters XTerra MS C18, 3.5 μm, 3 x 20 mm Columns a very fast generic gradient can be applied whilst being robust and reproducible enough to analyze many hundreds of samples. 

There is also the possibility that multiple mobile phases can be used in order to set up different gradients on each pump, hence extending the scope of MUX by increasing the number of different compounds and associated chromatography that can be analyzed.

720000749, October 2003

回到頁首 回到頁首