• 應用手冊

Data Independent Label-Free Quantification of Low Abundance Proteins

Data Independent Label-Free Quantification of Low Abundance Proteins

  • Waters Corporation

This is an Application Brief and does not contain a detailed Experimental section.

Abstract

The quantitative analysis of complex protein mixtures requires tryptic digestion, coupled with a protein identification strategy that accurately identifies proteins with high reproducibility. This has often been overlooked and many quantitative measurements have been based upon spurious identifications. The depth to which a complex sample can be interrogated is also crucial as this defines the lowest abundance limit of proteins that may be quantified. Waters SYNAPT G2-S Mass Spectrometry System has substantial improvements in performance: mass resolution and accuracy, dynamic range, and sensitivity. These enable highly accurate protein identifications and label-free, relative protein quantification, which we present here.

Benefits

Quantify sub-femtomole level proteins using a nanoscale LC-MS system

Introduction

Isotope-labeled and label-free protein quantification in increasingly complex proteomics samples is conducted to overcome the bias and difficulty of sample fractionation. This places a demand on the performance of the analytical LC-MS system. It requires the highest coverage and maximum proteotypic information of the proteins present within the sample in order to quantify without increasing the protein false discovery rates (FDR) and false quantification rates (FQR). As such, technology improvements are indispensable. This application brief describes the use of the SYNAPT G2-S System and the results for the analysis of differentially spiked protein standards in a complex cell lysate from Escherichia coli (E.coli).

Results and Discussion

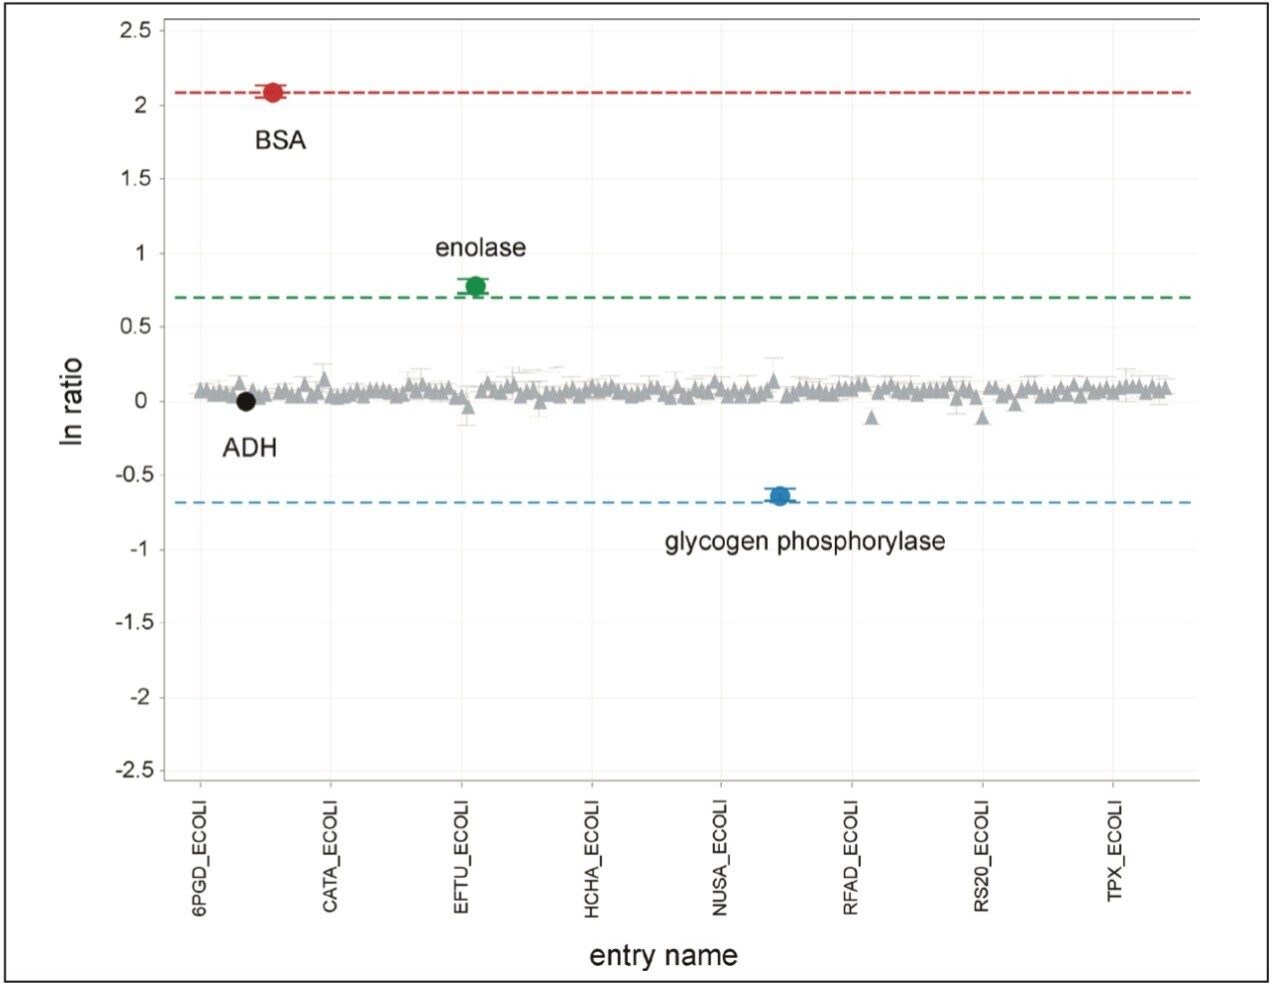
Three replicates of each E.coli sample, differentially spiked with bovine serum albumin (BSA), alcohol dehydrogenase (ADH), enolase, and glycogen phosphorylase B were analyzed. The injected on-column amounts for the spike protein in the first sample (Mixture 1) were 500 attomoles each and 4000, 500, 1000, and 250 attomoles for the second sample (Mixture 2), respectively. The nominal expected ratios (Mixture 2:Mixture 1) were therefore 8:1, 1:1, 2:1, and 1:2. The peptides were separated and analyzed using a nanoACQUITY UPLC System coupled with a SYNAPT G2-S, operating at a mass resolution of > 20k FWHM. The data were acquired in LC-MSE mode, which is an unbiased TOF acquisition method in which the mass spectrometer switches between low and elevated energy on alternate scans. Post acquisition processing software correlates precursor and product ions by means of chromatographic retention times. Further correlation processing occurs during database searching the data that is based on the physicochemical characteristics of peptides when they undergo collision induced fragmentation. Searches and quantification were conducted with ProteinLynx Global SERVER v.2.5.1 using a species specific database where sequence information of the spiked proteins was appended.

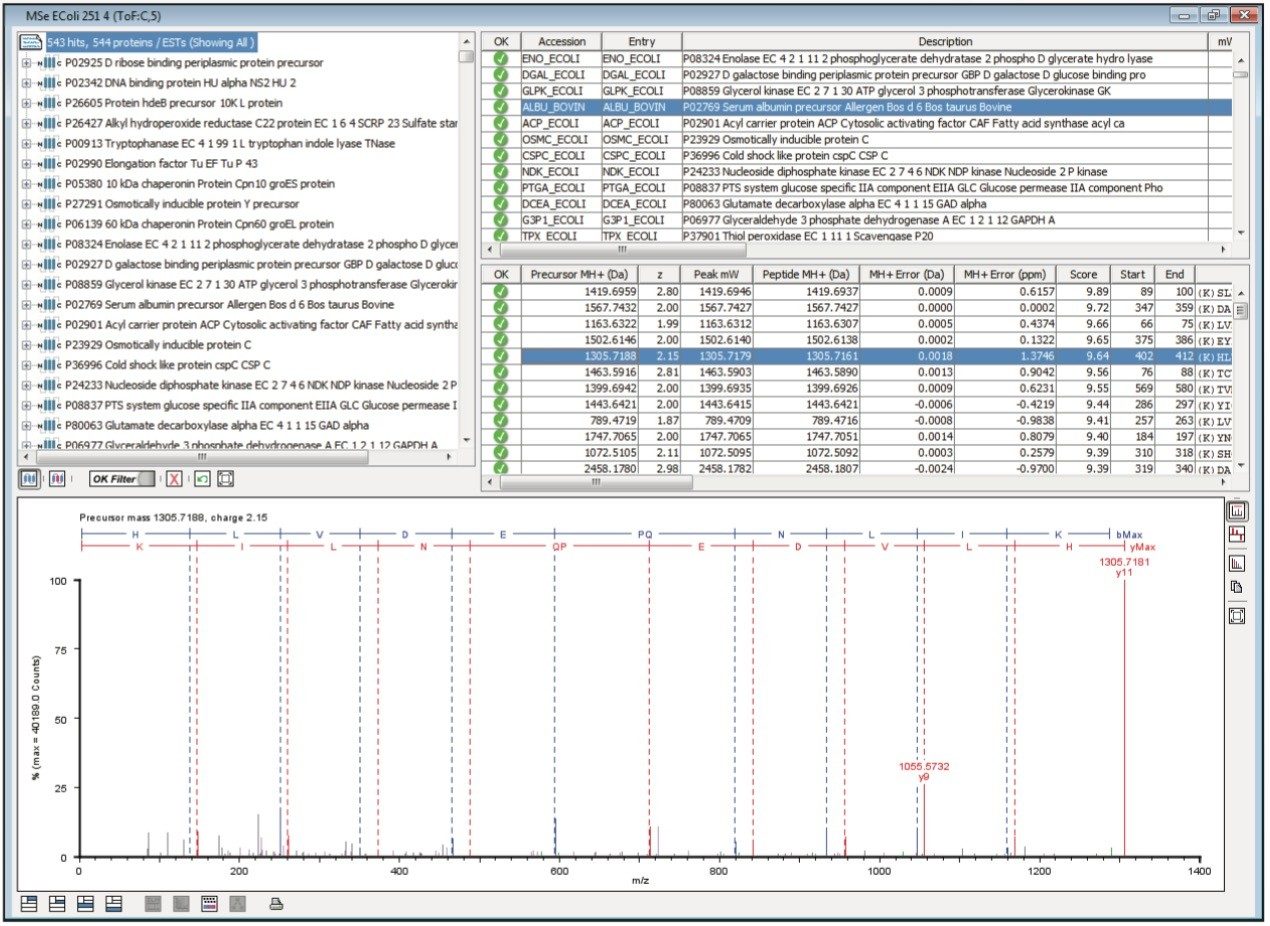
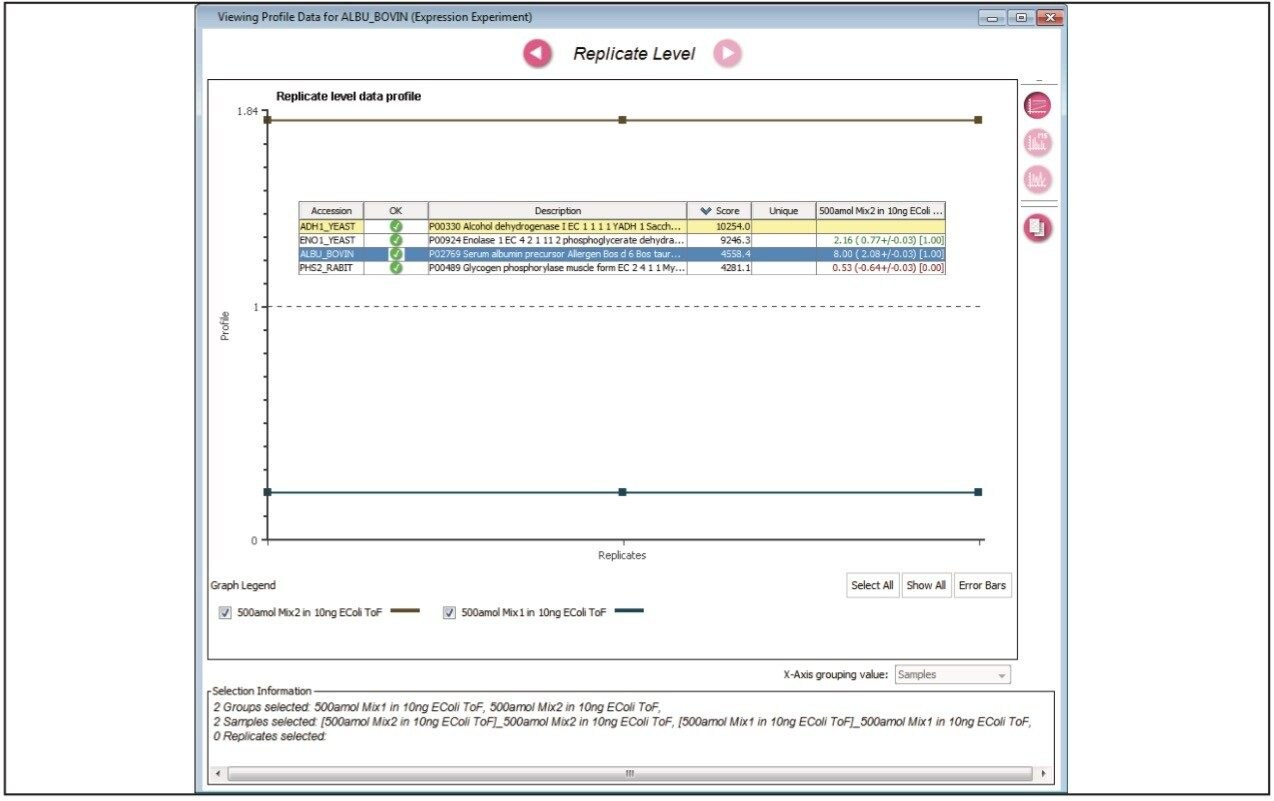
Figure 1 illustrates the qualitative results overview for an LC-MSE acquisition of one of the analyses of the differentially spiked samples. In this particular instance, the on-column amount of highlighted BSA was 4 fmol and the amount of E.coli digest was 10 ng. The results shown in Figure 2 demonstrate the corresponding relative quantification result. A graphical representation for  all of the proteins is shown in Figure 3.

Figure 1. Qualitative LC-MSE Identification for Bovine Serum Albumin. This was identified in a replicate injection of the differentially spiked sample and so is approximately 4 fmol on-column. When considering all peptide identifications, a mass error of 1.4 ppm RMS is calculated.
Figure 2. Relative label-free LC-MSE quantification and profile replication level information for BSA. The expected ratio for BSA is 8:1, which was accurately determined.
Figure 3. Quantification results overview for all proteins showing the 95% confidence intervals. Note that nearly all of the E.coli proteins (represented by triangles) lie around the line corresponding to a 1:1 ratio. The dashed lines represent the expected nominal values for BSA, enolase, and glycogen phosphorylase of 8:1 (red), 2:1 (green), and 1:2 (blue), respectively. ADH (black) was used and specified as the internal standard.

Conclusion

The label-free relative quantification of four protein standards spiked into a complex biological background has been demonstrated at the low to sub-femtomole level, obtained using a SYNAPT G2-S Mass Spectrometer operating in LC-MSE mode of acquisition. All of the reported spiked protein ratios were determined within a few percent of their nominal spike values and included in the reported 95% confidence intervals.

720004188, January 2012

回到頁首 回到頁首