• 應用手冊

Quantitative Analysis of Astaxanthin in Dietary Supplements by UltraPerformance Convergence Chromatography (UPC2)

Quantitative Analysis of Astaxanthin in Dietary Supplements by UltraPerformance Convergence Chromatography (UPC2)

  • Jacquelyn Runco
  • Rui Chen
  • Waters Corporation

Abstract

In this application note, a fast 5-minute method was developed for astaxanthin quantitation. The method was applied to confirm the label claim for three commercially available astaxanthin supplements.

Benefits

  • Due to the non-polar nature of astaxanthin, the UPC2 method offers reduced analysis time due to superior solubility in the supercritical CO2 mobile phase.
  • UPC2 employs sub-2-μm particle packed columns resulting in a higher efficiency separation.
  • The UPC2 method uses a simple CO2/methanol mobile phase and gradient for astaxanthin analysis, in comparison to the complex solvent scheme currently in use in HPLC, reducing solvent costs and improving safety.
  • The excellent precision (RSD <1.5%) and the experimentally determined label claim agreement (within 5%) proves the UPC2 astaxanthin analysis can be easily adapted to the current workflow.
  • The proposed 5-min UPC2 method can improve productivity for laboratories routinely performing quality control and regulatory compliance monitoring where a large number of assays are required.

Introduction

In recent years, carotenoids have received considerable attention for their antioxidant activity and potential clinical uses.1 They are widely used in various industries including food, dietary supplements, aquaculture, pharmaceutical, and cosmetics.2 In particular, astaxanthin (Figure 1) is a carotenoid known for its anti-inflammatory effects and strong antioxidant activity (superior to β-carotene and Vitamin C).3 Found in large quantities primarily in Haematococcus pluvialis algae, astaxanthin is responsible for the familiar red color of salmon, shrimp, and lobster.4

Figure 1. Chemical structures and LogP values of astaxanthin and the internal standard, trans-β-apo-8’-carotenal.

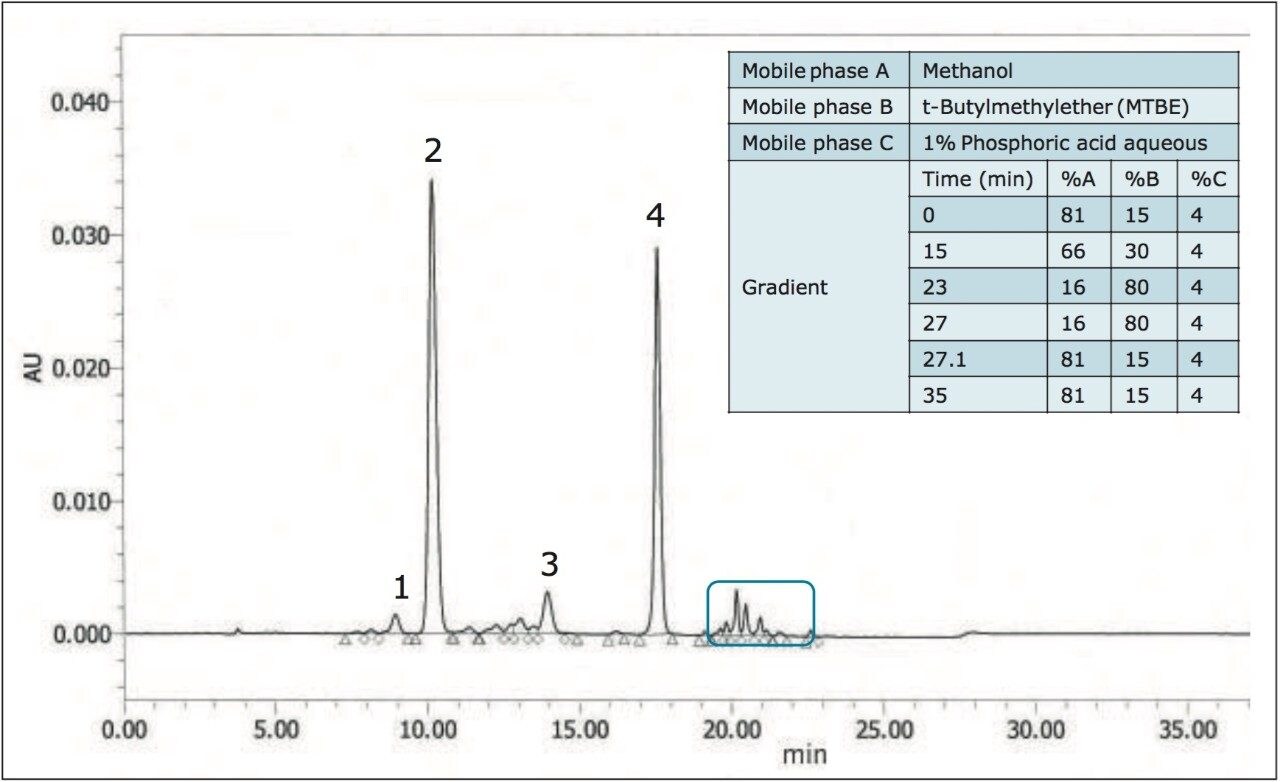
Astaxanthin supplements are produced commercially by many manufacturers.4 As regulatory compliance monitoring of nutraceuticals becomes more stringent, rapid and reliable analytical methods for quantitation become increasingly necessary. Currently, astaxanthin quantitation is done by two methods: spectrophotometrically, and chromatographically by HPLC. The spectophotometric method suffers from a lack of specificity between the astaxanthin and other carotenoids, resulting in an overestimation of the astaxanthin content, sometimes by as much as 20%.4 The standard HPLC method has long analysis times, and involves unfriendly, complex (three component normal phase) solvent schemes due to the non-polar properties of the analytes.5

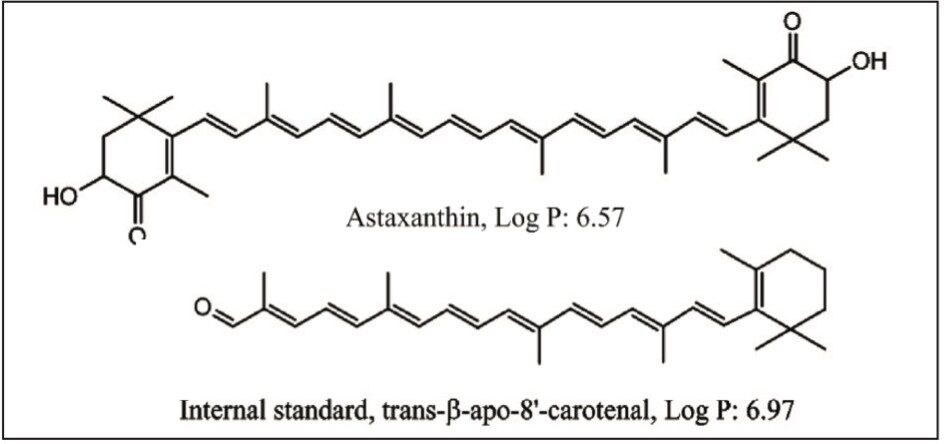
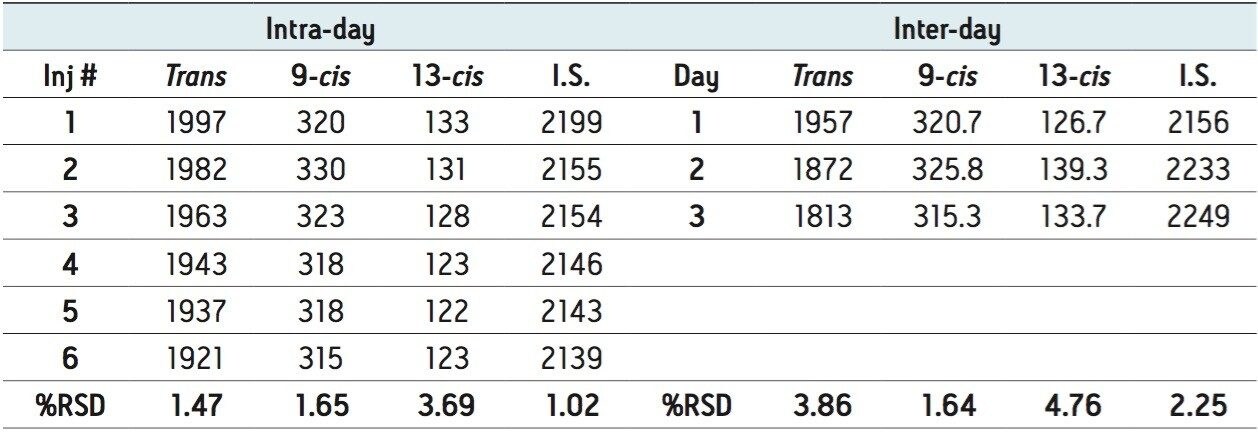
Naturally-derived astaxanthin is present primarily as a mixture of fatty acid esters. Many commercial supplements are kept in this form for stability reasons. Therefore, the esterified astaxanthin must first be hydrolyzed (de-esterified) to yield free astaxanthin prior to analysis. An internal standard, trans-β-apo-8’- carotenal (Figure 1) is used for quantitation in order to account for any variation in the assays.6

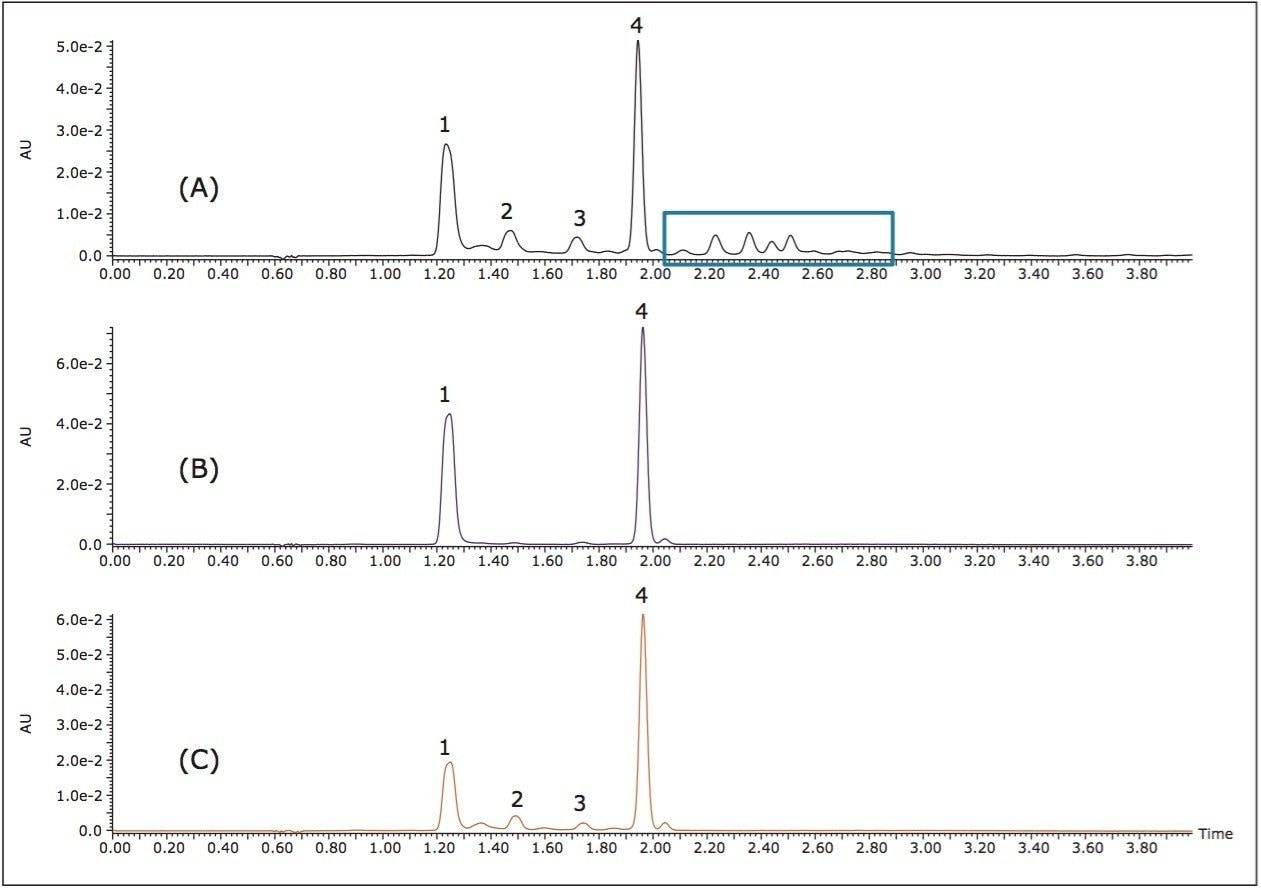
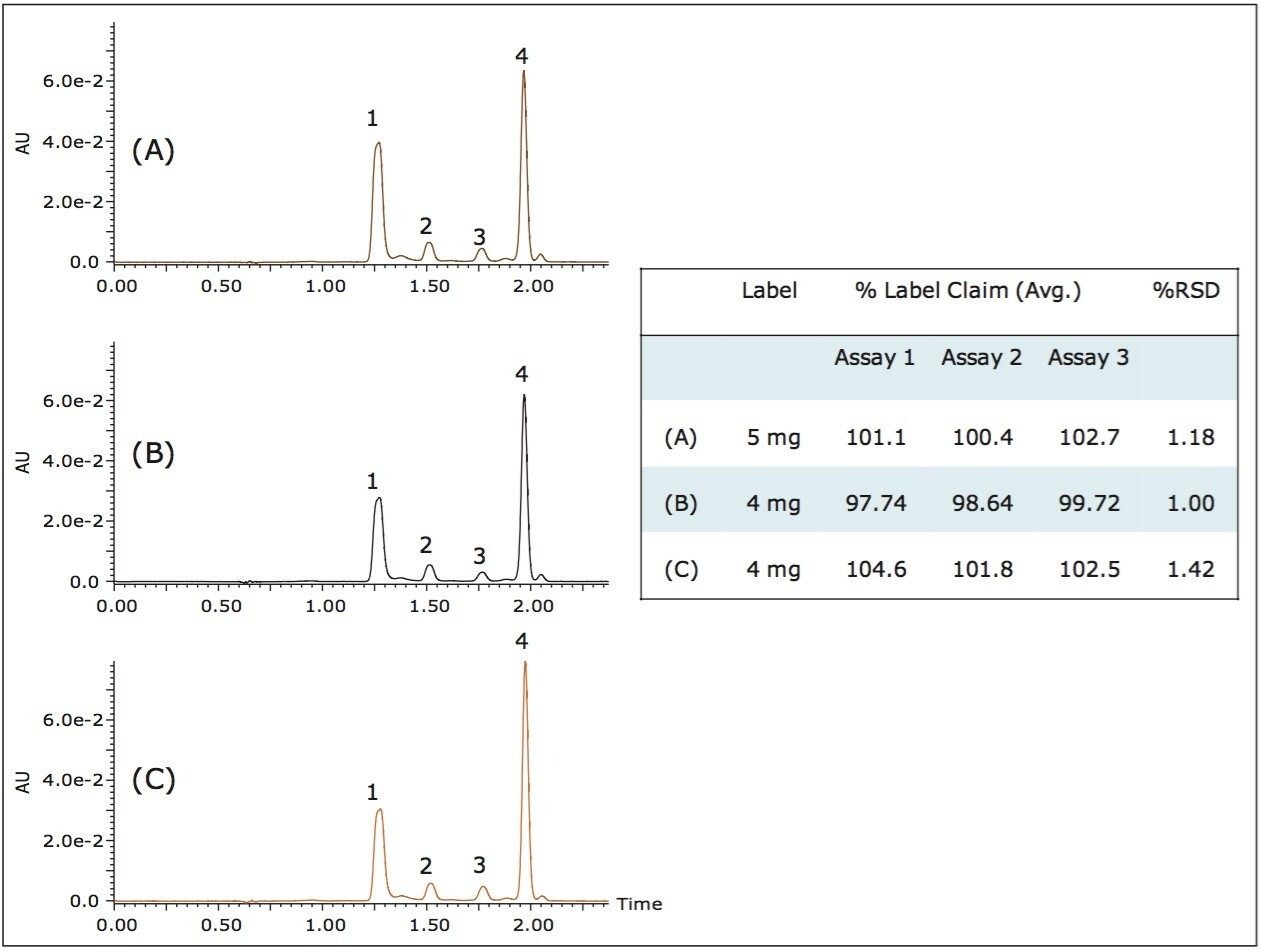
In UltraPerformance Convergence Chromatography (UPC2) the primary component of the mobile phase, CO2, has lower viscosity, allowing for faster flow rates and the use of smaller particle sizes, which increases separation efficiency. The efficiency combined with the higher solubility of the non-polar analytes in CO2 results in faster run times. Here, a fast 5-minute method was developed for astaxanthin quantitation. The method was applied to confirm the label claim for three commercially available astaxanthin supplements.

Experimental

UPC2 conditions

All experiments were performed on a Waters ACQUITY UPC2 system, equipped with an ACQUITY UPC2 PDA Detector, and controlled by MassLynx software. Following an initial screen of five columns, the ACQUITY UPLC HSS C18 (1.8 μm, 3 x 150 mm) Column was selected for method optimization and all quantitative experiments. Table 1 contains the optimized UPC2 method parameters.

Mobile phase A:

CO2

Mobile phase B:

Methanol

Flow rate:

1.0 mL/min

Backpressure:

200 Bar

Temperature:

30 °C

Injection volume:

2 μL

Column:

ACQUITY UPLC HSS C18

PDA detector:

Compensated: 457 nm

Reference: 530–600 nm

Gradient:

Time (min)

%B

0

5

2

15

3

15

4

5

5

5

Table 1. UPC2 method parameters for astaxanthin analysis.

Standards

For Standard A (Std A) 2.50 mg of trans-astaxanthin (Alexis Biochemicals, Farmingdale, NY, USA) was dissolved in 100 mL acetone and then diluted 1:10 for a final concentration of 2.50 μg/mL. The internal standard (I.S.) was prepared by dissolving ~ 3.75 mg 20% oil suspension of trans-β-apo-8-carotenal (Sigma-Aldrich, Allentown, PA, USA) in 100 mL acetone for a final concentration of ~7.50 μg/mL. Standard B (Std B) is a mixture of 7.50 μg/mL astaxanthin and ~7.50 μg/mL I.S. The samples were kept in the refrigerator, protected from light, to minimize acetone evaporation and possible photo-degradation of the analytes.

Supplement assay solutions


Three astaxanthin supplement formulations were obtained from commercial sources. The content of one capsule from each supplement was dissolved in 100 mL acetone. The aliquots were further diluted by 1:10 (v/v) in acetone to make the Assay A solution. For each brand of supplement, samples were prepared in triplicate using 2 mL of Assay A solution and 1 mL of I.S. solution. The samples were hydrolyzed by enzymatic de-esterification using cholesterolesterase (following the Fuji methodology).6 The resulting solution was extracted with 2 mL hexane and centrifuged. The top hexane layer was transferred to another test tube, dried down by nitrogen and reconstituted in 1 mL acetone (Assay B solution). For method development purposes, a hydrolyzed sample (Assay B solution) was spiked with the non-hydrolyzed esters (Assay A solution) to ensure the sample contained both free astaxanthin and its fatty acid esters.

Calculations


The calculations used to determine astaxanthin concentration and % label claim are displayed in Figure 2. All injections were done in triplicate and average areas were used. Due to the unavailability of 9-cis and 13-cis standards, previously established response factors of 1.1 and 1.3 were used respectively in the peak ratio calculation. Std B injections were performed and the Std B peak ratio (RstdB) was calculated for each supplement. Using the concentration of astaxanthin in Std B, the RstdB value, and the peak ratio for the Assay B solution (RAstx), the astaxanthin concentration in Assay B could be determined. A simple back calculation was done to account for dilution, and compared against the label claim (%Label claim).

Figure 2. Calculations used to determine astaxanthin concentration and % label claim.

Results and Discussion

HPLC vs. UPC2 methods

There are multiple chromatographic challenges associated with astaxanthin quantitation. Free astaxanthin is a mixture of geometric trans, 9-cis and 13-cis isomers; trans being the most dominant form. Due to the difference in UV absorption coefficients, an accurate quantitation requires the separation of all three isomers and the internal standard. Also, in the event of incomplete hydrolysis, the astaxanthin esters must be resolved from the rest of the analytes to avoid interfering with the peak areas.

The HPLC method is currently accepted as the standard for astaxanthin quantitation (Figure 3). The method exhibits good separation, but suffers challenges mostly due to the non-polar nature of the analytes. A complex three component mobile phase is required, employing methanol, t-butylmethylether, and an aqueous phosphoric acid solution in a relatively lengthy 35-minute gradient method.

Figure 3. Astaxanthin separation under the standard HPLC gradient conditions. The peaks are: (1) 13-cis-astaxanthin; (2) trans-astaxanthin; (3) 9-cis -astaxanthin; and (4) I.S. The esters are indicated by the blue rectangle.

In contrast to HPLC, UPC2 employs supercritical CO2 as the main component of the mobile phase, offering superior solubility for non-polar analytes. The UPC2 method uses a simple CO2/methanol mobile phase and 5-minute gradient method to achieve separation in a little over 2 minutes (a 10-fold improvement over the HPLC method).

In figure 4, three chromatograms are shown. The first (A) displays a sample containing unhydrolyzed esters used for method development to ensure resolution of the esters from the analytes. Figure 4(B) shows Std B (trans-astaxanthin standard and I.S.) used to determine the peak ratio (RstdB). Lastly, a fully hydrolyzed supplement (Assay B) is shown in Figure 4(C). The internal standard and astaxanthin peaks were confirmed by MS (not shown), and the geometric isomers were distinguished by their UV spectra, where the 13-cis isomer has a characteristic dual maximum.1

Figure 4. UPC2-UV chromatograms of (A) sample containing esters, (B) Std B, (C) hydrolyzed supplement (Assay B). The peaks are: (1) trans-astaxanthin; (2) 9-cis-astaxanthin; (3) 13-cis -astaxanthin; and (4) I.S. The esters are indicated by the blue rectangle.

Repeatability


Intra- and inter-day experiments were performed using one of the Assay B solutions and the corresponding %RSD was calculated. Six replicate injections were done for the intra-day experiment while the inter-day experiments were carried out over 3 days (6 replicate injections each day). The results are summarized in Table 2.

Table 2. Calculated % RSDs for intraday and inter-day area results.

For intra-day repeatability, the 13-cis-astaxanthin exhibits the highest %RSD, possibly due to its relatively small peak area. For inter-day assays, the %RSD values are slightly elevated. This can be ascribed to the propensity of these analytes for degradation in the presence of light and oxygen, and the tendency for isomeric conversion between the cis and trans isomers. Nevertheless, satisfactory RSDs (<5%) were obtained for both inter- and intra-day assays.

Supplement analysis


The described UPC2 method for quantitative analysis of astaxanthin was utilized to confirm the label claim for three commercially available supplements. Example chromatograms for the three dietary supplement assays are displayed in Figure 5 and exhibit similar profiles. No astaxanthin esters were detected, indicating complete hydrolysis.

Figure 5. UPC2-UV chromatograms of the hydrolyzed astaxanthin supplements and the calculated %label claim results. The peaks are: (1) trans-astaxanthin, (2) 9-cis-astaxanthin, (3) 13-cis-astaxanthin, and (4) I.S.

Each supplement was assayed in triplicate and injected in triplicate. Average areas were used to calculate the % label claims presented. For each supplement, excellent repeatability (%RSD <1.5) was attained, and the experimentally determined content agreed well with the label claim.

Conclusion

  • In UPC,2 supercritical CO2 offers superior solubility for astaxanthin, resulting in a 10-fold reduction in analysis time when compared to HPLC.
  • The optimized UPC2 method is superior to the standard HPLC method, achieving good resolution with a simpler and faster gradient and mobile phase.
  • The method was repeatable, which meant it could be successfully applied to the quantitation of three commercially available astaxanthin dietary supplements.
  • Excellent precision was attained for the assays, and the experimentally determined content agreed well with the label claims proving it could be easily adapted into the currently accepted process.
  • The UPC2 method was demonstrated to be rapid and reliable, meeting the requirements necessary in an increasingly regulated and growing market.

References

  1. Zhao L, Chen F, Zhao G, Wang Z, Liao X, Hu X, “Isomerization of trans-Astaxanthin Induced by Copper(II) Ion in Ethanol”, J. Agric. Food Chem., 2005, 53, 9620–9623. 
  2. Fonseca RAS, Rafael RS, Kalil SF, Burkert CAV, Berkert JMF, “Different cell disruption methods for astaxanthin recovery by Phaffia rhodozyma”, African J.Biotech.10(7) February 2011 1165–1171.
  3. Wang L, Yang B, Yan B, Yao X, “Supercritical fluid extraction of astaxanthin from Haematococcus pluvialis and its antioxidant potential in sunflower oil”, Innovative Food Science and Emerging Technologies, 13 (2012) 120–127.
  4. http://www.nutritionaloutlook.com/print/2850
  5. Rivera SM, Canela-Garayoa R, “Analytical tools for the analysis of carotenoids in diverse materials”, J. Chromatogr. A, 1224 (2012) 1–10.
  6. Astaxanthin Content in AstaREAL L10, V1 May 2009, http://www.fujihealthscience.com/Assay-Method_AstaREAL-L10.pdf

720005151, August 2014

回到頁首 回到頁首