With increasing global trade there is a requirement for multi-analyte screening strategies capable of efficiently detecting residue violations in order to protect consumers. Countries have different regulations concerning licensing and Maximum Residue Limits (MRLs). It is essential that food commodities are screened efficiently and with confidence. Maintaining efficiency for pesticide residues analysis in food has become an increasingly challenging task, considering the increasing number of compounds to be monitored at low concentrations with generic extraction procedures. The analytical challenge to rapidly and efficiently identify target compounds is exacerbated because the target analytes can occur with a large number of co-extracted matrix components.
Enhancements in data processing software packages have enabled multiple screening parameters such as retention time, precursor, and fragment accurate mass to be built into scientific libraries. Data can be screened with tolerances that are compliant with the SANCO/12571/2013 guidance document.1 Advances in mass spectrometry technology have provided sensitivity increases; however this is the case for both matrix and target ions. The challenge reverts to removing false detections through careful optimization of software screening parameters, while ensuring that when dealing with the impact of such complex matrices false negative identifications do not occur.
Even with enhanced informatics-based solutions, it is still common for the resultant data to be interrogated manually. Manual data interrogation is labor intensive and time consuming. Consider the accepted mass accurracy tolerance of 5 ppm – this is not the value initially applied in many laboratories. The actual screening tolerances applied are realistically <10 ppm. Hence laboratories automatically screen using wider tolerance parameters than the guidelines suggest and they need to manually interrogate data to ensure that no false negative detections have occurred. Wider tolerances produce larger numbers of false detections which impact laboratory efficiency. In addition, as previously described, retention times can also vary and be affected by matrix shifts, column loading, as well as system setup.2 In order to efficiently deploy high resolution accurate mass spectrometry for routine contaminant screening, a workflow that removes the need for manual interrogation is essential.
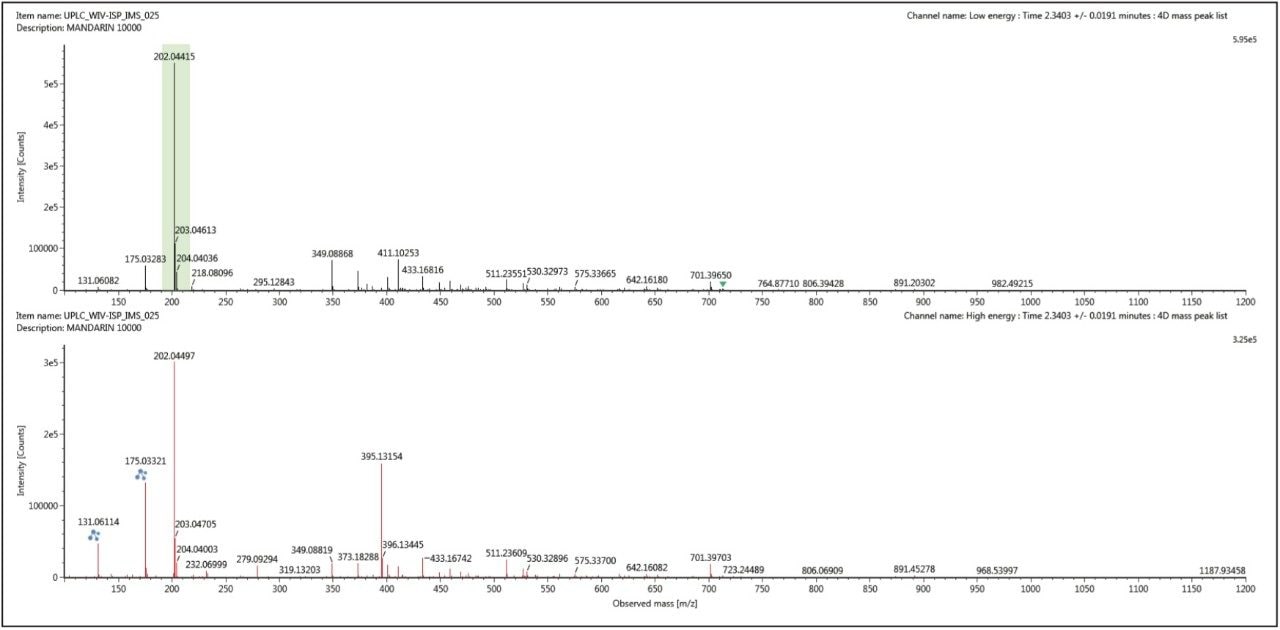
At MRL levels and below, it can be a challenge to obtain isotope fits, fragment ions, and ion ratios for all pesticides. This is often due to matrix suppression, but it may also be due to poor ionization efficiencies of some compounds, and the tendency of certain compounds to form adducts. If sodium adducts form, it is unlikely that characteristic fragmentation will be obtained. Sodium and potassium are ubiquitous and originate from the matrix or from the glassware used. Pesticides that contain carboxyl or carbonyl ether or ester groups are likely to bind alkali metal ions such as sodium or potassium. They form very stable species and usually do not fragment. This may have the consequence of removing a potential identification point (in the form of fragment ions) if the protonated form is not also present to provide the opportunity to detect fragment ions.
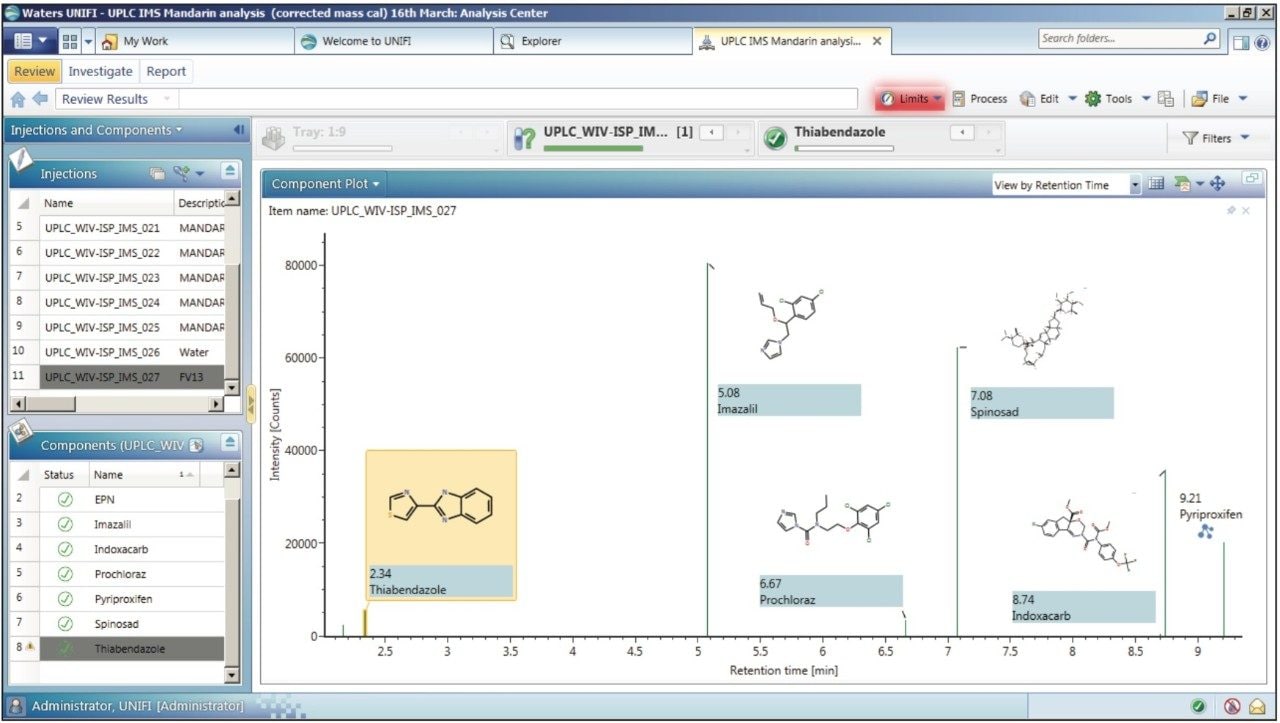
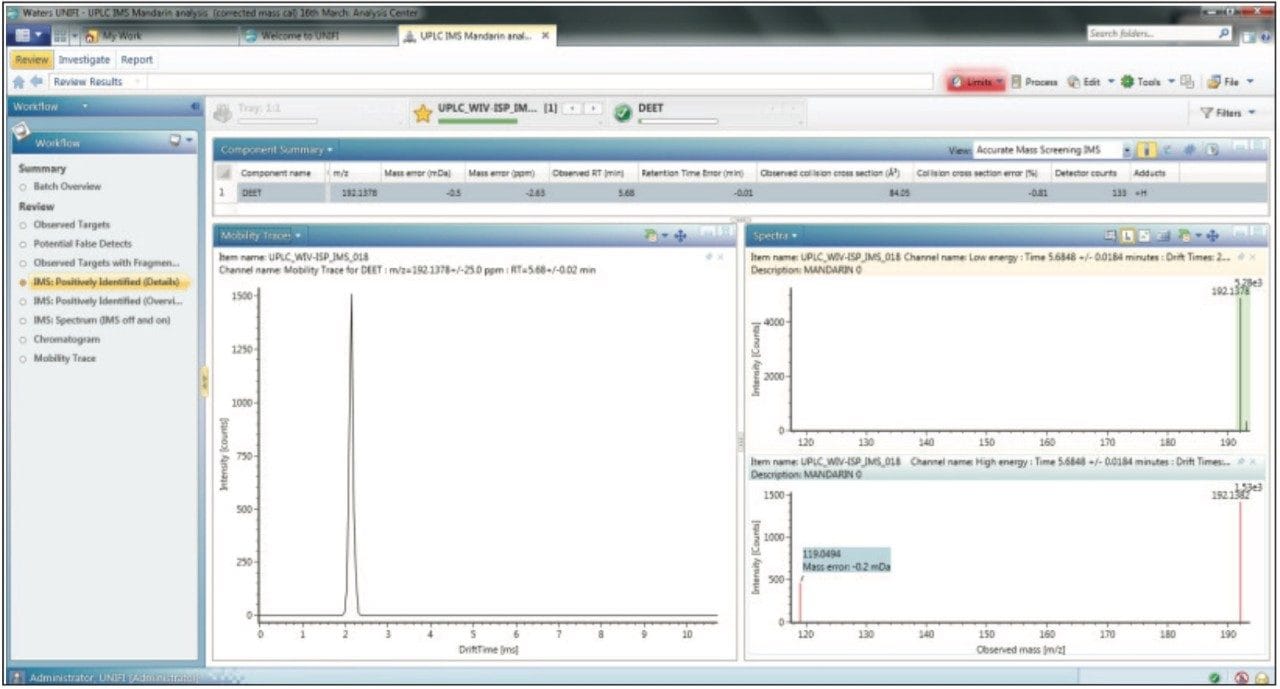
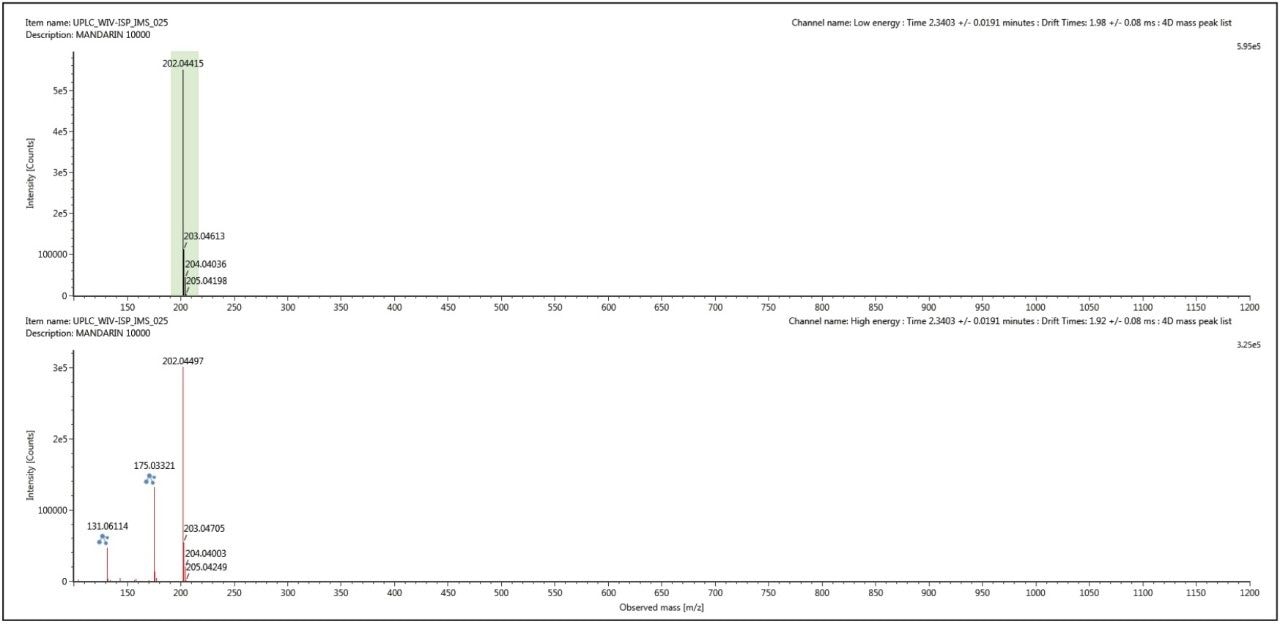
A strategy where further information could be provided for more confident identifications would be advantageous. This additional information could work in conjunction with accurate mass and fragment ions, when retention time shifts occur, when a monoisotopic peak has been identified, or adducting has prevented fragmentation data being obtained. At the MRL, confidence in screening assays could also be improved if the matrix and analyte could be routinely deconvoluted. This would allow better visibility of the fragmentation information generated and remove the matrix interferences from low level isotope distributions. This strategy can be employed using the combination of UPLC separations and orthogonal ion mobility with accurate mass MS, where very specific retention time aligned and mobility aligned data is produced.
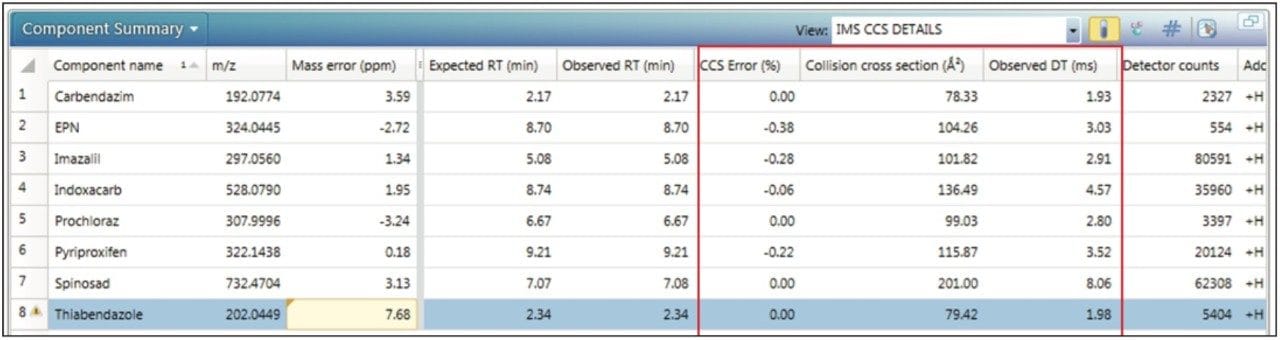
In this application note, we explore the feasibility of using the ACQUITY UPLC I-Class System in combination with ion mobility mass spectrometry (IMS-MS) as a new strategic approach for the screening of pesticide residues in food. This technique offers some unique advantages for profiling complex matrices. Ion mobility provides an orthogonal separation to UPLC, where compounds can be differentiated based on size, shape, and charge. Collision cross section (CCS) values can be routinely generated to provide additional identifying information. CCS information requires fewer stringent screening parameters, and offers the confidence of avoiding false negative identifications. The orthogonal separation allows cleaned up precursor and fragment ion spectra to be obtained. In addition, both precursor ion and fragment ion information can be acquired in a single injection on all components, with the fastest UPLC compatible ion mobility duty cycle available (10.8 ms).
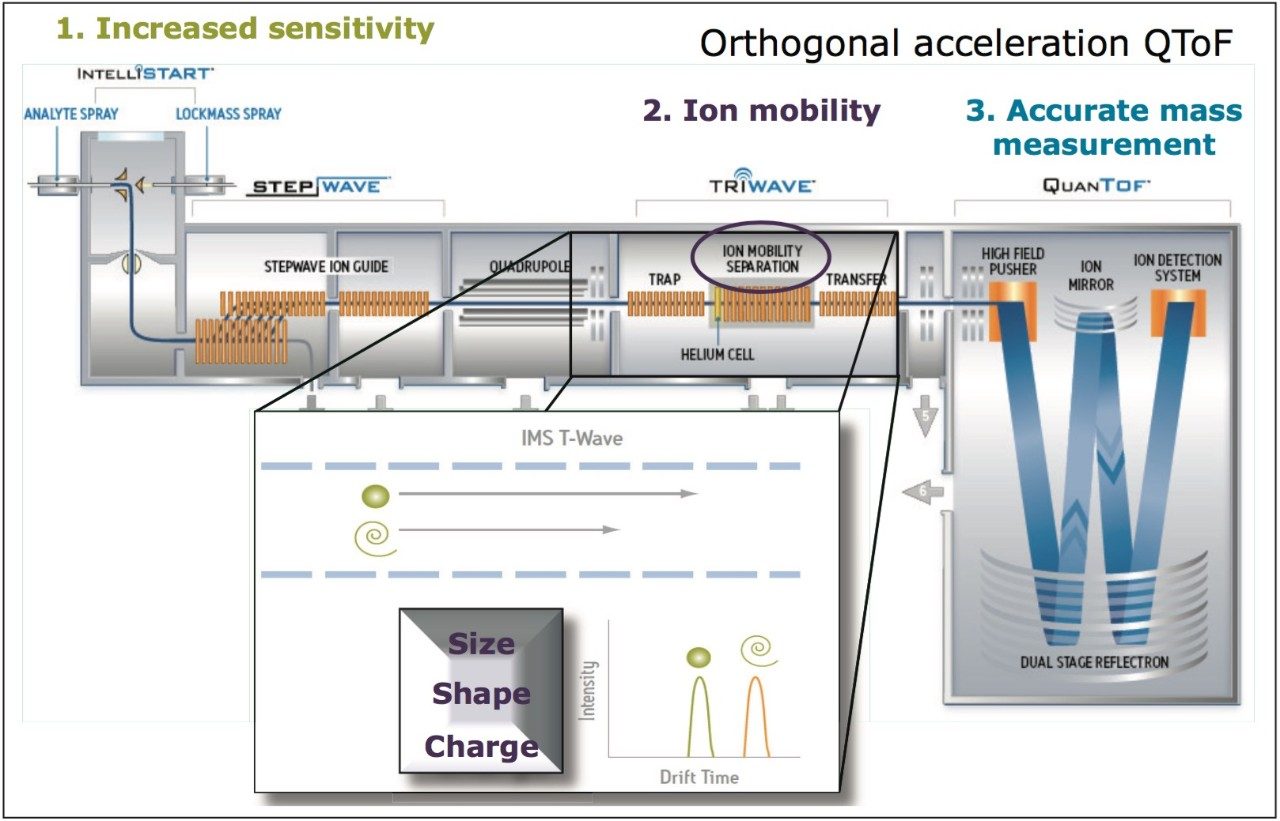
The study undertaken uses a Waters SYNAPT G2 HDMS platform, for which a schematic representation and illustration of the mechanism of ion mobility are shown in Figure 1. CCS measurements can provide a route to specific and unambiguous identification, enabling the unequivocal distinction of target residues. The application of ion mobility to remove false positive identifications and more importantly, false negative identifications, spectral cleanup, and increased identification confidence will be discussed.