• 應用手冊

Improving Routine Analysis of Insulin Analogues Using the ACQUITY QDa Detector

Improving Routine Analysis of Insulin Analogues Using the ACQUITY QDa Detector

  • Ximo Zhang
  • Robert E. Birdsall
  • Ying Qing Yu
  • Waters Corporation

Abstract

This application note demonstrates the applicability of an LC-UV/MS workflow using the ACQUITY QDa Detector for purity, comparability, and identity testing in insulin analyses.

The ACQUITY QDa Detector demonstrated improved sensitivity and specificity for insulin analysis, which offers a cost-effective means to increase the productivity and confidence for quality control of insulin drugs.

Benefits

  • A cost-effective solution for improving quality control of small biotherapeutics using the ACQUITY QDa Detector
  • LC-UV/MS workflow using Waters compliant-ready Empower CDS Software for regulated environments
  • Improved sensitivity and specificity for identity and purity testing

Introduction

Since its FDA approval in 1982, human insulin has seen six analogues come to market with either faster response times or extended drug activity.1 These insulin analogues differ from each other by a few amino acids, resulting in highly similar structures. With a global insulin market valued at $27 billion, and a relatively simple protein structure (Figure 1), development of a biosimilar insulin product was inevitable with the first ‘follow-on’ insulin launched in the US market in 2016.2,3

Figure 1. Structure of human insulin. Human insulin is a 53 residue biomolecule that consists of two peptide chains linked by disulfide bonds with a total molecular weight of 5.8 kDa. 

To ensure product safety and efficacy, the newly released FDA guidance “Clinical Pharmacology Data to Support a Demonstration of Biosimilarity to a Reference Product” recommends integrated and multi-parameter approaches to identify analytical differences of biosimilars.4 Many of the analytical methods for insulin, such as the LC-UV-based assay used in the US Pharmacopeia (USP) monograph, lack the specificity and sensitivity needed to differentiate insulin analogues or biosimilar products.5,6 In the case of identity testing, legacy LC-UV methods such as these often implement fraction collection and testing for product identification at the cost of productivity. The addition of MS detection to existing or new workflows as an orthogonal detection technique provides an efficient means to avoid additional labor intensive techniques. It also improves productivity of drug development and quality control of insulin biosimilars and analogues.

The ACQUITY QDa Detector is a cost-effective solution for adding MS detection to routine LC-UV-based workflows. With the ACQUITY QDa as an in-line detector, both UV and MS data can be acquired in a single workflow, allowing quantification and mass confirmation of monitored peaks for increased confidence in data interpretation. The ACQUITY QDa Detector has a proven track record with successful implementation in regulated environments for routine analysis of therapeutics, making it ideal for improving productivity in insulin analyses.7,8

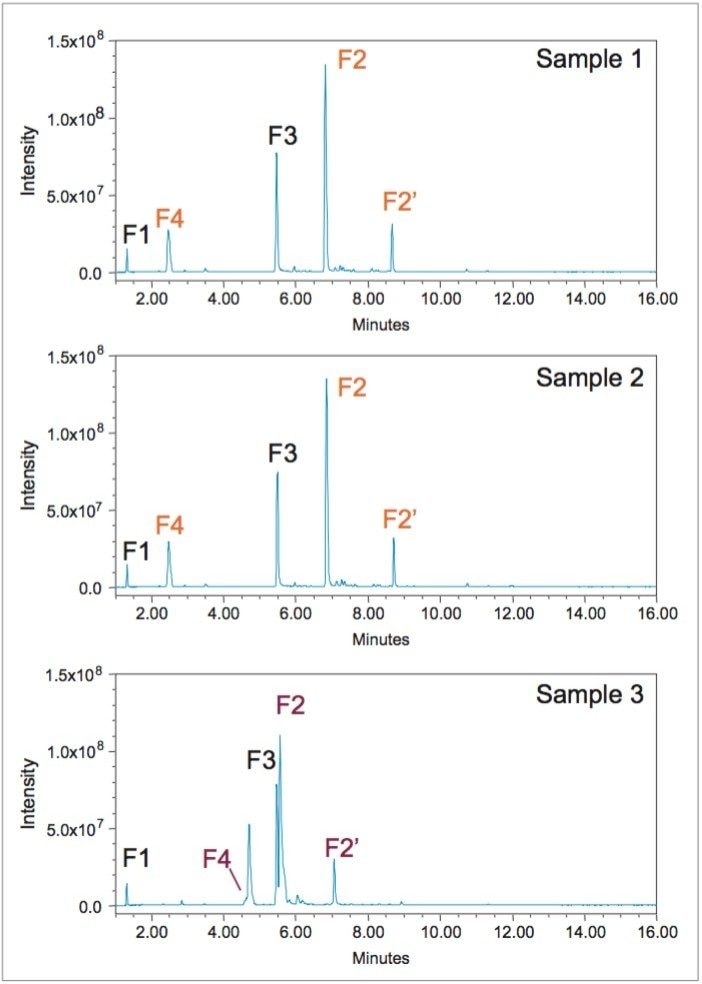
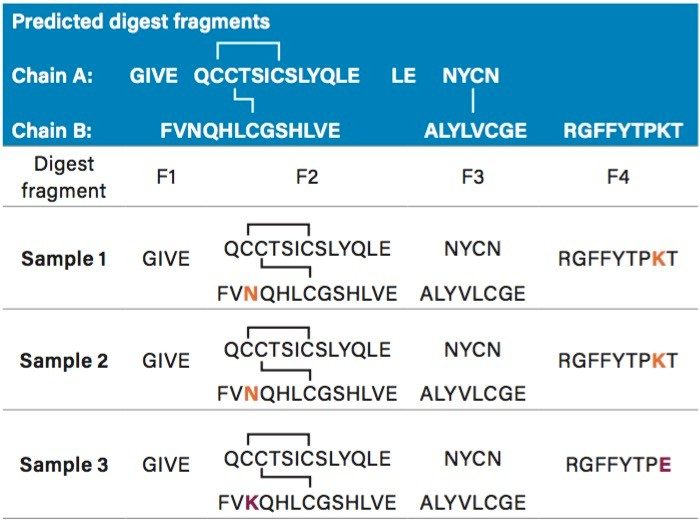
The objective of this application note is to demonstrate the applicability of an LC-UV/MS workflow using the ACQUITY QDa Detector for purity, comparability, and identity testing in insulin analyses. Intact analysis and peptide mapping workflows will be evaluated for insulin drugs obtained from three different drug manufacturers. Methods for identity test were adapted from the USP monograph: insulin human for LC-UV/MS compatibility.5

Experimental

Chemical and reagents

Insulin drugs were obtained from three different drug manufacturers and diluted to 0.35 mg/mL for intact insulin analysis. Endoproteinase Glu-C from S. aureus was purchased from Promega. Digestion procedure was as outlined in the USP monograph: insulin human,5 except the digestion temperature was increased to 37 °C from 25 °C to alleviate the effect of stabilizers in the sample. HPLC grade water, acetonitrile, and formic acid were purchased from Fisher Scientific and used as received. 

LC conditions

LC system:

ACQUITY UPLC H-Class Bio (p/n 10166246)

Detectors:

ACQUITY UPLC TUV Detector (p/n 134892155) 5 mm flow cell, λ = 215 nm ACQUITY QDa Detector (Performance model)

LC column:

ACQUITY UPLC CSH C18, 1.7 μm, 130 Å, 2.1 mm × 100 mm (p/n 186006937)

Column temp.:

60 °C for intact analysis 40 °C for peptide map

Sample vial:

12 x 32 mm glass vial, total recovery (p/n 600000750cv)

Mobile phase A:

Water, 0.1% FA

Mobile phase B:

Acetonitrile, 0.1% FA

Mass load:

1.5 μg for intact analysis 2.5 μg for peptide map

Intact analysis gradient table:

Time (min)

Flow rate (min)

%A

%B

Initial

0.300

95.0

5.0

2.00

0.300

90.0

10.0

22.00

0.300

70.0

30.0

23.00

0.300

20.0

80.0

24.00

0.300

20.0

80.0

24.01

0.300

95.0

5.0

30.00

0.300

95.0

5.0

Peptide map gradient table (Geometrically scaled from USP Monograph):

Time (min)

Flow rate (min)

%A

%B

Initial

0.300

90.0

10.0

41.68

0.300

30.0

70.0

45.16

0.300

0.0

100.0

48.63

0.300

0.0

100.0

50.00

0.300

90.0

10.0

60.00

0.300

90.0

10.0

ACQUITY QDa Detector settings:

Mass range:

350–1,250 m/z

Mode:

ESI+

Collection mode:

Continuum

Sample rate:

2 points/sec

Cone voltage:

10 V

Probe temp.:

500 °C

Capillary voltage:

1.5 kV

Informatics:

Empower 3

Results and Discussion

Impurity assessment via intact analysis

Separation of intact insulin was optimized to achieve a high peak-to-peak resolution with acceptable signal response. Figure 2 shows the optimized separation of intact insulin with orthogonal mass detection. Insulin was resolved from its preservative, m-cresol, along with peptide impurities via a 20 minute gradient from 20% B to 30% B. Optical artifacts, such as the m-cresol peak (MW = 108.14 Da), were eliminated by setting the m/z detection window from 350 to 1250 (Figure 2B). The addition of the ACQUITY QDa Detector also improved the detection of impurities in insulin, as shown in the inset zoom-in chromatograms. The signal-to-noise ratio (SNR) for the most abundant impurity at 13.4 minutes (peak 4) was 8-fold higher (SNR = 84) using the ACQUITY QDa when compared to the TUV (SNR = 10). MS detection allows for a lower detection limit compared with UV detection. UV detection enables the monitoring and analysis of low abundance impurities present in insulin samples or newly developed biosimilars that may otherwise be overlooked in UV-based analyses alone.

Figure 2. Optimized separation of insulin drug with orthogonal mass detection. A) UV detection at 215 nm; B) MS detection by ACQUITY QDa Detector. MS scan range was set from 350 to 1250 m/z to filter out signal from the preservative, m-cresol. Zoom-in chromatograms show improved sensitivity for detecting impurities (peak 1–4) with the ACQUITY QDa Detector.

Comparability analysis

The above LC-UV/MS workflow was applied to the analyses of three insulin drugs from different sources to test comparability amongst insulin and its analogues. As shown in Figure 3 (TUV), the main peak of insulin exhibited highly reproducible retention times and peak widths (FWHM) across the three samples. As before, the low abundance of impurities combined with the baseline noise of the optical detector could result in misinterpretation of chromatographic profiles. This misinterpretation could lead to the conclusion that these three insulin samples are highly similar. However, the benefit of an LC-UV/MS workflow is demonstrated through the addition of the ACQUITY QDa in this analysis.

Figure 3. Evaluation of comparability of insulin drug. Separation of three samples of insulin using the LC-UV/MS workflow with a 20 minute gradient from 20% B to 30% B are shown. Retention times of insulin among different samples were highly reproducible. MS spectra collected by the ACQUITY QDa show that Sample 3 has different molecular weight compared to the other two samples. Different impurity profiles were detected for each batch using the ACQUITY QDa. Insulin Sample 1 and 2 have similar impurity profiles except the presence of peak 1 in Sample 1. The impurities in Sample 3 have different masses and lower abundance compared to the other two samples.

The simultaneous acquisition of MS data affords the opportunity to interrogate the samples at a molecular level. As shown in Figure 3 (ACQUITY QDa), using the MS spectra charge states, the masses of the main insulin peaks were calculated to be  5,808 Da, 5,808 Da, and 5,823 Da, respectively; suggesting that insulin from the third supplier might be a different analogue despite having a nearly identical retention time as the other two samples. In addition, differences in the relative abundance and number of impurities across the three samples are more apparent due to the increased sensitivity of the MS detector. The vertically expanded chromatograms show that the impurity profiles (peak 1–4) for Sample 1 and 2 have subtle differences, such as the absence of peak 1 in insulin Sample 2. Furthermore, the impurities in Sample 3 were observed to be less abundant compared to the other two samples, suggesting this sample was manufactured differently. These data demonstrate, as an orthogonal detection technique, the ACQUITY QDa provides the specificity and sensitivity needed to evaluate subtle differences in insulin biosimilars and analogues improving confidence in data interpretation and product quality.

Identity test via peptide mapping

Recently, the ACQUITY QDa Detector has been successfully used in a validated method for identity testing of therapeutic mAbs.8 In a similar approach; we adapted the standard procedures of enzyme digestion and LC separation as outlined in USP Monograph: human insulin for insulin analysis as an identity test using an LC-UV/MS based workflow. Modification to the monograph included using formic acid in lieu of sulfate buffer as a mobile phase additive for MS compatibility, and geometrically scaling the gradient for compatibility with UPLC Instrumentation. As shown in Figure 4, the digested peptides were well resolved for all three samples in a 15 minute elution window. Based on MS data, the top five most abundant peaks were identified as proteolysis fragments of insulin, whose amino acid sequences are listed in Table 1. Fragment F1 and F3 in all three samples of insulin showed identical retention time while differences were found for fragment F2, F2’, and F4 between Sample 3 (Table 1: red highlight) and Sample 1, 2  (Table 1: orange highlight). The inconsistency in retention times was caused by the change of a single amino acid in the sequence of fragment F2, F2’, and F4 of Sample 3, and was confirmed by the delta mass differences of 14.08 Da (N→K) and 100.17 Da (KT→E) for the fragments based on MS data. This experiment demonstrates that “finger-print” like analyses such as these can be used successfully as an identity test at a molecular level for small biotherapeutics such  as insulin and are well suited for identifying potential differences in biosimilar products. Collectively, these results demonstrate that the ACQUITY QDa Detector enables an efficient LC-UV/MS workflow with improved productivity that saves time, sample, and resources in routine insulin analysis. 

Figure 4. Peptide mapping of three samples of insulin with orthogonal MS detection. Sample digestion and separation method were followed using the procedure in USP monograph of human insulin with minimum modification. F1–F4 are insulin digest fragments (amino acid sequence shown in table 1). A byproduct of the enzymatic treatment was observed with the generation of a pyroglutamic acid derivative of F2 and is labeled as F2’. Significant retention time differences for F2, F2’, and F4 were observed between sample 3 (Red), and sample 1  and 2 (Orange) due to different amino acid sequences.
Table 1. Amino acid sequence of insulin digest fragments after S. aureus digestion. Sample 1 and 2 have the same sequence for all fragments, while AsnB3 on F2 and LysB29 on F4 (Orange) are replaced by Lys and Glu for sample 3 (Red). The replacement of Glu adds an additional cleaving site which leads to the absence of ThrB30 on F4 in sample 3.

Conclusion

In this application note, an LC-UV/MS workflow was developed for insulin analysis using the ACQUITY QDa as an in-line mass detector. The addition of MS detection increased sensitivity for intact insulin separation, which enabled the analysis of low abundance impurities and allowed high throughput identity test of insulin. The orthogonal detection system was compatible with the USP standard method for peptide mapping, which was demonstrated by the identification of insulin between three commercial drugs. To conclude, the ACQUITY QDa Detector demonstrated improved sensitivity and specificity for insulin analysis, which offers a cost-effective means to increase the productivity and confidence for quality control of insulin drugs.

References

  1. Hsu, J., et al. Identification of recombinant insulin analogues by peptide mapping method. Journal of Food and Drug Analysis. 2012, 20, 4:957–962.
  2. Human insulin market. Zion Market Research. 2016.
  3. FDA approves Basaglar, the first “follow-on” insulin glargine product to treat diabetes. FDA News Release. 2015.
  4. Clinical pharmacology data to support a demonstration of biosimilarity to a reference product. FDA, 2016.
  5. USP monograph: insulin human [11061–68–0]. 2015, Revision Bulletin.
  6. Heald, A. H., et al. Most commercial insulin assays fail to detect recombinant insulin analogs. The Annals of Clinical Biochemistry. 2006, 43:306–308.
  7. Whitworth, R. Mass Data Made Simple. Analytical Scientist. Issue 1216, 2015.
  8. Zhang, J., et al. Development and Validation of a Peptide Mapping Method for the Characterization of Adalimumab with QDa Detector. Chromatographia. 2016, 79:395–403.

720005970, April 2017

回到頁首 回到頁首