• 應用手冊

UPLC and APGC Multi Residue Pesticide Analysis on a Single Tandem Quadrupole Mass Spectrometer Platform

UPLC and APGC Multi Residue Pesticide Analysis on a Single Tandem Quadrupole Mass Spectrometer Platform

  • Kari L. Organtini
  • Gareth E. Cleland
  • Eimear McCall
  • Simon Hird
  • Waters Corporation

Abstract

This application note describes the analysis of a large suite of pesticides in fruit and vegetable extracts using both LC and GC on the same tandem quadrupole MS platform at legislatively relevant limits, with less than 30 minutes needed to switch between chromatographic inlets.

Utilizing the universal source of the Xevo TQ-S micro allows:

  • Analysis of large suites of pesticides in a single injection per chromatographic inlet.
  • Analysis of fruit and vegetable matrices at legislatively relevant levels of 0.010 mg/kg.
  • Fast and simple instrument method generation and maintainance using Quanpedia databases.This application note describes the analysis of a large suite of pesticides in fruit and vegetable extracts using both LC and GC on the same tandem quadrupole MS platform at legislatively relevant limits, with less than 30 minutes needed to switch between chromatographic inlets.

Utilizing the universal source of the Xevo TQ-S micro allows:

  • Analysis of large suites of pesticides in a single injection per chromatographic inlet.
  • Analysis of fruit and vegetable matrices at legislatively relevant levels of 0.010 mg/kg.
  • Fast and simple instrument method generation and maintainance using Quanpedia databases.

Benefits

Using the Xevo TQ-S micro Tandem Quadupole Mass Spectrometer with the Universal Source for pesticide analysis allows:

  • UPLC and APGC analysis of the sample extracts on a single tandem quadrupole mass spectrometer.
  • Analysis of large suites of pesticides in a single injection per chromatographic inlet.
  • Analysis of fruit and vegetable matrices at legislatively relevant levels of 0.010 mg/kg.
  • Easy generation of methods using the Quanpedia Database.

Introduction

Hundreds of pesticides are commercially available and approved for use on various fruit and vegetable plants, to prevent pest infestation and improve shelf-life of fresh produce. Maximum Residue Levels (MRLs) are set at the highest level of pesticide that the relevant regulatory body would expect to find in that crop when it has been treated in line with good agricultural practice. In the EU, if a pesticide is not explicitly mentioned in the MRL legislation, a default MRL is used for enforcement. This default value is set to be equal to the limit of quantification (LOQ) achievable with the analytical methods used for analysis. National authorities control and enforce MRLs by testing samples for pesticide residue levels using analytical surveillance programs. These programs check for compliance with MRLs, assess dietary exposure, and check for use of unauthorized pesticides. The food industry also carries out its own due diligence analyses.

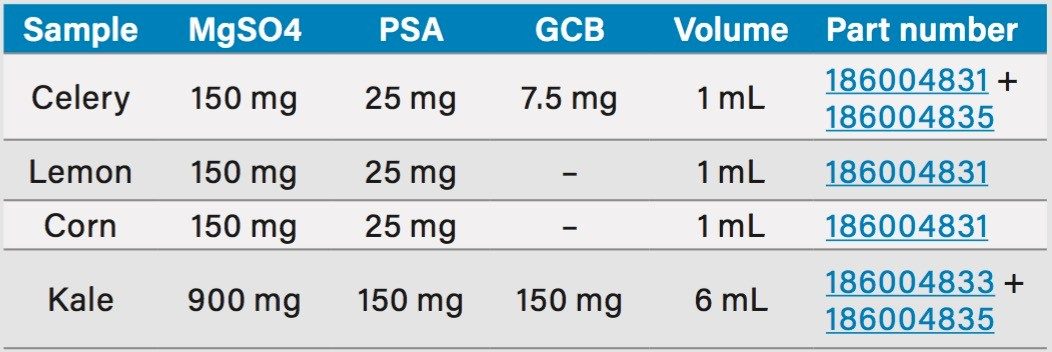
Mass spectrometry coupled with both gas (GC) and liquid chromatography (LC) is needed to provide comprehensive analysis of a wide range of pesticide residues with sufficient sensitivity to meet global MRL regulations. The use of Quick, Easy, Cheap, Efficient, Rugged and Safe (QuEChERS) sample extraction and clean up has streamlined analytical efficiencies for multi residue analyses.1 The advantage of ultra performance liquid chromatography (UPLC) coupled with tandem quadrupole mass spectrometry (MS/MS) for multi residue pesticide analysis is widely reported.2 More recently the use of GC-MS/MS operated at atmospheric pressure (APGC) has been shown to offer significant improvements in performance over electron impact (EI) for challenging pesticides, in terms of selectivity, specificity, and speed of analysis.3,4

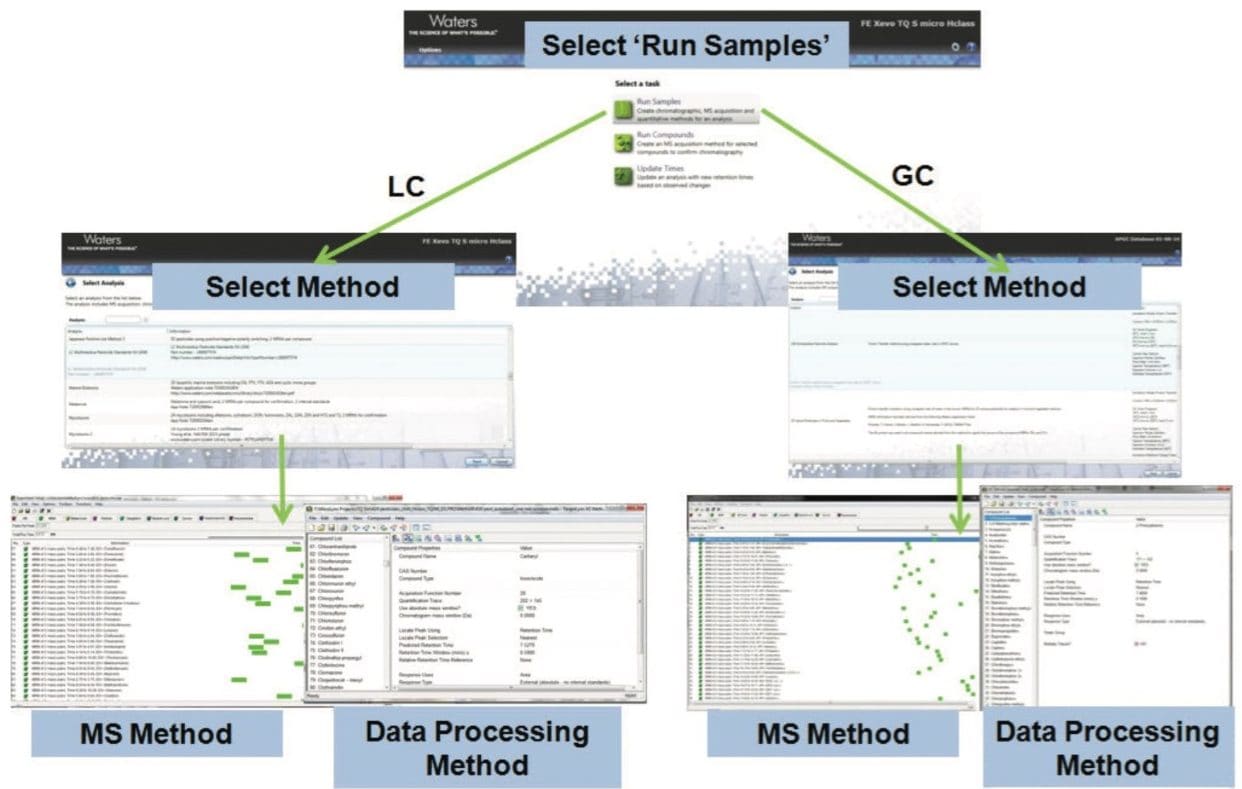
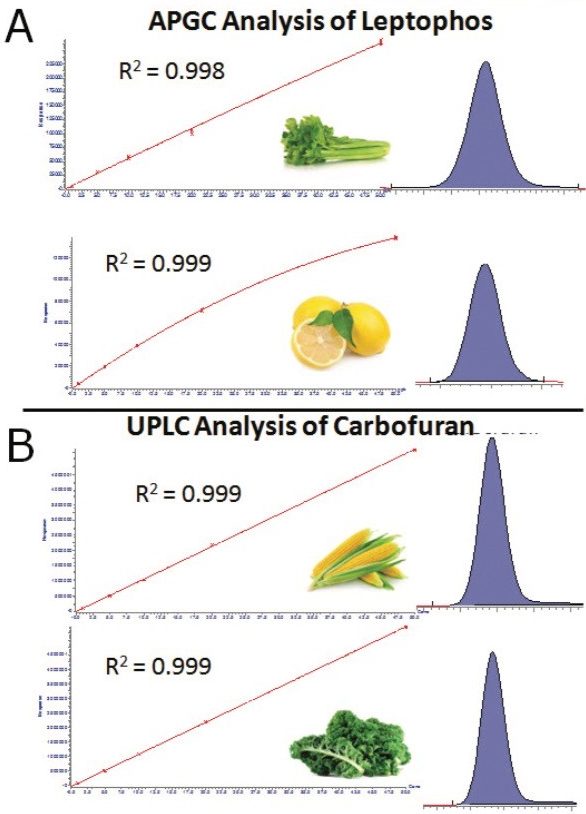
The APGC source ionizes compounds using a corona discharge at atmospheric pressure in an APCI-like manner. Therefore, this ionization mechanism is a much softer technique than classic electron impact (EI) ionization and produces larger amounts of intact parent ions, especially in the case of fragile or easily fragmented compounds. APGC ionization can occur using two mechanisms; proton transfer (wet source) or charge transfer (dry source). In proton transfer ionization, [M+H]+ ions are formed, whereas in charge transfer ionization, M+· ions are formed. In this application note, a single workflow for the multi residue analysis of pesticides is demonstrated on a variety of fruit and vegetable samples. Utilizing the universal source of Waters Xevo TQ-S micro allows for LC and GC analyses to be completed on the same tandem quadrupole MS instrument, with less than 30 minutes needed to switch between chromatographic inlets. The performance of the method will be highlighted in terms of sensitivity, repeatability, and linearity for both LC and GC in compliance with the SANTE guidelines (11945/2015) for pesticide analysis.5

Experimental

The LC and GC suites of pesticides analyzed in this study (listed in the Appendix) were chosen to cover a wide range of different pesticide classes and chemistries. The multi residue MS/MS methods were generated using Quanpedia, with separate databases utilized for generation of the LC and GC methods. Each database contains MRMs and retention time information for each compound. When the MS method is generated the MRM function windows are automatically set for each compound. For the UPLC method, a window of 1 minute was placed around each compound's expected retention time. For the APGC method, a window of 30 seconds was used due to the narrower peak widths exhibited in GC analysis. In addition to the MS methods, TargetLynx data processing methods and the LC inlet method were also generated through the Quanpedia Database.

Sample extraction and cleanup

Celery, lemon, corn, and kale samples were purchased at a local grocery store. Samples were chosen to be representative of different types of matrix complexity from different commodity groups, including high water content (celery and kale), high acid content (lemon), and high starch/protein with low water content (corn). Samples were immediately homogenized in a food processer and frozen until sample preparation was performed. QuEChERS extraction was performed according to the official AOAC method 2007.01 using the DisQuE QuEChERS, AOAC Method Sample Preparation Kit (p/n: 176002922).6 Figure 1 highlights the sample extraction.

Figure 1. DisQuE sample extraction method.
Table 1. dSPE cleanup conditions used for each sample matrix.

LC-MS/MS conditions

LC system:

ACQUITY UPLC H-Class

Column:

ACQUITY BEH C18, 1.7 μm 2.1 x 100 mm

Column temp.:

45 °C

Injection volume:

5 μL

Flow rate:

0.45 mL/min

Mobile phase A:

Water + 10 mM ammonium acetate

Mobile Phase B:

Methanol + 10 mM ammonium acetate

Gradient

Time (min)

%A

%B

0.0

98.0

2.0

0.25

98.0

2.0

12.25

1.0

99.0

13.0

1.0

99.0

13.01

98.0

2.0

17.0

98.0

2.0

MS conditions

MS system:

Xevo TQ-S micro

Ionization mode:

ESI+

Capillary voltage:

1 kV

Desolvation temp.:

500 °C

Desolvation gas flow:

1000 L/hr

Source temp.:

150 °C

GC-MS/MS conditions

GC system:

7890A

Autosampler:

CTC PAL

Column:

30 m x 0.25 mm x 0.25 μm Rxi-5MS

Carrier gas:

Helium

Flow rate:

2.0 mL/min

Injection:

Splitless

Injector temp.:

280 °C

Injection volume:

1 μL

Makeup gas:

Nitrogen at 250 mL/min

Transfer line temp.:

320 °C

Oven program

Rate

Temp.

Hold

(°C/min)

(°C)

(min)

80.0

1.0

25.0

150.0

0.0

8.0

270.0

0.0

20.0

320.0

4.1

MS conditions

MS system:

Xevo TQ-S micro

Ionization mode:

API+

Ionization mechanism:

Proton transfer (3 vials of water in source)

Corona current:

20 μA for first 3.5 min

3.0 μA for rest of run

Cone gas flow:

0 L/hr

Auxiliary gas flow:

250 L/hr

Source temp.:

150 °C

Results and Discussion

Method management using the Quanpedia database

Working with methods involving large numbers of compounds can be time consuming when done manually and is prone to errors when setting up time segmented acquisition. Quanpedia is a compound centric database, typically used for method generation, but can also function as a method management tool. Initial methods for this analysis were generated using existing UPLC and APGC databases (Figure 2). Retention time changes resulting from further method development or method changes wereupdated in the database. This allowed for immediate and automatic updates to be made in the MS and processing methods by just re-generating the methods in three simple clicks.

Figure 2. Quanpedia databases that were used to manage the methods for both UPLC and APGC analysis demonstrating the three click workflow of method generation.

Rapid and robust data aquisition

For successful analysis of large numbers of pesticides and their metabolites, it is important that the mass spectrometer can maintain sufficient sensitivity while acquiring MRM transitions with a fast scan speed to provide enough data points across each chromatographic peak (e.g. minumum of 12 points per peak). The fast scanning speeds of the TQ-S micro allow for this robust and rapid data acquisition while maintaining large retention time windows to accommodate any shift in retention time due to column maintenance (GC) or chromatography changes caused by the different matrices.6 Figure 3 highlights one of the busiest sections of the APGC MS Method. In this example, flutolanil is just one of approximately 30 pesticides (set across 30 channels, each acquiring at least two transitions per compound) eluting in a 1.5 minute time window. The dwell time calculated by the autodwell function to collect a minimum of 12 points per peak was 0.006 s. The resulting chromatogram of three replicate injections of 0.010 mg/kg of flutolanil in celery matrix can be seen in Figure 3. Even with the fast scanning speed, 19 points were collected across the peak and the RSD of three consecutive injections in matrix was 5.2%. The same is true for the UPLC method used for this analysis.

Figure 3. Demonstration of the fast scanning of the Xevo TQ-S micro demonstrating retention of peak quality at a fast scan time.

Pesticides in matrix

Matrix matched standards were prepared in celery, lemon, corn and kale over a range of 0.001 to 0.050 mg/kg and replicate injections made using the UPLC and APGC methods. A summed MRM overlay of a selection of pesticides can be seen in Figure 4,  showing 0.010 mg/kg in celery extract from both the (A) APGC and (B) UPLC analyses. The data were fitted with the best fit calibration; for the UPLC data, the response was shown to be linear whereas the APGC response over the range investigated was non-linear and so was fitted with a quadratic calibration. The majority of the compounds in both analysis methods had correlation coefficient (R2) values of 0.995 or greater. Figure 5 shows the matrix matched calibration curves and the peak response at 0.001 mg/kg of a representative pesticide from each analysis method in the four matrices. Residuals from triplicate injections at each calibration point were within ±20%. Ion ratios were also shown to be within 30% tolerance of the reference values.

Figure 4. Overlay of a selection of pesticides at 0.010 mg/kg analyzed in a celery extract on A. APGC, and B. UPLC.
Figure 5. Matrix matched calibration curves and chromatograms for standards at 0.001 mg/kg for peaks from: A. APGC analysis of leptophos in celery and lemon; and B. UPLC analysis of carbofuran in corn and kale.

For convenience, all sample extracts were spiked at the default MRL of 0.010 mg/kg. Figure 6 demonstrates the percentage of pesticides in each method detected in the spiked matrices at 0.010 mg/kg. However many pesticides could also be detected at 0.001 mg/kg as demonstrated in Figure 5 showing leptophos (APGC compound) and carbofuran (UPLC compound) in the different matrices. The precision of the measurements was excellent with more than 90% of the detected pesticides exhibiting RSDs of peak area of less than 10% (n=3). The exception was the APGC analysis of the kale matrix which had more than 80% of pesticides exhibiting RSDs less than 10% (Figure 7).

Figure 6. The percentage of pesticides detected in the 0.010 mg/kg standard for each matrix using both APGC and UPLC.
Figure 7. Percentage of compounds detected at 0.010 mg/kg in each matrix and associated RSDs.

Conclusion

Complex multi residue pesticide analysis was demonstrated using both UPLC and APGC analysis on the same tandem quadrupole instrument (Xevo TQ-S micro). Instrument methods were generated and maintained using Quanpedia databases making method generation and maintenance fast and simple. Although the multi residue methods contained approximately 200 compounds each, the reliable scanning speed of the TQ-S micro produced accurate and precise measurements. The performance for the determination of pesticide residues analyzed in four matrices of varying complexity complied with the SANTE guidelines for pesticide residue analysis. Detection at the EU default maximum residue limit of 0.010 mg/kg was easily achieved for >99% of pesticides analyzed with good precision (RSDs <10%) for most analytes in the food samples. Having the flexibility of the Universal Source architecture to provide access to both UPLC-MS/MS and GC-MS/MS on the same instrument, allows for an increase of laboratory efficiency, while maintaining required sensitivity and repeatability.

References

  1. D Shah, E McCall, G Cleland. Single LC-MS/MS Method for Confirmation and Quantification of Over 400 Pesticides in a Complex Matrix Without Compromising Data Quality. Waters Application Note no. 720005559EN. January, 2016.
  2. T Kovalczuk, M Jech, J Poustka, J Hajslova. UPLC-MS/MS: A Novel Challenge in Multiresidue Pesticide Analysis in Food, Analytica Chimica Acta, 577, 2006.
  3. M Tienstra, T Portoles, F Hernandez, J G J Mol. Fast Gas Chromatographic Residue Analysis in Animal Feed Using Split Injection and Atmospheric Pressure Chemical Ionisation Tandem Mass Spectrometry. J. Chrom. A. 1422, October, 2015.
  4. L Cherta, T Portoles, J Beltran, E Pitarch, J G Mol, F Hernandez. Application of Gas Chromatography-Mass Spectrometry with Atmospheric Pressure Chemical Ionization for the Determination of Multiclass Pesticides in Fruits and Vegetables. J. Chrom. A. 1314: 224–240, November, 2013.
  5. European Commission. SANTE/11945/2015. Guidance Document on Analytical Quality Control and Method Validation Procedures for Pesticides Residues Analysis in Food and Feed. 2015, rev. 0.
  6. AOAC Official Method 2007.01: Pesticide Residues in Foods by Acetonitrile Extraction and Partitioning with Magnesium Sulfate. 2013.

Appendix

720006013, May 2017

回到頁首 回到頁首