Development of a Multi-Toxin UPLC-MS/MS Method for 50 Mycotoxins and Tropane Alkaloids in Cereal Commodities
Abstract
In this application note we describe the performance of a multi-toxin UPLC-MS/MS method for 50 regulated and emerging mycotoxins, atropine, and scopolamine in cereal-based products. The high sensitivity tandem quadrupole mass spectrometer, the Xevo TQ-XS, was used in combination with an ACQUITY UPLC System to reach very low limits of detection and quantification. A mix of cereal flours was extracted using a simple “dilute-and-shoot” protocol, without any clean-up or internal standards. Calibration curves were plotted using solvent standards and spiked extract (matrix-matched calibration). Limits of detection and quantification were shown to be suitable for checking compliance with regulatory limits and to investigate the levels of other toxins. The lowest method limit of quantification (m-LOQ) was for aflatoxins (0.1 µg/kg). The calibration range was acceptable and covered three orders of magnitude for most analytes. Matrix effects were also calculated for all compounds and were found to be significant, illustrating the need for matrix-matched calibration. The method fulfilled the criteria set out in the SANTE guidelines for mycotoxins. Data was imported into the new waters_connect for quantitation software and processed with the MS Quan app for an improved efficiency in data processing and review.
Benefits
- Simultaneous determination of more than 50 mycotoxins and plant toxins in a single LC-MS/MS method
- The lowest recorded limits of detection are achieved using the high sensitivity Xevo TQ-XS
- Remarkable sensitivity and good linearity and repeatability were obtained, thus fulfilling regulatory requirements
- The MS Quan application with the new waters_connect for quantitation software, reduces the time taken to process data and review results
Introduction
Mycotoxins are naturally occurring, secondary metabolites produced by various molds. These compounds are toxic to humans and animals. Typically, mycotoxins are explicitly produced by fungi and their parent structure is often modified by the fungus itself which releases a cocktail of structurally related compounds. During infection, these substances are then often further modified by the host plant of the fungus. The living plant might change the chemical structure of toxins and produce so-called masked mycotoxins. The formation of these masked toxins is a major detoxification strategy of crops, as they are less toxic for the plant. To ensure food and feed safety, many countries have established regulatory limits for mycotoxins in crops. These regulations only cover some of the known mycotoxins such as aflatoxins B1, B2, G1, G2, and M1; fumonisins B1, B2, and B3; ochratoxin A, deoxynivalenol, zearalenone, HT-2 toxin, T-2 toxin, tropane alkaloids, and ergot alkaloids.1
Ongoing studies provide a steady stream of insights about newly discovered mycotoxin metabolites as do plant breeding efforts adapting to a changing climate. Risk assessment studies are currently underway in preparation for legislation, if deemed necessary. These compounds are often referred to as “emerging mycotoxins”.2 The term “masked mycotoxin” was originally used to refer to conjugated mycotoxin metabolites, but this group are now more accurately known as “modified mycotoxins” and include any metabolites of the parent mycotoxins.3 Evidence of incidence of both emerging and modified mycotoxins is rapidly increasing and has demonstrated that they can occur in high frequency and sometimes also in high concentrations in cereals and in other food- and feedstuffs.4
Some of these emerging and modified mycotoxins, and plant toxins are already regulated, and more action is likely at some stage in the future. The demand for testing for these three types of toxins has significantly increased over the last decade, in part carried out by the food/feed industry for due diligence, but also as a response to calls for data on occurrence. Hence, there is a need to extend the scope of analysis to cover these compounds. In this work, we describe the performance of an extension to the scope of the earlier application note,5 to provide a multi-toxin quantitative method for analysis of cereal-based foods using the high sensitivity of the Xevo TQ-XS.
Experimental
Sample Extraction
A mixture of wheat, barley, rice, and maize flours was extracted using a procedure based on a previous work.5,6 Briefly, 5.0 g of homogenized sample were placed in a 50 mL plastic centrifuge tube and extracted with 20 mL of 80:20 MeCN:H2O containing 0.75% of acetic acid and 0.2% of formic acid (v/v), on an automated Vortex for 10 minutes. After centrifugation for 6 minutes at >5000 g, 150 µL of supernatant were transferred into a LC vial, followed by the addition of 1350 µL of water (1:10 dilution) and filtered (glass fiber syringe filter) prior to LC-MS/MS. Overall dilution factor equals 40.
Preparation of Calibration Standards
Two series of calibrants were prepared:
- Solvent-based standards were prepared by serial dilutions of a Stock Mix solution, maintaining a solvent composition of H2O:MeCN 95:5 (v/v)
- Matrix-matched standards were prepared over the same range by serial dilutions of a Stock Mix solution with a blank sample extract.
LC Conditions
|
Chromatographic system: |
ACQUITY UPLC I-Class PLUS (with binary solvent manager) |
|
Autosampler and injector: |
Flow-Through Needle injector (FTN) with 15 µL needle size |
|
Column: |
ACQUITY UPLC BEH C18 (2.1 × 100 mm, 1.7 µm particle size, 130 Å pore size, p/n: 186002352) |
|
Aqueous mobile phase: |
1 mM Ammonium acetate in water with 0.5% acetic acid and 0.1% formic acid (v/v) |
|
Organic mobile phase: |
Methanol + 0.5% acetic acid + 0.1% formic acid (v/v) |
|
Needle wash solvent: |
Water:methanol:acetonitrile:isopropanol:acetone, 20:20:20:20:20 and 1% formic acid (volumetrically) |
|
Seal wash solvent: |
Water:acetonitrile 80:20 (v/v) |
|
Column temp.: |
40 °C |
|
Sample temp.: |
15 °C |
|
Injection volume: |
5 µL |
|
Flow rate: |
0.40 mL/min |
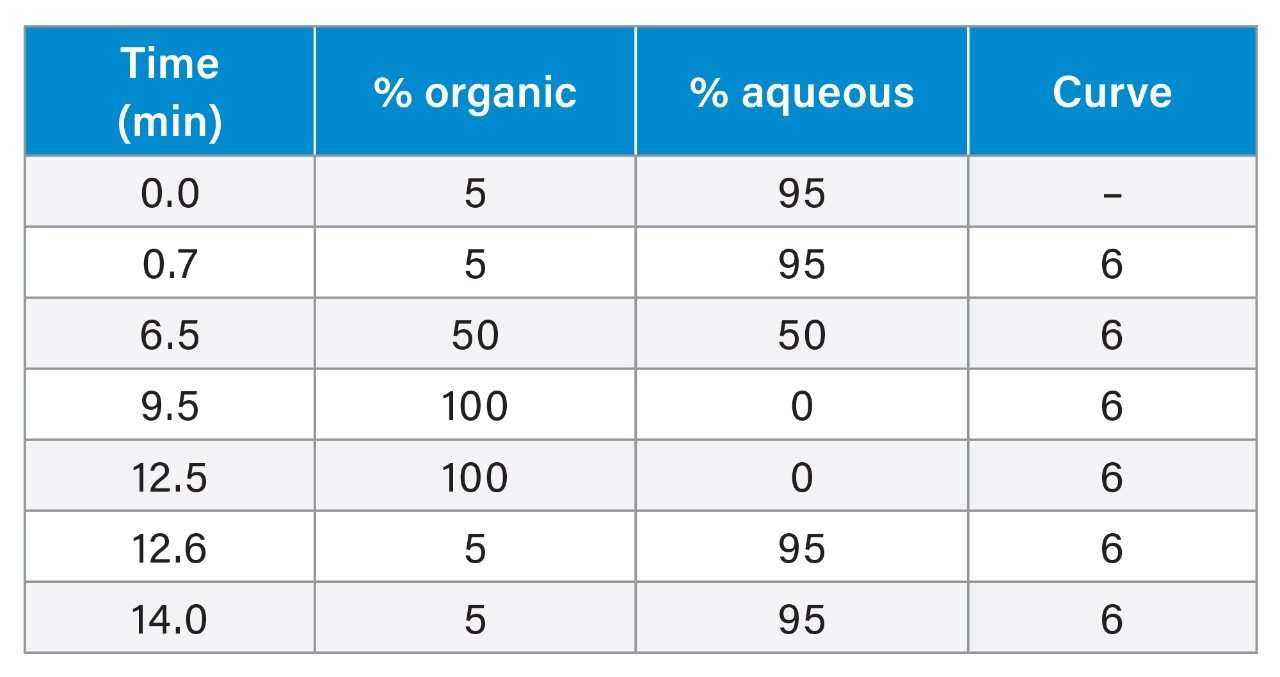 Table 1. UPLC gradient.
MS Conditions
|
Mass spectrometry system: |
Xevo TQ-XS |
|
Ionization mode: |
ESI+/- (polarity switching) |
|
Acquisition mode: |
Multiple Reaction Monitoring (MRM) |
|
Capillary voltage: |
+0.75/-0.30 kV |
|
Source offset: |
30 V |
|
Cone gas flow: |
200 L/Hr |
|
Desolvation temp.: |
600 °C |
|
Desolvation gas flow: |
1100 L/Hr |
|
Source temp.: |
150 °C |
|
Data acquisition software: |
MassLynx v4.2 |
|
Data processing software: |
waters_connect for quantitation (MS Quan application) |
Optimized MRM transitions, cone voltages, and collision energies are reported in the Appendix.
Results and Discussion
Chromatography
With the exception of moniliformin (0.71 minutes retention time), all compounds presented two MRM transitions and a retention time more than twice the retention time corresponding to the void volume of the column (Vd ~0.55min), as per SANTE guidelines.7 Moniliformin is very different from other mycotoxins since it is a small, highly polar, acidic molecule, so its determination using Hydrophilic Interaction Chromatography (HILIC) would be a better approach for any confirmation analysis. The retention times of all the analytes were observed to be very stable with no variation greater than ±0.03 minutes within each sequence.
Good chromatographic separation was achieved for almost all the targeted compounds using the previously developed UPLC Method. This enabled the optimization of the MRM acquisition windows to minimize function overlap, thus maximizing dwell times. The resolution of chromatographic peaks, coupled to the high sensitivity of the Xevo TQ-XS, allowed the inclusion of 50 compounds within the same MS method. Two representative chromatograms of cereal extracts spiked with the targeted compounds are shown in Figure 1.
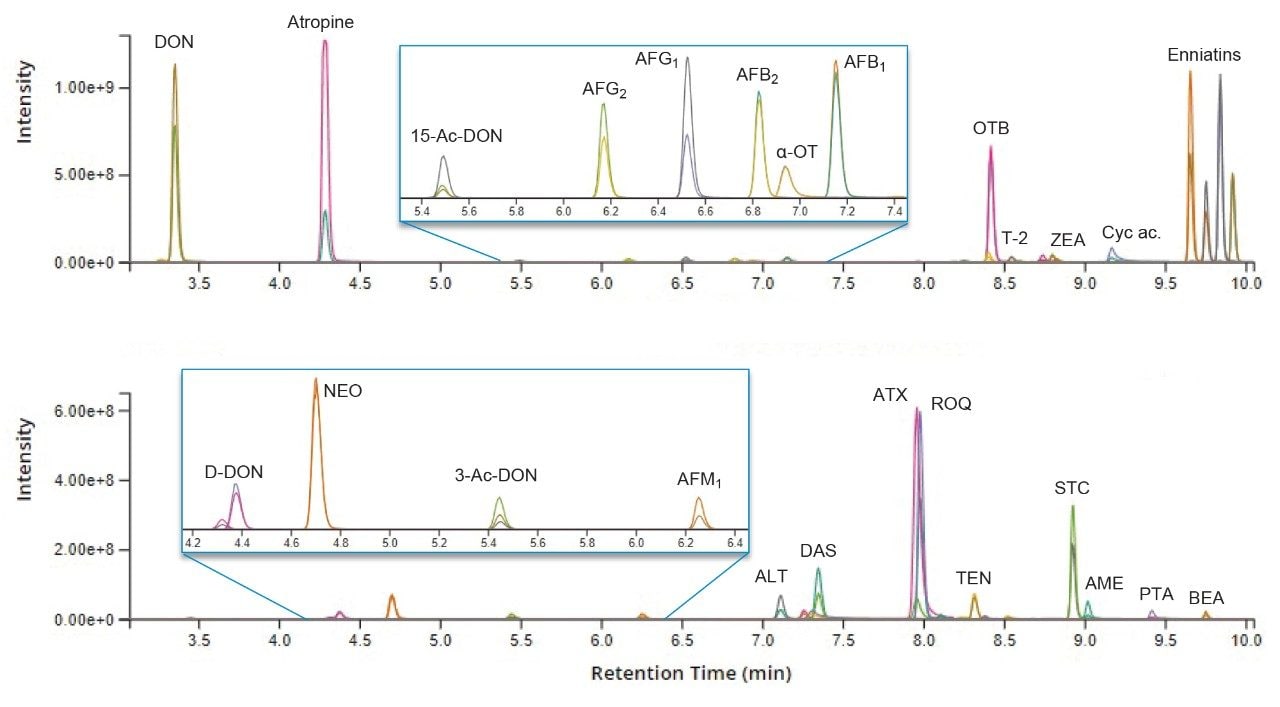 Figure 1. Chromatograms of the tested mycotoxins and plant toxins in two different spiked cereal samples. Each peak is characterized by a quantifier and a qualifier ion trace.
Sensitivity and Quantification
Chromatographic peaks corresponding to the limit of detection and quantification provided a (S/N) greater than three and ten, respectively (noise range settings: peak-to-peak, with no extra processing).
From the analysis of solvent calibrants, extremely low instrument limits of detection (i-LOD) were achieved. For example, an i-LOD of 0.0003 ng/mL was determined for aflatoxins B1, B2, G1, G2, and M1. The method limits of quantification (m-LOQ), the lowest level of the matrix-matched standards with S/N>10 and which pass calibration acceptance criteria (R2≥0.99 and residuals ≤20%), were as low as 0.1 µg/kg for aflatoxins; ≤1 µg/kg for ochratoxins, sterigmatocystin, beauvericin, enniatins, atropine, scopolamine, and roquefortine C; while for the remaining compounds m-LOQs were ≤10 µg/kg, with the exception of nivalenol, zearalanone, and penitrem A. The results in Table 2 show the sensitivity and quantitative characteristics of the method for all 50 compounds.
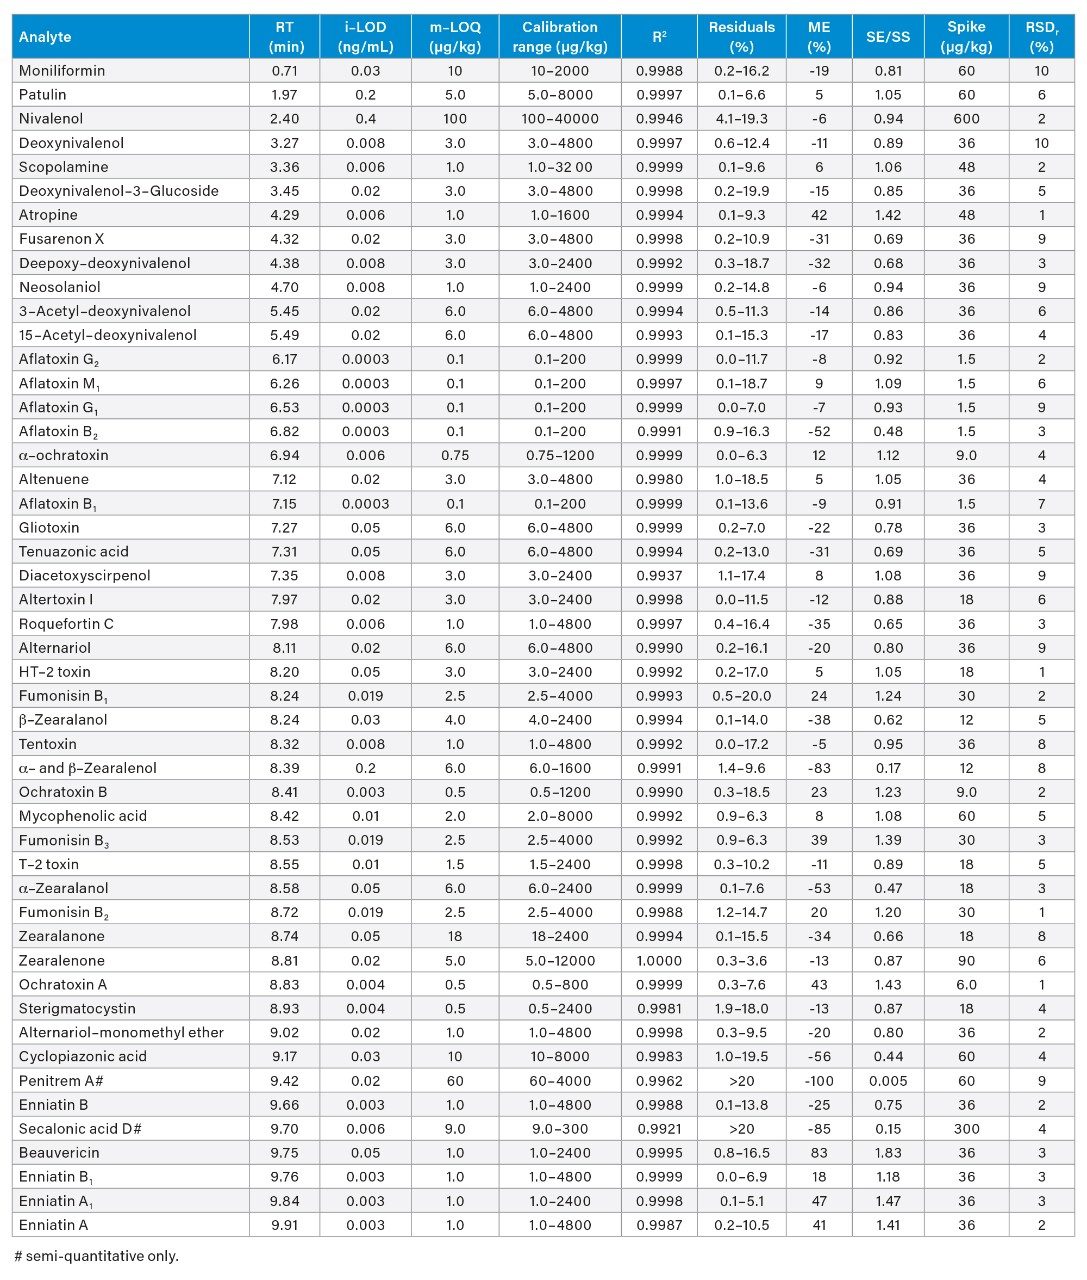 Table 2. A summary of the parameters used to evaluate the performance of the LC-MS/MS method. RT = Retention Time; i-LOD = instrument limit of detection; m-LOQ = method limit of quantification; R2 = coefficient of determination; ME = Matrix Effect; SE/SS = Signal Enhancement or Signal Suppression factor; Spike = concentration spiked to the sample to determine repeatability; RSDr = Percentage Relative Standard Deviation under repeatability conditions.
The range of the calibration graphs was three orders of magnitude for most analytes. Coefficients of determination (R2) of both solvent and matrix-matched calibration curves were almost all >0.99, and the calibration range was determined using only the standards with percentage residuals lower than 20%. Details of the calibration characteristics can be found in Table 2.
In Figure 2, the chromatograms of a mixed cereal extract spiked with aflatoxin B1 and ochratoxin A at the m-LOQ level are shown. The respective matrix-matched calibration graphs are given in Figure 3.
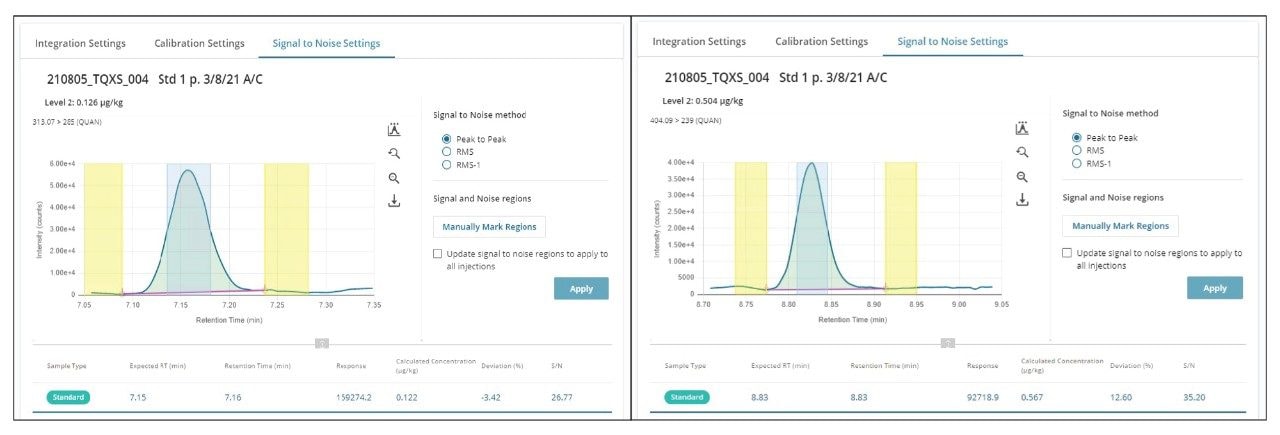 Figure 2. Chromatograms from the analysis of matrix-matched standards showing aflatoxin B1 (0.1 µg/kg) and ochratoxin A (0.5 µg/kg) in the mixed cereal extract. For the calculation of signal-to-noise, the software algorithms automatically identified the signal (green) and noise regions (yellow).
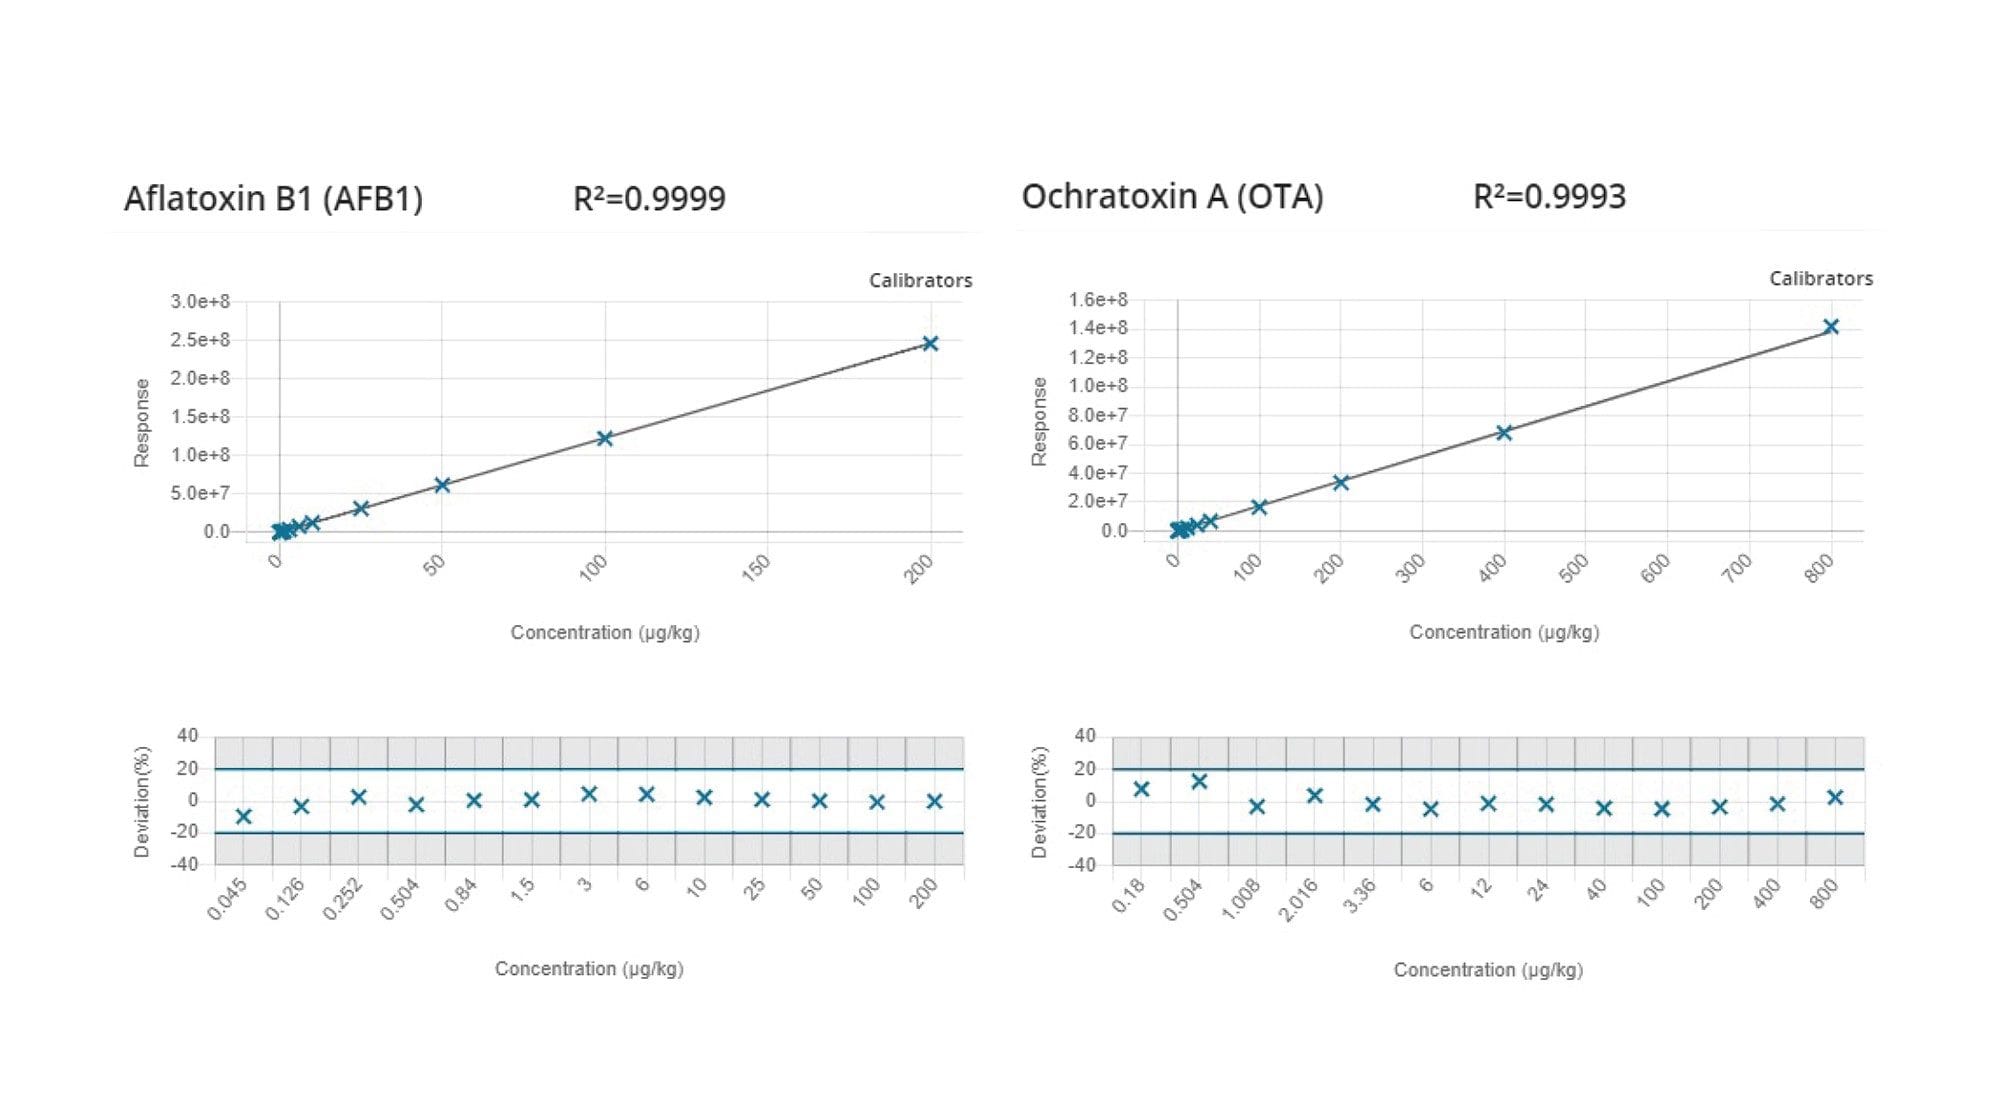 Figure 3. Matrix-matched calibration curves and residual plots for aflatoxin B1 and ochratoxin A.
Matrix Effect
The matrix effects (%ME) were calculated for each analyte as follows:

Where bM and bS are the slope of the matrix-matched and solvent calibration curves, respectively.
Signal enhancement/suppression factors (SE/SS) were calculated as the ratio bM/bS.
Matrix effects ranged from -100 to +83%. Signal enhancement factors were between 1.05 and 1.83, while signal suppression factors were between 0.95 and 0.005.
The significant variation in the magnitude of matrix effects observed confirmed that the use of matrix-matched calibration is essential to compensate for matrix effects and to achieve a reliable quantification. Alternatively, 13C-labelled internal standards could be used.5,6
Matrix effects are often caused by the presence of matrix co-extractives. For complex food matrices, it is advisable to include an effective sample clean-up step or significant dilution of extracts to increase method robustness, minimize instrument down-time due to instrument maintenance, and extend the column lifetime. An example of an effective SPE clean-up protocol is described in a previous work (p/n: 720007377EN).8
Repeatability and Identificaton Criteria
For the assessment of the repeatability of the LC-MS/MS method, six test portions of a sample composed of a mixture of wheat, barley, rice, and maize flours were spiked with the target mycotoxins and plant toxins at concentrations equivalent to level #5 of the calibration curve (see Table 2). Each test portion was extracted and analyzed. Values for relative standard deviation (%RSDr) were ≤10% for all analytes. In each case, ion ratios and retention times from the spiked test portions agreed well with the criteria specified in the SANTE guidelines, for all compounds.7
Conclusion
This UPLC-MS/MS method is suitable for the quantitative determination of regulated mycotoxins, regulated tropane alkaloids, as well as a range of emerging and masked mycotoxins. Where available, the use of 13C-labelled internal standards is recommended as an alternative to matrix-matched calibration.
The ultimate sensitivity of the Xevo TQ-XS allows considerably dilution of the sample extract while still reaching extremely low limits of quantification. This in turn reduces the need for complicated sample preparation and as demonstrated herein, a simple and quick dilute-and-shoot approach can be applied. Nevertheless, the implementation of a clean-up step, such as a SPE pass-through using the Oasis PRiME HLB SPE Cartridge, is an option to reduce the content of matrix co-extractives prior to injection, thus increasing method and instrument robustness.
The effective UPLC separation, combined with the high sensitivity and selectivity of the tandem quadrupole mass spectrometer, provides opportunities to expand the method further to include more analytes as and when required in the future.
Finally, the introduction of waters_connect for quantitation software, allows to maximize efficiency in data processing and to review and report quantitative results more quickly.
References
- Eskola, et al. Worldwide Contamination of Food-Crops With Mycotoxins: Validity of the Widely Cited ‘FAO Estimate’ of 25%. Crit. Rev. Food. Sci. Nutr. 60(16):2773–2789. 2020.
- Gruber-Dorninger et al. Emerging Mycotoxins: Beyond Traditionally Determined Food Contaminants. J. Agric. Food Chem. 65(33):7052–7070. 2017.
- Freire and Sant’Ana. Modified Mycotoxins: An Updated Review on Their Formation, Detection, Occurrence, and Toxic Effects. Food Chem. Toxicol. 111:189–205. 2018.
- de Nijs et al. Short Inventory of EU Legislation on Plant Toxins in Food. World Mycotoxin J. 9: 129–139. 2017.
- Nicola Dreolin, Sara Stead. LC-MS/MS Method Development and Validation for the Quantitative Determination of Regulated Mycotoxins in Cereal Grain Flours Using Simplified Sample Preparation Conditions on Xevo TQ-XS. Waters Application Note 720006685EN, revised 2021.
- Nicola Dreolin, Janitha De-Alwis, Dimple D. Shah, Joanne Williams, Sarah Dowd, Nicole Baumgarten, Stuart Adams, Simon Hird. Evaluation of the Performance of a Simple Method for Regulated Mycotoxins in Cereals by LC-MS/MS Using an Interlaboratory Study. Waters Application Note, 720007165EN, 2021.
- SANTE 12089/2016. Guidance Document on Identification of Mycotoxins in Food and Feed.
- Nicola Dreolin, Sara Stead, Simon Hird, Timothy Jenkins. Determination of Regulated and Emerging Mycotoxins in Cereals, Nuts, Figs, and Animal Feeds Using Pass-through SPE and UPLC-MS/MS. Waters Application Note, 720007377EN, 2021.
Appendix
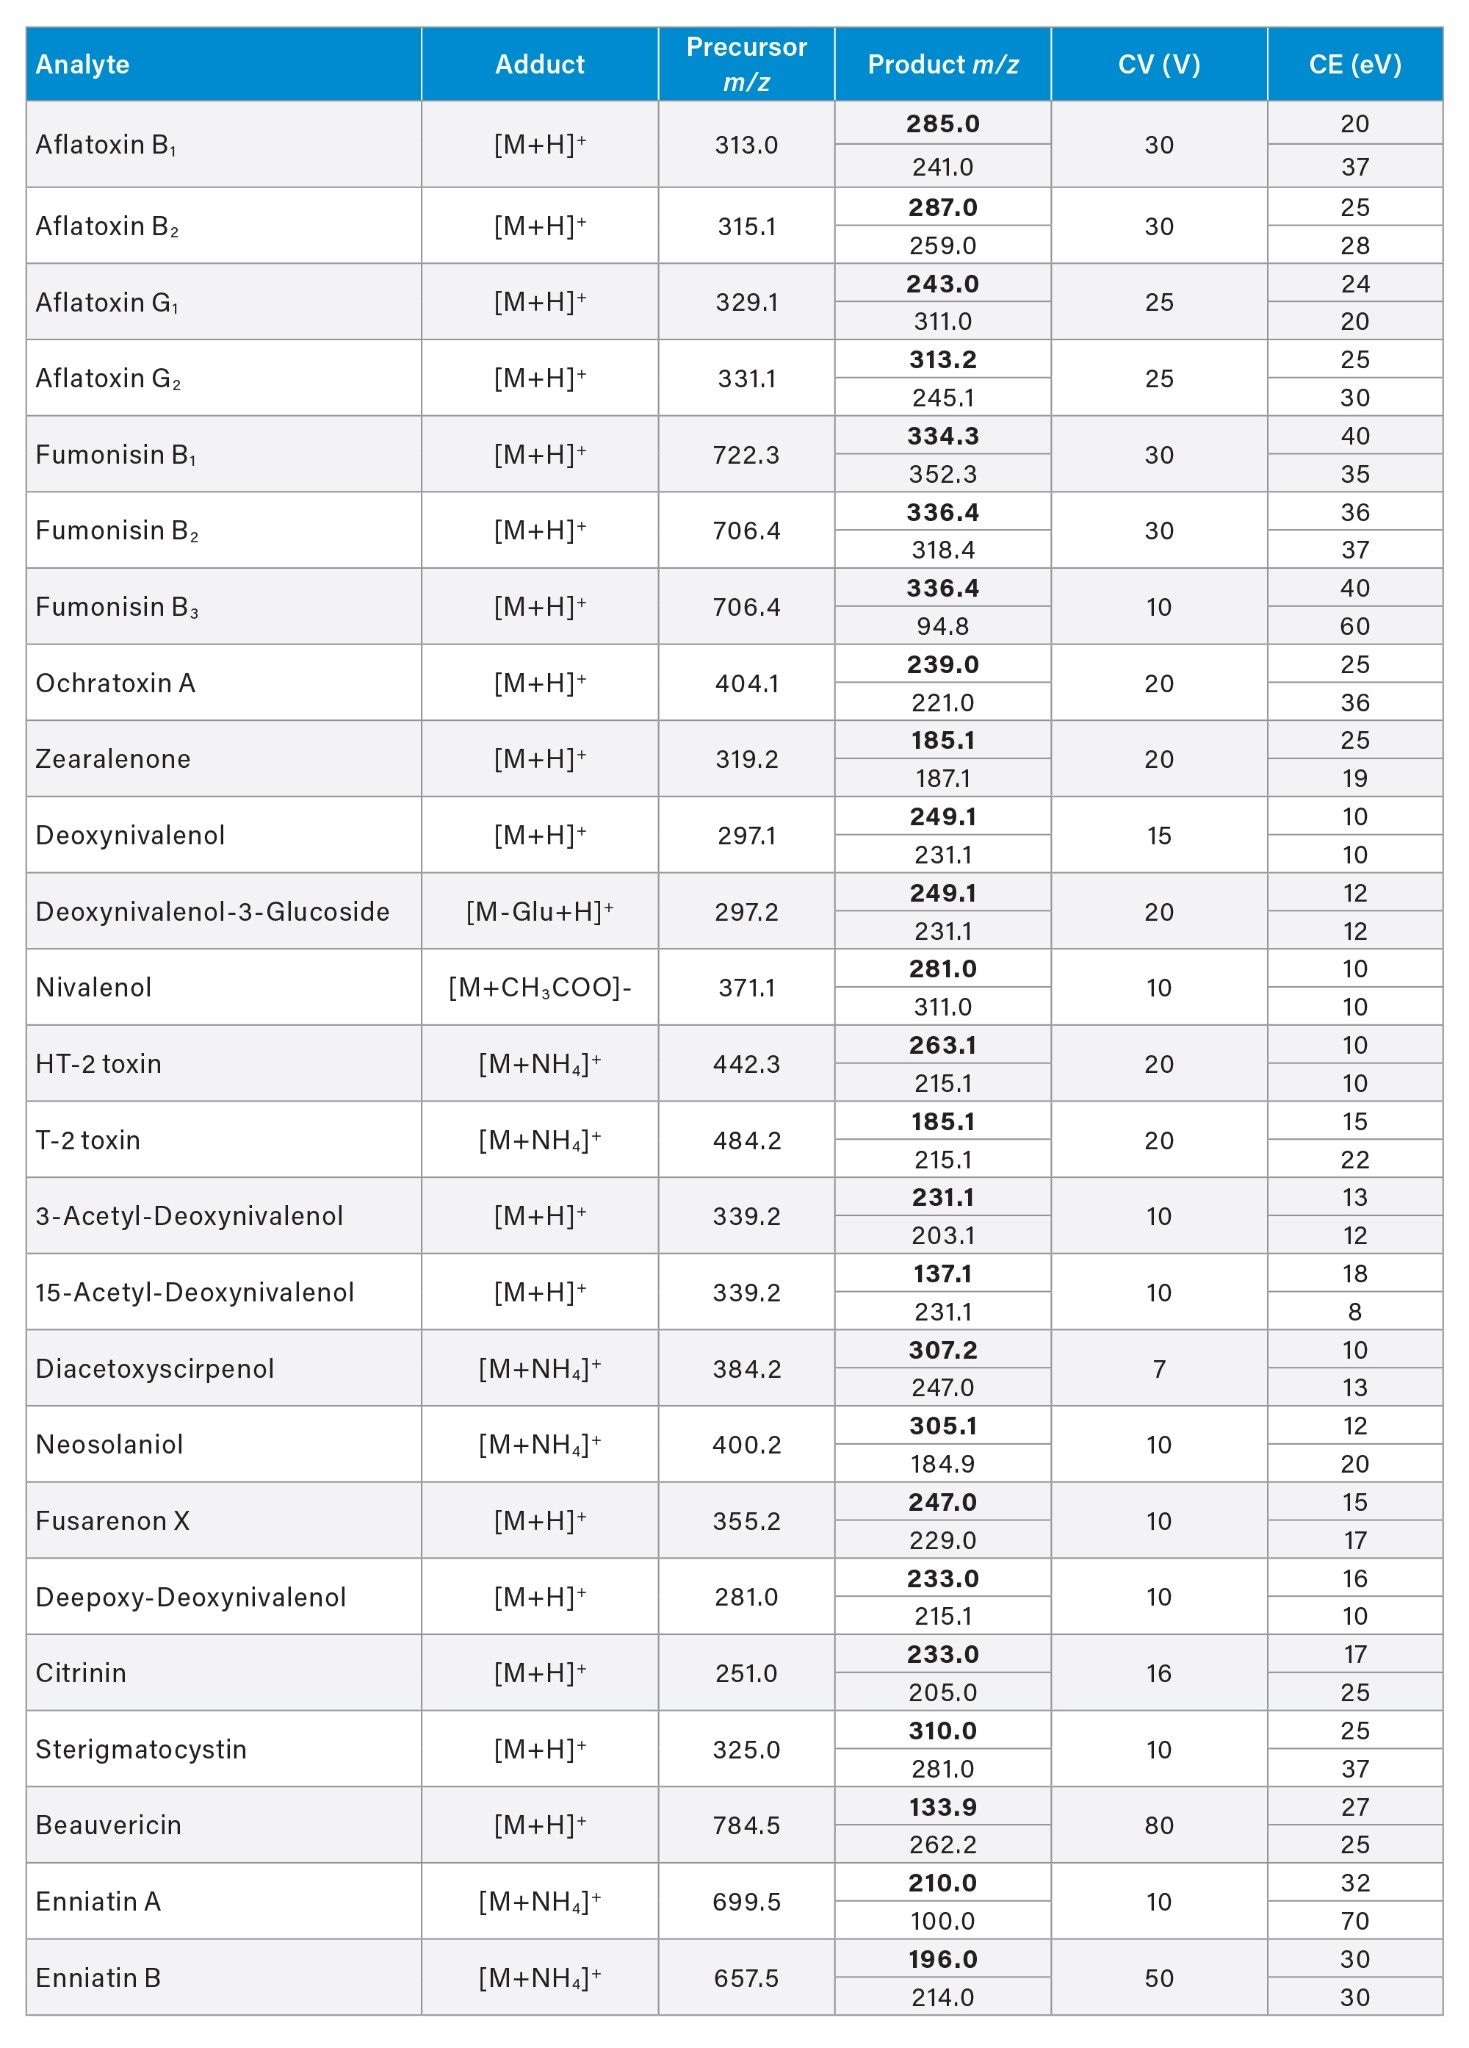
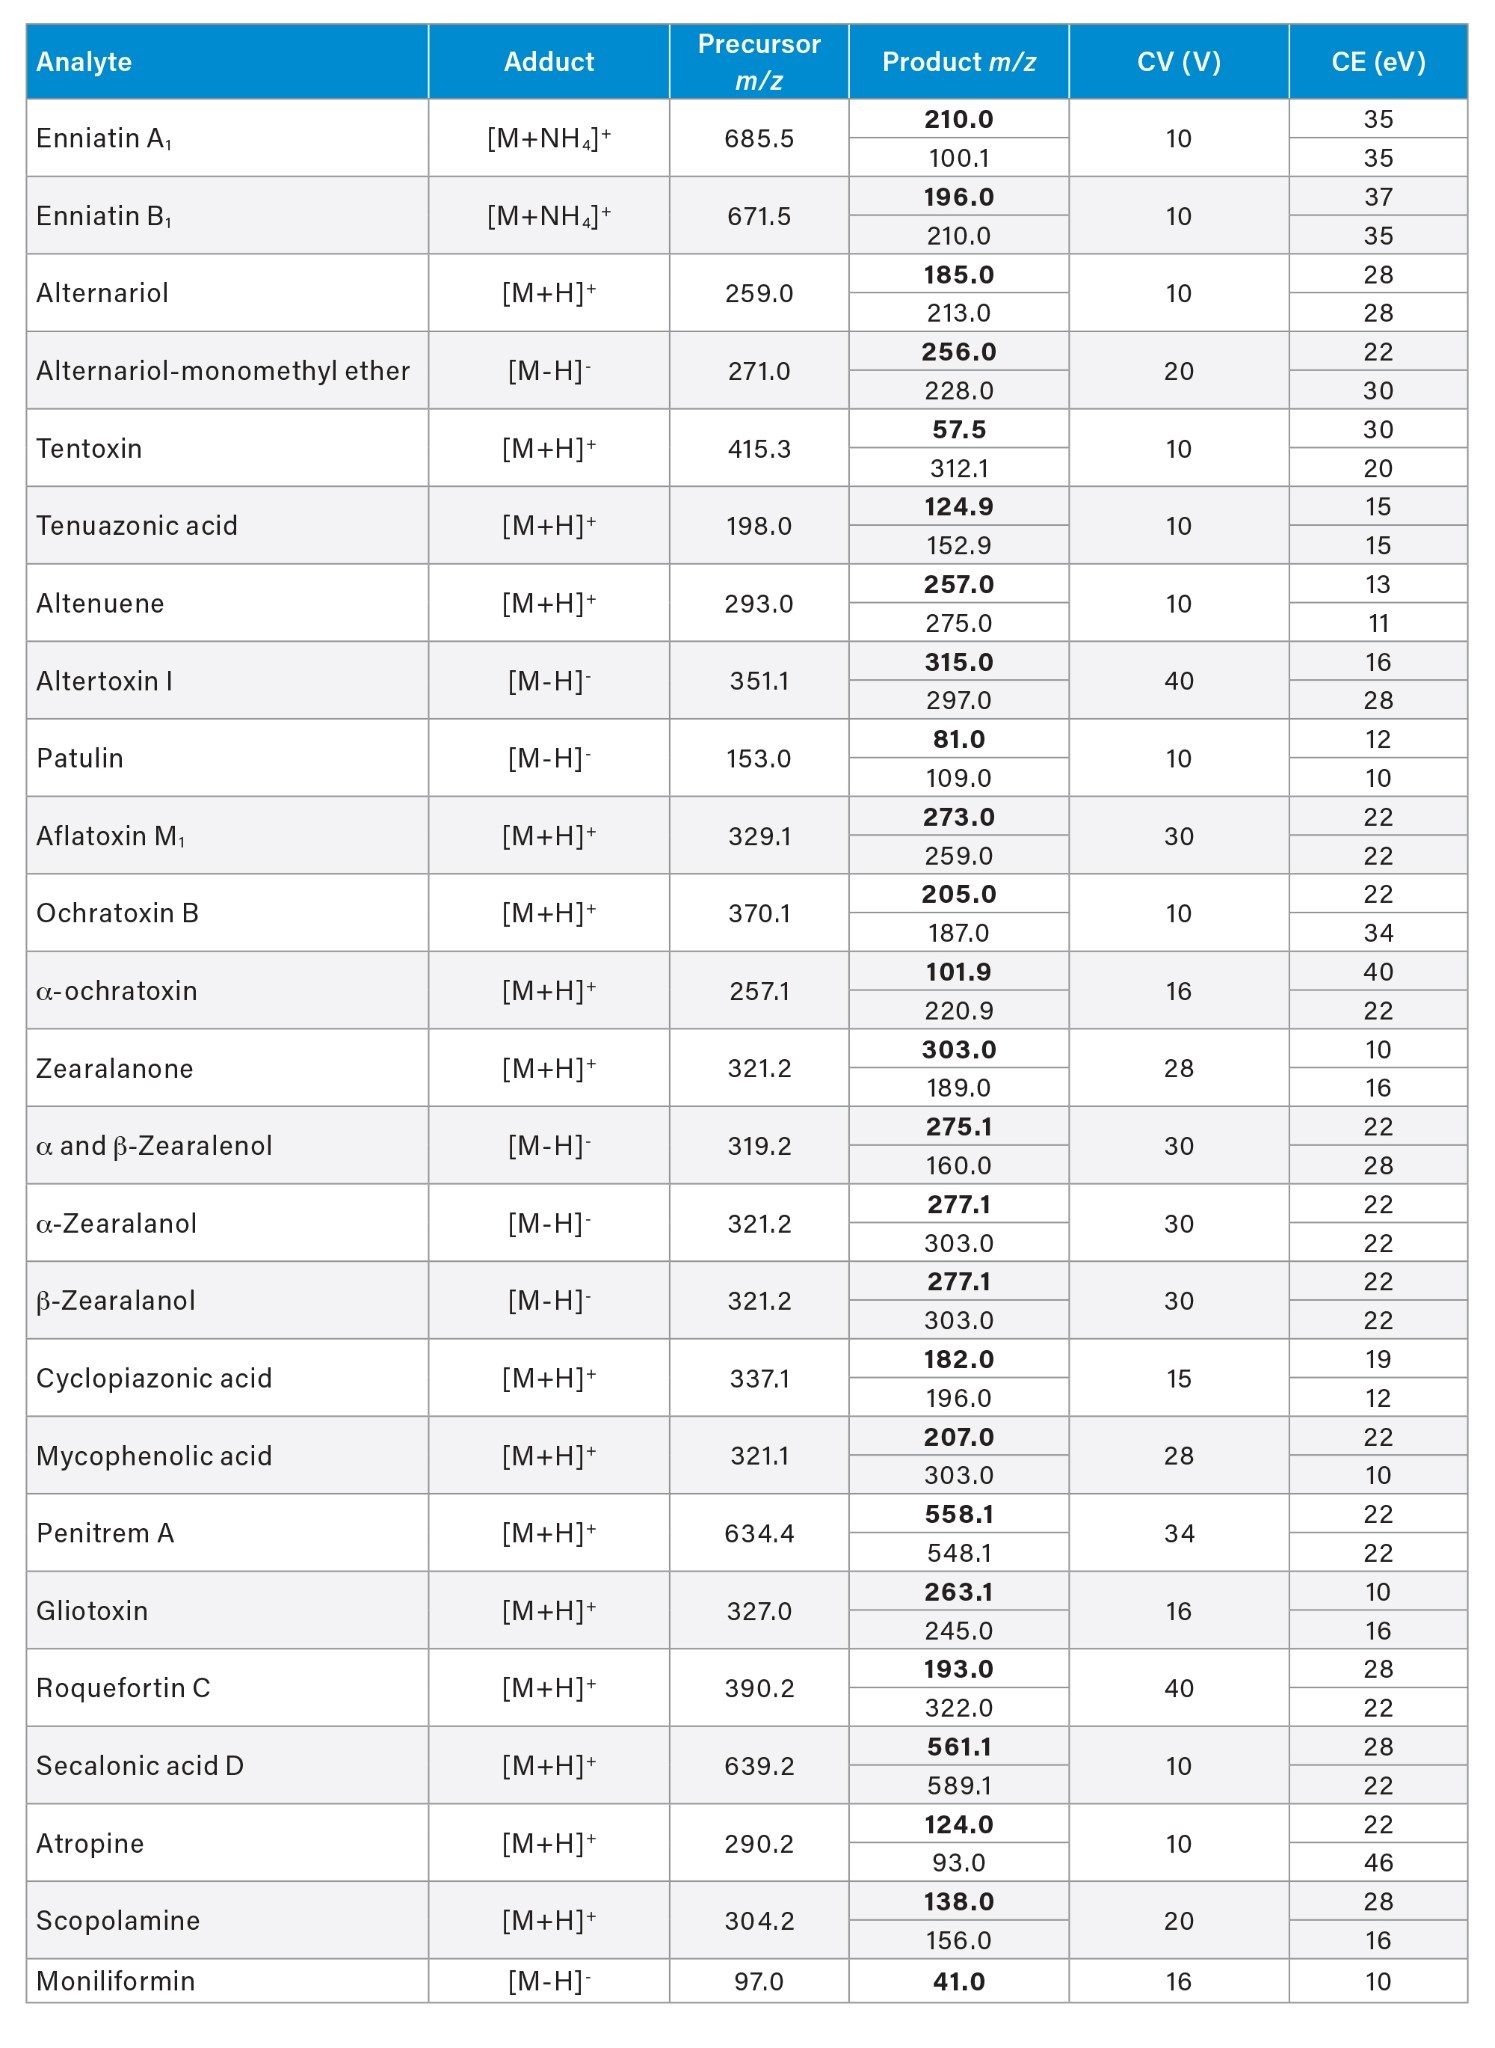 Appendix Table 3. Optimized MRM transitions, sampling cone voltage (CV), and collision energy (CE) for the target analytes.
720007476, December 2021