• 應用手冊

Selective and Specific Quantitation of NDMA in Ranitidine with the Xevo G2-XS QTof

Selective and Specific Quantitation of NDMA in Ranitidine with the Xevo G2-XS QTof

  • Viviane Nascimento
  • Michael Murgu
  • Lauren Mullin
  • Waters Corporation

Abstract

N-nitrosodimethlyamine (NDMA) is a compound of high interest for monitoring in various matrices, due to their carcinogenicity and incidence in a variety of commodities and pharmaceuticals consumed by humans. These compounds require sensitive and selective detection in the sub-ng/mL range in complex sample formulations. Here we discuss the performance of the Xevo G2-XS QTof using targeted enhancement for the sensitive and selective quantitation of NDMA in ranitidine drug products. In addition to linearity, detection, and calculated concentration results, the chromatographic capability of the method to separate NDMA from a recently identified interference is also described.

Benefits

  • Sensitive and selective determination of NDMA in drug product according to regulatory recommendations
  • Improved HRMS sensitivity with the use of targeted enhancement
  • Chromatographic separation of NDMA from the known co-eluting interference dimethylformamide

Introduction

N-nitrosodimethlyamine (NDMA) is a known potential carcinogen and has recently been detected as an impurity in a variety of pharmaceutical products.1 Formation of NDMA in these cases has been attributed to the synthesis of active pharmaceutical ingredients (APIs) with dimethylformamide (DMF) and nitrate reagent.1 The impacted pharmaceuticals initially included the widely sold angiotensin II receptor blockers2,3 such as the ‘sartan’ drug substance valsartan.3,4 Further findings of NDMA contamination currently extend to ranitidine,4,5 used for the treatment of stomach ulcers and hearburn,4 and extended release metformin.6 Subsequently, the US FDA and other global regulatory bodies have recalled or restricted the production of these pharmaceutical products,2,3 initiating a widely publicized campaign to accurately detect and quantify NDMA and other N-nitrosamines.2,4 Currently, the US FDA has established a 96 ng/day daily intake limit of NDMA5 with active consideration of lowering this limit. 

Thus, active monitoring of NDMA is of high priority and relies on sensitive and specific analytical methods. Use of liquid chromatography-mass spectrometry (LC-MS) has been successful applied for the confident identification and quantification of NDMA.1 In the case of NDMA measurement in ranitidine, for example, LC is preferred over gas chromatography methods where degradation of the drug substance can lead to NDMA formation during analysis.7 High resolution MS (HRMS) platforms afford specificity through accurate mass measurement of ions allowing the generation of narrow mass width extracted ion chromatograms (XICs). Recent developments in instrument design have greatly increased sensitivity on some HRMS platforms,8 and further signal increases can be achieved through application of an enhanced duty cycle around the targeted mass-to-charge (m/z) of interest. HRMS methods have been previously shown to accurately and precisely quantify NDMA in drug substances and products.2,3,7

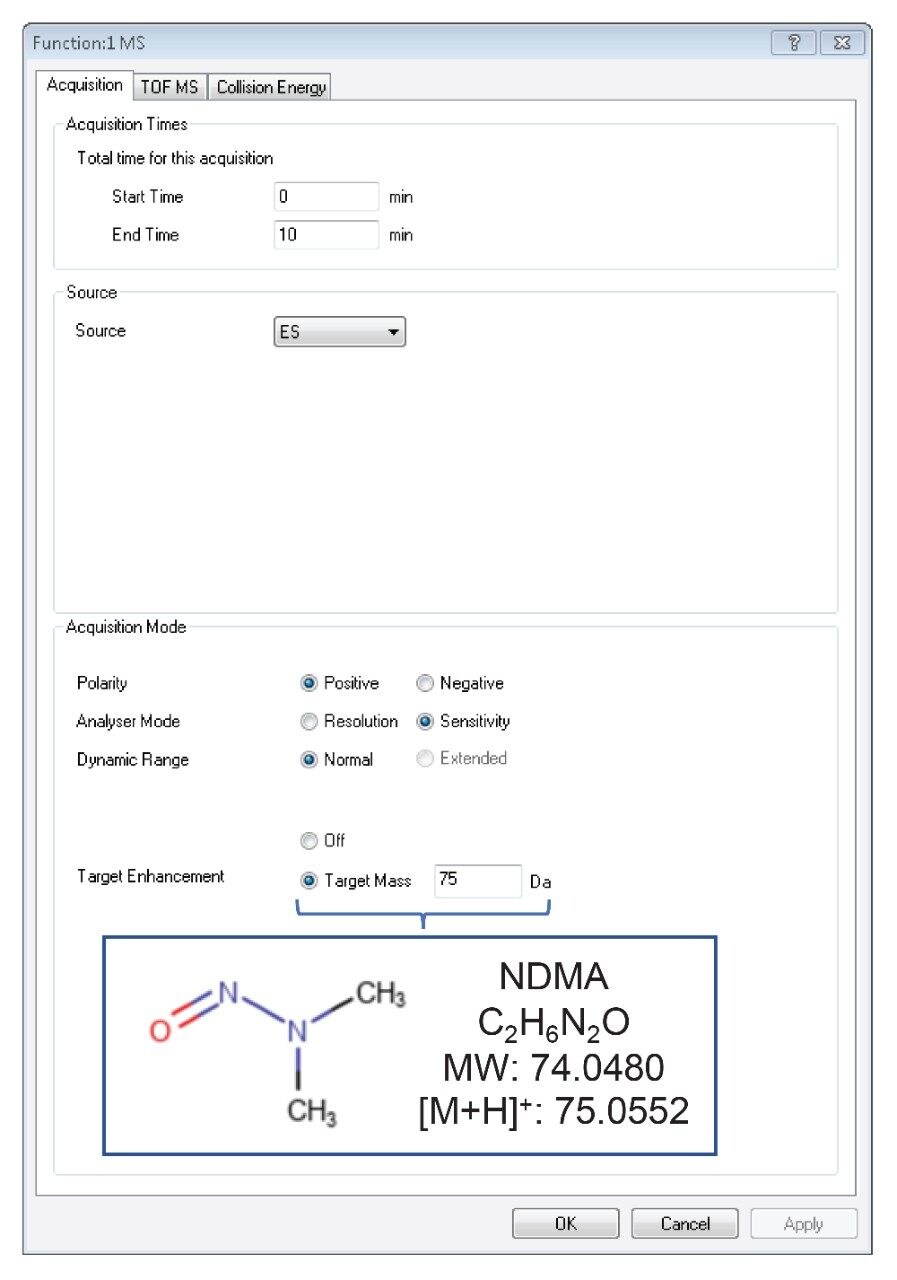
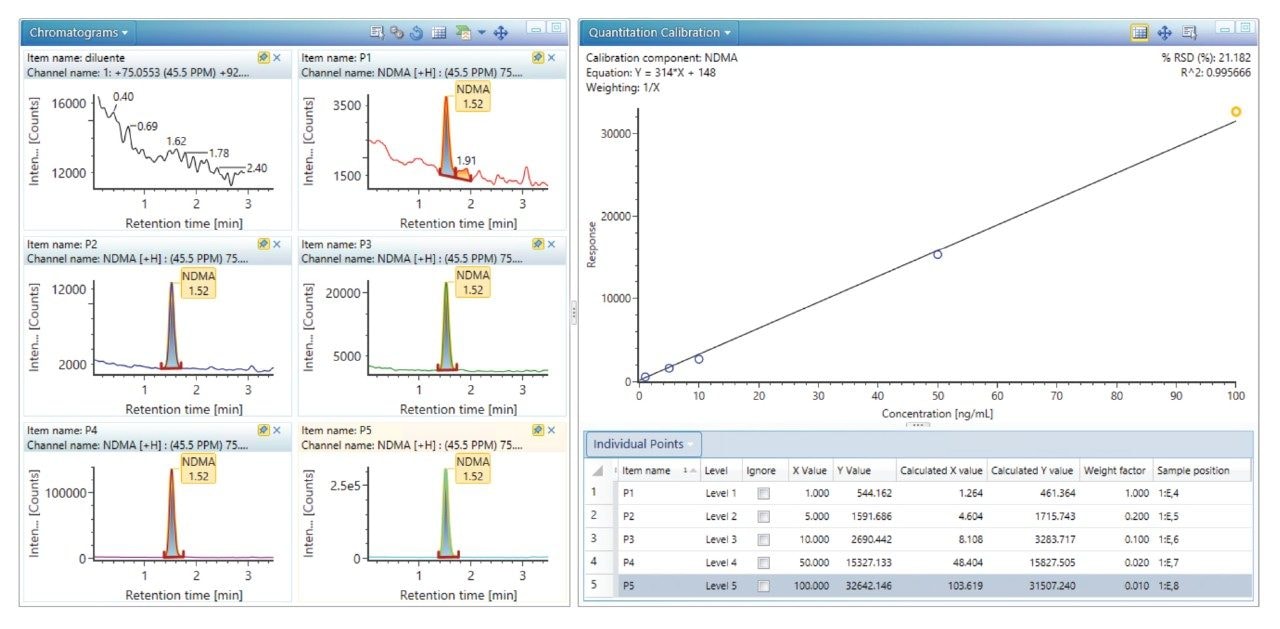
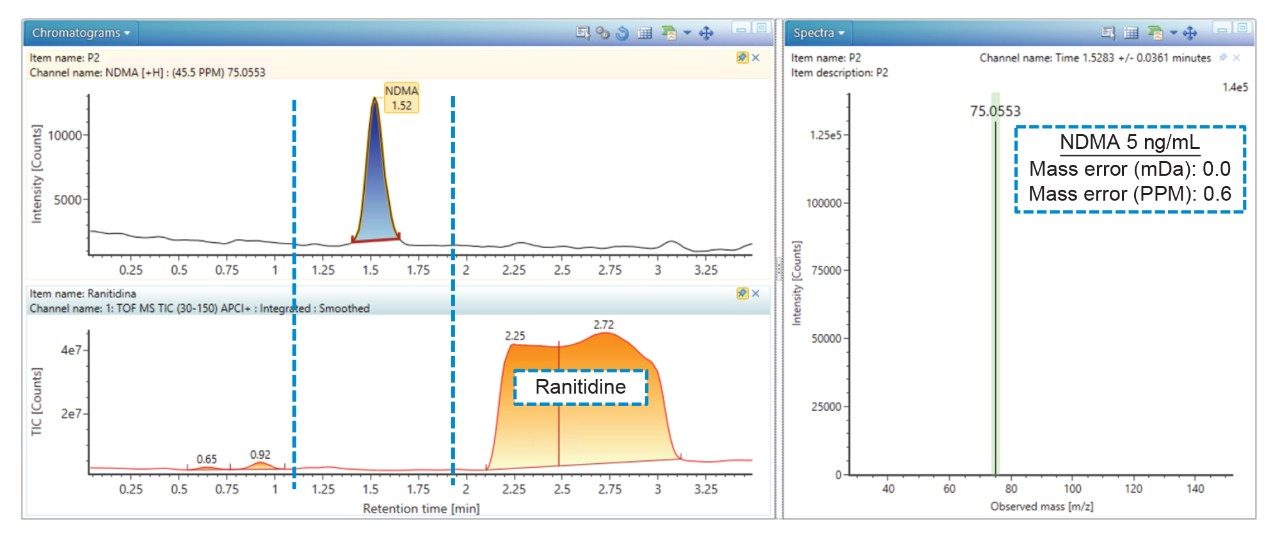
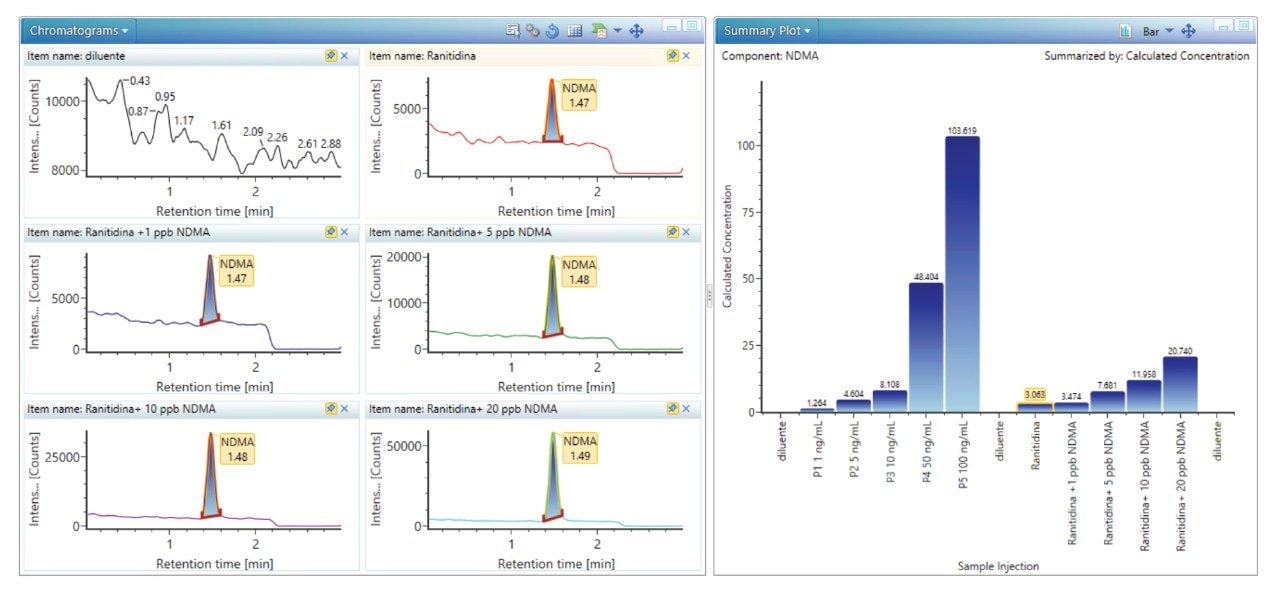
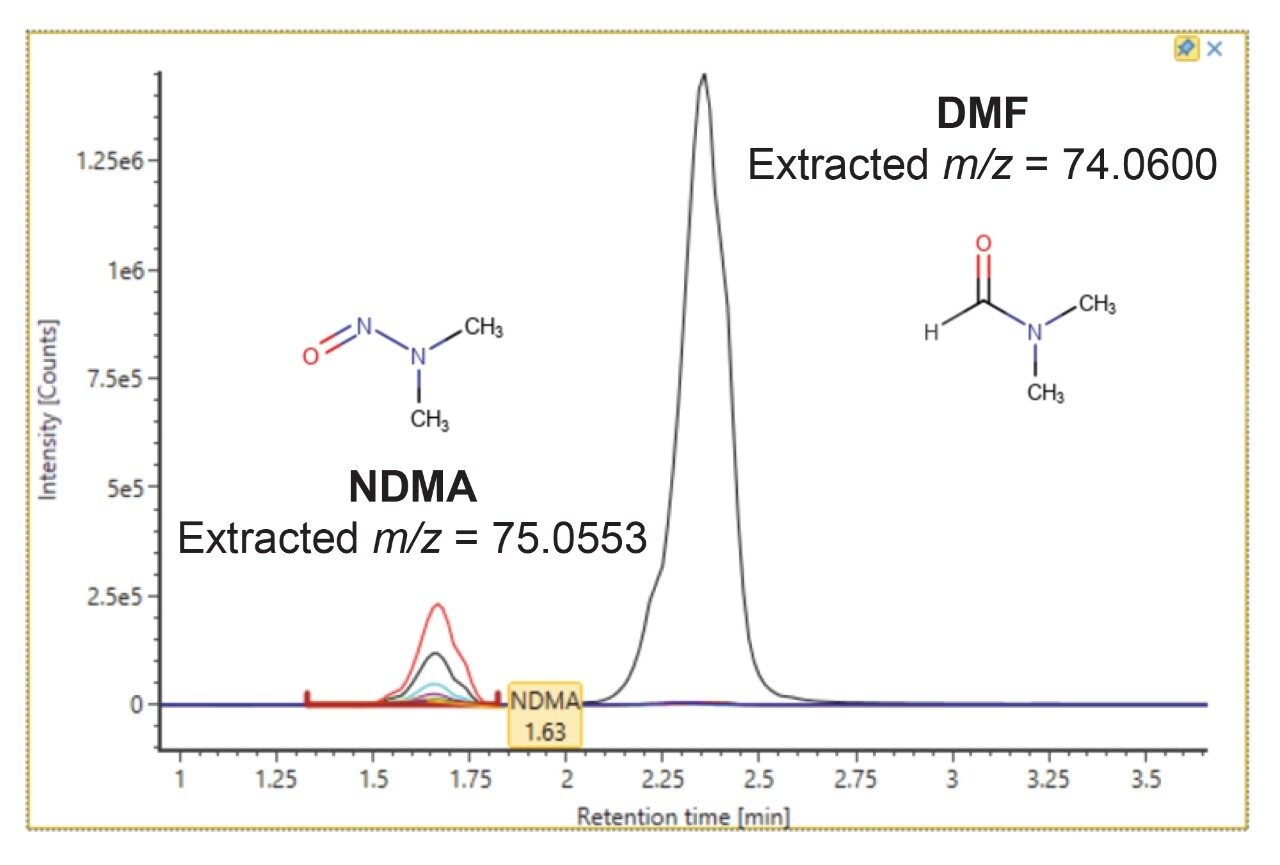
Here, we demonstrate the Xevo G2-XS QTof coupled with UPLC as a HRMS platform for selective and sensitive measurement of NDMA in the drug products ranitidine and metformin. Also illustrated is the chromatographic separation that is afforded by this method between NDMA and N,N-dimethylformamide (DMF), which is known to cause potential quantitative interference.

Experimental

Sample Description

Samples used in this study were prepared by dissolving ranitidine and metformin drug product in water to make a final concentration of 30 mg/mL. Specifically, 150 mg of ranitidine was dissolved in 5 mL of water for drug solution injection. For metformin, three tablets of 500 mg were dissolved in 50 mL of water, also metformin API was dissolved for this study in a final concentration of 30 mg/mL using 120 mg of API and 4 mL of water.

NDMA stock solution was diluted with water to a working concentration of 10 μg/mL and diluted in an appropriate volume water to attain concentrations of 1.0, 5.0, 10, 50, and 100 ng/mL. The determination of NDMA concentrations in prepared drug products were achieved using the below calculation, taken directly from,2 and using the target enhanced area of NDMA extracted ion chromatogram (XIC) at 75.0552 m/z for Aspl and As.

Dimethylformamide (DMF) and NDMA were prepared by dissolving in water to make a final concentration of 30ug/mL and 2ng/mL, respectively.

LC Conditions

LC system:

ACQUITY UPLC H-Class

Detection:

Xevo G2-XS Qtof

Column(s):

ACQUITY UPLC HSS T3 (2.1 x 100 mm, 1.8 µm)

Column temp.:

30 °C

Sample temp.:

7 °C

Injection volume:

10 µL

Flow rate:

300 µL/min

Mobile phase A:

Water + 0.1% formic acid

Mobile phase B:

Methanol + 0.1% formic acid

Gradient Table

MS Conditions

MS system:

Xevo G2-XS Qtof

Analyzer mode:

Sensitivity

Acquisition mode:

TOF MS

Scan time:

0.8 sec

Ionization mode:

APCI positive

Acquisition range:

30–150 m/z

Target enhancement mass:

75.0 m/z

Corona current:

0.5 mA

Probe temp.:

250 °C

Desolvation gas:

1200 L/hr

Collision energy:

6 eV

Cone voltage:

40 V

Cone gas:

10 L/hr

Source temp.:

130 °C

Lock mass:

Leucine Enkephalin (120.0813 m/z)

Quadrupole profile:

Manual profile (settings below)

Data Management

Chromatography software:

MassLynx v4.2

MS software:

MassLynx v4.2

Data processing:

UNIFI v1.9.4

Results and Discussion

Initial detection results for NDMA were assessed in solvent standards. In order to improve detection of NDMA, a targeted enhancement approach was utilized here. Targeted enhancement on the Xevo G2-XS QTof is achieved by synchronizing the pusher in the TOF region, in this case on the [M+H]+ for NDMA.9 This was easily enacted by simply enabling in the MS method (as shown in Figure 1) Target Enhancement, and entering the mass of interest, in this case 75.0 Da. Figure 2 shows a summary of the extracted ion chromatograms for the diluent blank and each point in the series, as well as the resulting calibration curve data. The resulting limit-of-quantification (LOQ) as determined based on a peak-to-peak signal-to-noise ratio of 10:1 was found at 1.0 ng/mL, where noise was taken from the 2.5 to 3.0 min. region. The dilution series, ranging from 1.0 to 100 ng/mL, demonstrated excellent linearity with an R2 of 0.996 (Figure 2). This value is below the recently recommended FDA limit of 30 ng/mL for NMDA in drug products/substances.10

Figure 1. Targeted enhancement enabled on NDMA in TOF MS MassLynx acquisition method. 
Figure 2. NDMA XICs from the blank and all standard samples alongside the calibration curve data. 

Following analysis of NDMA solvent standards, ranitidine drug product (DP) was analyzed. Chromatographic separation between NDMA and ranitidine is shown in Figure 3, which compares the 5 ng/mL NDMA standard injection with that of ranitidine at 30 mg/mL. Specificity in the identification of NDMA is attained using accurate mass measurement with the Xevo G2-XS QTof (Figure 3). The ranitidine DP analyzed was found to contain NDMA contamination. Figure 4 shows the XIC of NDMA in ranitidine without further fortification, and then at four fortified levels of 1.0, 5.0, 10, and 20 ng/mL NDMA. A response summary of all injections is also displayed in Figure 4. At each injection in the summary plot, the calculated concentration is annotated for NDMA in both standards and drug product sample. Lastly, using a 1/X curve weighting this fortified NDMA curve in ranitidine DP showed good linearity with an R2 value of 0.996.

Figure 3. Chromatographic separation of NDMA (5 ng/mL standard) and ranitidine (30 mg/mL) using an ACQUITY HSS T3 UPLC Column. Further specificity using this LC-HRMS method is afforded by accurate mass measurement, demonstrated in the spectrum for the NDMA standard. 
Figure 4. NDMA XICs for blank diluent, ranitidine drug product, and spiked drug product, and summary plot of NDMA calculated concentration across all injections. 

Upon characterization of method performance, seven ranitidine samples were analyzed and found to contain NDMA at various levels. These results, and the mean response (area) of a NDMA 3 ng/mL standard, are reported in Table 1. Here NDMA was quantitated against a standard curve prepared in water. Metformin samples were also analyzed and found to be free of detectable NDMA.

Table 1. Summary of NDMA concentrations (ppm) in seven different ranitidine samples. 

Recent reports have highlighted potential discrepancies in NDMA quantitation as a result of co-eluting N,N-dimethylformamide (DMF) present in metformin drug products. DMF (C3H7NO) and NDMA (C2H6N2O) are similar in molecular weight (theoretical [M+H]+ of 74.0600 and 75.0553 m/z, respectively). Though these masses are easily differentiated under nominal mass conditions, cases of NDMA over-quantification have occurred under chromatographic co-elution due to the contribution of the DMF15 N isotopic ion (theoretical m/z of 75.0631).11 Although developed prior to the revelation of this NDMA quantitation issue, the chromatography method employed here provides suitable, base-line separation between NDMA and DMF, and is shown in Figure 5. Even in cases of HRMS methods, chromatographic separation is the most reliable way to avoid inaccurate quantification.

Figure 5. Chromatographic separation of NDMA (as overlaid XICs of sample concentrations ranging from 1.0–100 ng/mL) at 1.63 min and DMF at 2.30 min. 

Conclusion

Here we demonstrate the capability of the Xevo G2-XS QTof to accurately quantitate NDMA in ranitidine and metformin drug product, within the FDA recommended LOQ <0.03 ppm (30 ng/mL). Using this method, NDMA was able to be quantified in seven metformin tablets. The developed UPLC chromatographic method also proved to be robust and selective in affording separation of NDMA from potentially co-eluting DMF. 

References

  1. Parr MK and Joseph JF. NDMA Impurity in Valsartan and other Pharmaceutical Products: Analytical Methods for the Determination of N-nitrosamines. JPBA 2018;164(2019):536–549.
  2. US Food and Drug Administration. Liquid Chromatography-High Resolution Mass Spectrometry (LC-HRMS) Method for the Determination of Six Nitrosamine Impurities in ARB Drugs. 21 May 2019.
  3. Sörgel F et al. The Contamination of Valsartan and other Sartans, Part 1: New findings. JPBA 2019;172(2019):395–405.
  4. https://www.ema.europa.eu/en/human-regulatory/post-authorisation/referral-procedures/nitrosamine-impurities. Accessed 13 July 2020.
  5. White CM. Understanding and Preventing (N-Nitrosodimethylamine) NDMA Contaminating of Medications. AOP 2019;54(6):611–614.
  6. https://www.fda.gov/drugs/drug-safety-and-availability/fda-updates-and-press-announcements-ndma-metformin. Accessed 13 July 2020.
  7. US Food and Drug Administration. Liquid Chromatography-High Resolution Mass Spectrometry (LC-HRMS) Method for the Determination of NDMA in Ranitidine Drug Substance and Drug Product. 13 September 2019.
  8. Waters Corporation. XS Collision Cell White Paper. Waters Corporation White Paper 720005071EN. 2014 June.
  9. Tomczyk N et al. Targeted High Resolution Quantification with Tof-MRM and HD-MRM. Waters Application Note 720004728EN. 2013 June.
  10. US Food and Drug Administration. Control of Nitrosamine Impurities in Human Drugs: Guidance for Industry. September 2020.
  11. Yang J et al. A Cautionary Tale: Quantitative LC-HRMS Analytical Procedures for the Analysis of N-Nitrosodimethylamine in Metformin. The AAPS Journal 22:89 (2020).

720007167, March 2021

回到頁首 回到頁首