Separation of Pentose Phosphate Pathway, Glycolysis, and Energy Metabolites Using an ACQUITY Premier System With an Atlantis Premier BEH Z-HILIC Column
For research use only. Not for use in diagnostic procedures.
Abstract
Analyses of phosphorylated metabolites are challenging because of their interactions with metal surfaces in conventional LC systems and columns. Here, we describe a targeted UPLC-MS/MS method for 27 pentose phosphate, glycolysis, and energy metabolites in plasma and tissue extracts. The method leverages the benefits of MaxPeak High Performance Surfaces Technology used in the ACQUITY Premier System and the Atlantis Premier BEH Z-HILIC Column to mitigate interactions of the metabolites with metal surfaces. The stability of the column to high pH mobile phases is also key, as the best peak sharpness, peak symmetry, and sensitivity was achieved using a pH 9 ammonium bicarbonate buffer in the mobile phase. The results demonstrate that high efficiency, UPLC-pressure tolerant 1.7 μm Atlantis Premier BEH Z-HILIC Columns provide excellent separations for these challenging analytes.
Benefits
- A targeted UPLC-MS/MS method that provides sharp, symmetric peaks for 27 challenging metabolites
- The base-stable Atlantis Premier BEH Z-HILIC Column allows the use of an optimal pH 9 buffer
- MaxPeak High Performance Surfaces Technology in the UPLC system and column enables excellent peak sharpness, peak symmetry, and sensitivity
Introduction
Central carbon metabolism is comprised of several enzyme-mediated pathways which work together to provide energy, precursors, and reduction of cofactors for cell growth and homeostasis. Two important pathways within central carbon metabolism are glycolysis and the pentose phosphate pathway. Glycolysis consists of a sequence of reactions that convert glucose into pyruvate under oxygen-rich conditions, and further into lactate under oxygen-poor conditions. These metabolites may then feed into the tricarboxylic acid (TCA) cycle. Through these reactions, ATP is formed and NADH is oxidized to NAD+. Alternative to glycolysis, the pentose phosphate pathway ultimately converts glucose into ribose 5-phosphate as well as NADPH. Ribose 5-phosphate undergoes further reactions into ribose sugars that are used as DNA and RNA building blocks.1 Perturbations in the relative concentrations of central carbon metabolites arising from disease are studied to understand their underlying mechanisms.2
The analysis of the components of the pentose phosphate pathway and glycolysis is fraught with challenges due to their polar nature, with most containing phosphorylated moieties, as well as a number of isomers. The presence of phosphate groups on the metabolites contributes to the adsorption of these analytes to metal surfaces in the analytical system. This causes the measurements to be unreliable as the metal adsorption results in poor peak shapes, high variability, and poor sensitivity.
We present a method for the analysis of pentose phosphate pathway, glycolysis, and energy metabolites using a zwitterionic HILIC Column, the Atlantis Premier BEH Z-HILIC Column. This column contains a sulfobetaine stationary phase on ethylene-bridged hybrid (BEH) particles.3 This material is packed into MaxPeak High Performance Surfaces (HPS) column hardware to mitigate interactions of metal sensitive compounds with metal surfaces.4 The column was used on an ACQUITY Premier System, which also incorporates MaxPeak HPS Technology, and a Xevo TQ-S micro Tandem Quadrupole Mass Spectrometer.
Experimental
Mobile Phase Preparation
To ensure reproducibility of preparation, the optimized mobile phase was prepared gravimetrically every 3 days. A 150 mM ammonium bicarbonate pH 9.00 stock solution was prepared by weighing out 2.96 g of ammonium bicarbonate (Sigma 09830) on a top loading balance and adding water to 240 g. The solution was then adjusted to pH 9.00 (+/- 0.02) by adding aqueous 28% ammonium hydroxide (Sigma 338818) and returned to the balance for accurate weighing to 250 g. 100 g of this buffer concentrate was added to two LDPE mobile phase bottles. 900 g of water was weighed and added to one bottle to make mobile phase A, and 707.6 g (900 mL) of acetonitrile (ACN) was weighed and added to the second bottle to make mobile phase B. The mobile phases were capped tightly and sonicated for 20 minutes before use.
The pH screening mobile phases were prepared in a similar fashion, however the final proportions of mobile phases A and B were measured volumetrically. Briefly, 0.976 g of ammonium acetate (Sigma 431311) was weighed and water added to ~100 g. The pH was adjusted by adding either acetic acid (Sigma 338826) or 28% ammonium hydroxide, then the solution was returned to the balance for accurate weighing to 125 g to make a 100 mM solution. 50 mL of this solution was added to two mobile phase bottles. 450 mL of water was added to one bottle to make mobile phase A and 450 mL of acetonitrile was added to the other to make mobile phase B, which was then capped tightly and sonicated for 20 minutes.
Stock Solution Preparation
High purity analyte standards were obtained from Sigma Aldrich. Glyceraldehyde 3-phosphate was purchased as a 10.7 mg/mL solution in water and all others as solids. Stock solutions were prepared individually at 20 mM free acid in 50%ACN/50%H2O and subsequently combined into three equal mixes at 1 mM in 50%ACN/50%H2O for the working stock solutions. Stable labelled internal standards (Cambridge Isotope Laboratories and Sigma Aldrich) were each prepared at 1 mM free acid in 50%ACN/50%H2O. A 5x concentrated working internal standard mix of 100 µM lactic acid-13C and 10 µM each of glucose 6-phosphate-13C, AMP-13C15N, ADP-15N, ATP-13C, GMP-13C15N, and GTP-13C was prepared in 50%ACN/50%H2O. All stock solutions were stored at -20 °C.
Standards for the calibration curves were prepared in 50%ACN/50%H2O by serial dilution from the working stock solution to make stock standards of 250, 125, 50, 25, 12.5, 5, 2.5, 1.25, 0.50, 0.250, 0.125, and 0.050 µM. 5 µL of each standard as well as 5 µL of the internal standard mixture was added to 15 µL of 50%ACN/50%H2O in a silanized vial. This represents calibration solutions of 50, 25, 10, 5, 2.5, 1, 0.5, 0.25, 0.1, 0.05, 0.025, and 0.01 µM respectively in 25 µL. Seventy five microliters of 50%ACN/50%H2O was then added to give a final volume of 100 µL. Thus, the final concentrations for the calibration curve were 12.5, 6.25, 2.5, 1.25, 0.625, 0.25, 0.125, 0.0625, 0.025, 0.0125, 0.00625, and 0.0025 µM.
Liver and Brain Extraction
Sample preparation was based on a previously described method5, with modifications. Female Sprague Dawley Rat Liver and Male Sprague Dawley Rat brain were from BioIVT (Westbury, NY). 25 mL of liver/brain were added to a 2 mL Precellys Tissue homogenization Tube (p/n 10409) followed by 750 μL of 80%MeOH/20%H2O (chilled on ice). Samples were homogenized on the Precellys Evolution using a program of 3 x 15 s cycles at 5800 rpm, with a 30-second pause between cycles. Homogenate was pipetted into new 1.5 mL microcentrifuge tubes and samples were placed at -20 °C for 60 min. Samples were centrifuged at 18407 xg for 10 minutes at 4 °C. The supernatant was transferred to a 1.5 mL microcentrifuge tube and dried using a TurboVap at room temperature using 1 L/min for 100 min and then 2.5 L/min for 30 minutes. Samples were reconstituted in 50 µL of 50%ACN/50%H2O, briefly vortex mixed and placed at 4 °C for 10 minutes followed by centrifugation at 18407 xg for 10 minutes at 4 °C. Samples were pipetted into total recovery silanized vials and analyzed immediately.
Plasma Extraction
Sprague Dawley K2EDTA pooled gender plasma was purchased from BioIVT (Westbury, NY). 25 µL of plasma was added to a 1.5 mL microcentrifuge tube. 125 µL of 80%MeOH/20%H2O (chilled on ice) was then added. Samples were vortexed for 1 minute, and then covered and placed on a shaker at 250 rpm for 20 minutes at room temperature. The samples were then placed in a -20 °C freezer for 60 minutes. Samples were centrifuged at 18407 xg for 10 minutes at 4 °C. Supernatant was transferred to a 1.5 mL microcentrifuge tube and dried using a TurboVap at room temperature using 1 L/min for 100 minutes and then 2.5 L/min for 30 minutes. Samples were reconstituted in 50 µL of 50%ACN/50%H2O, briefly vortex mixed and placed at 4 °C for 10 minutes followed by centrifugation at 18407 xg for 10 minutes at 4 °C. Samples were pipetted into total recovery silanized vials and analyzed immediately.
LC Conditions
|
LC system: |
ACQUITY Premier BSM System |
|
Vials: |
Waters Total Recovery Vials, Deactivated (p/n: 186000385DV) |
|
Mobile phase containers: |
Waters Certified LDPE Container, 1 L (p/n: 186009110) |
|
Column(s): |
Atlantis Premier BEH Z-HILIC 1.7 μm, 2.1 x 100 mm (p/n: 186009979) |
|
Column temp.: |
30 °C |
|
Sample temp.: |
8 °C |
|
Injection volume: |
3 µL |
|
Flow rate: |
0.5 mL/min |
|
Mobile phase A: |
15 mM Ammonium bicarbonate, pH 9.00 in H2O |
|
Mobile phase B: |
15 mM Ammonium bicarbonate, pH 9.00 in 90%ACN/10%H2O v/v |
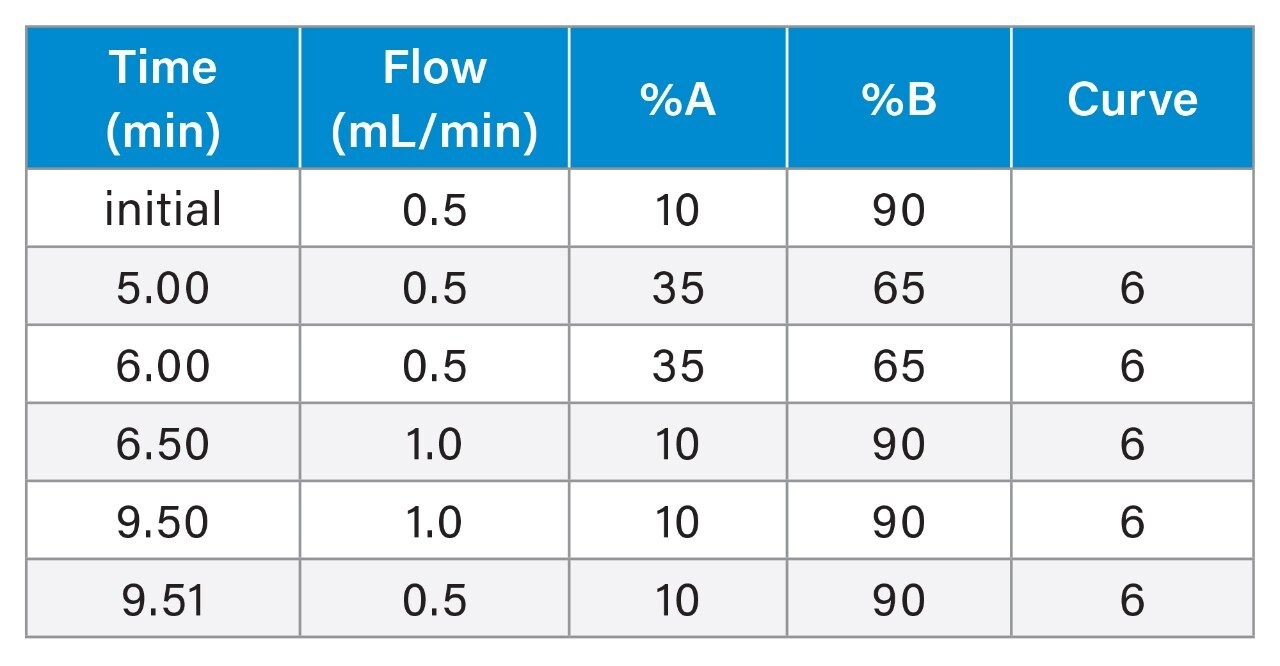
Gradient Table
MS Conditions
|
MS system: |
Xevo TQ-S micro Tandem Quadrupole Mass Spectrometer |
|
Ionization mode: |
Positive/Negative |
|
Capillary voltage: |
1 kV/1 kV |
|
Desolvation temperature: |
500 °C |
|
Desolvation gas: |
1000 L/hr |
|
Cone gas: |
50 L/hr |
|
Source temperature: |
150 °C |
Data Management
|
MS software |
MassLynx v4.2 SCN1017 |
Results and Discussion
Previous studies have reported that the best peak sharpness, symmetry, and sensitivity for phosphorylated metabolites is obtained using mobile phases containing ca pH 9 ammonium acetate or ammonium bicarbonate buffers.6–9 However, few HILIC columns are stable at this pH, the primary exceptions being those based on organic polymer or ethylene-bridged hybrid (BEH) particles. Columns containing polymeric particles have very limited pressure ranges and relatively low efficiencies compared to those packed with hybrid particles. Atlantis Premier BEH Z-HILIC Columns combine stability to pH 10 with high efficiencies3, making them ideal for this application. In addition, these columns use MaxPeak High Performance Surfaces (HPS) for the column hardware to mitigate interactions between the analytes and metal surfaces, resulting in improved peak shape, peak areas, and peak area reproducibility for metal-sensitive compounds.4,10,11
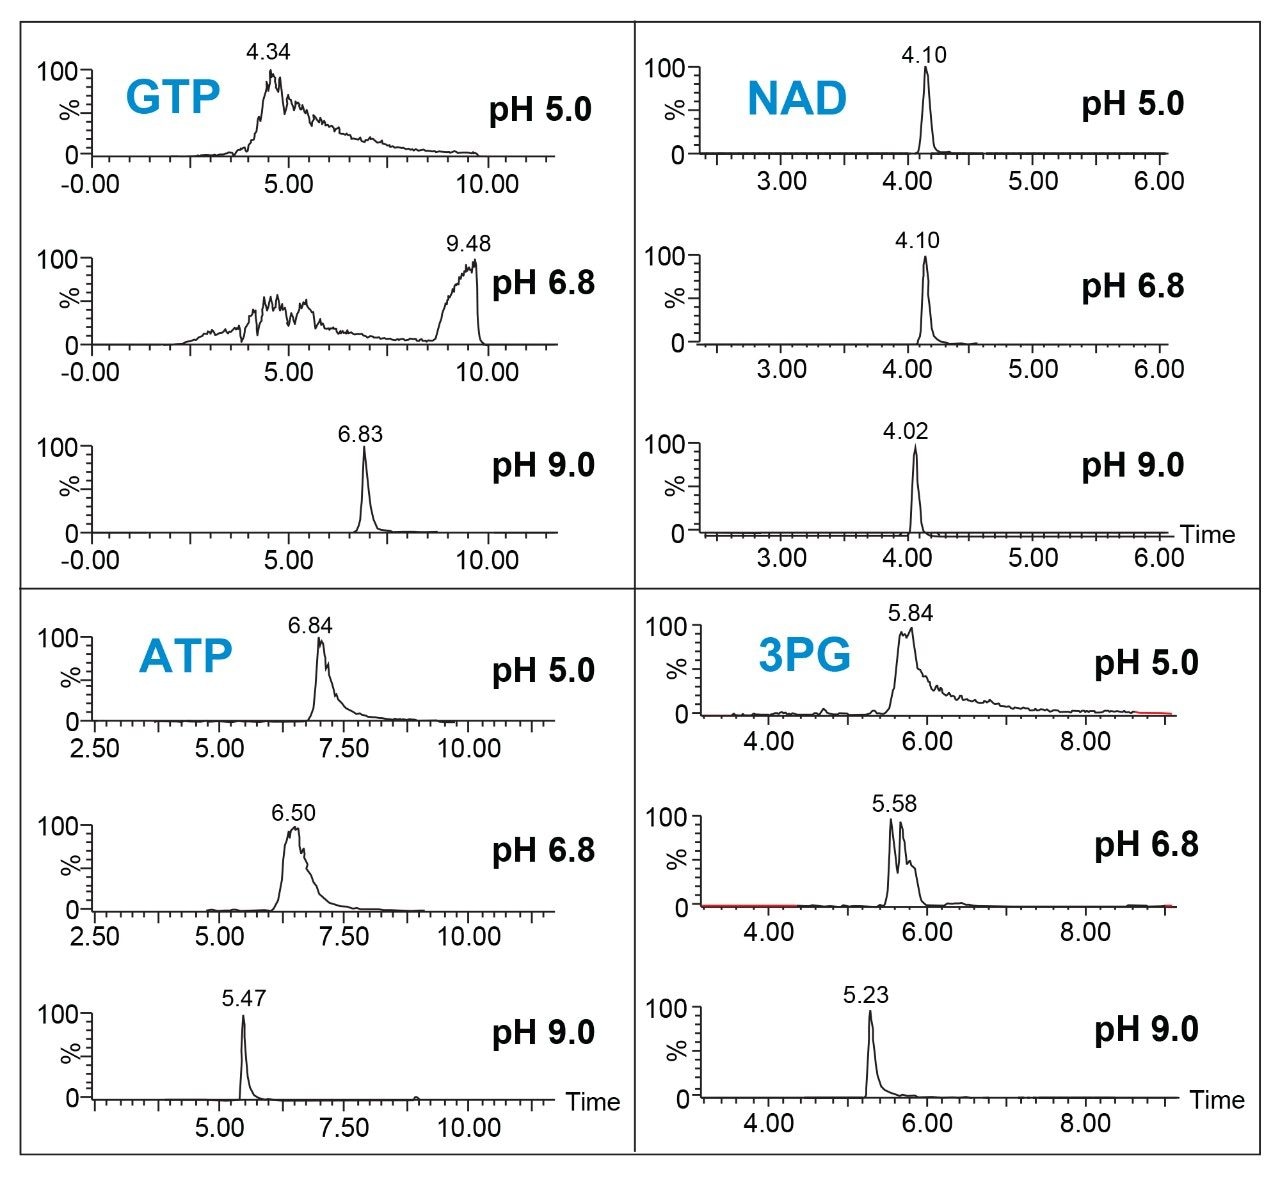
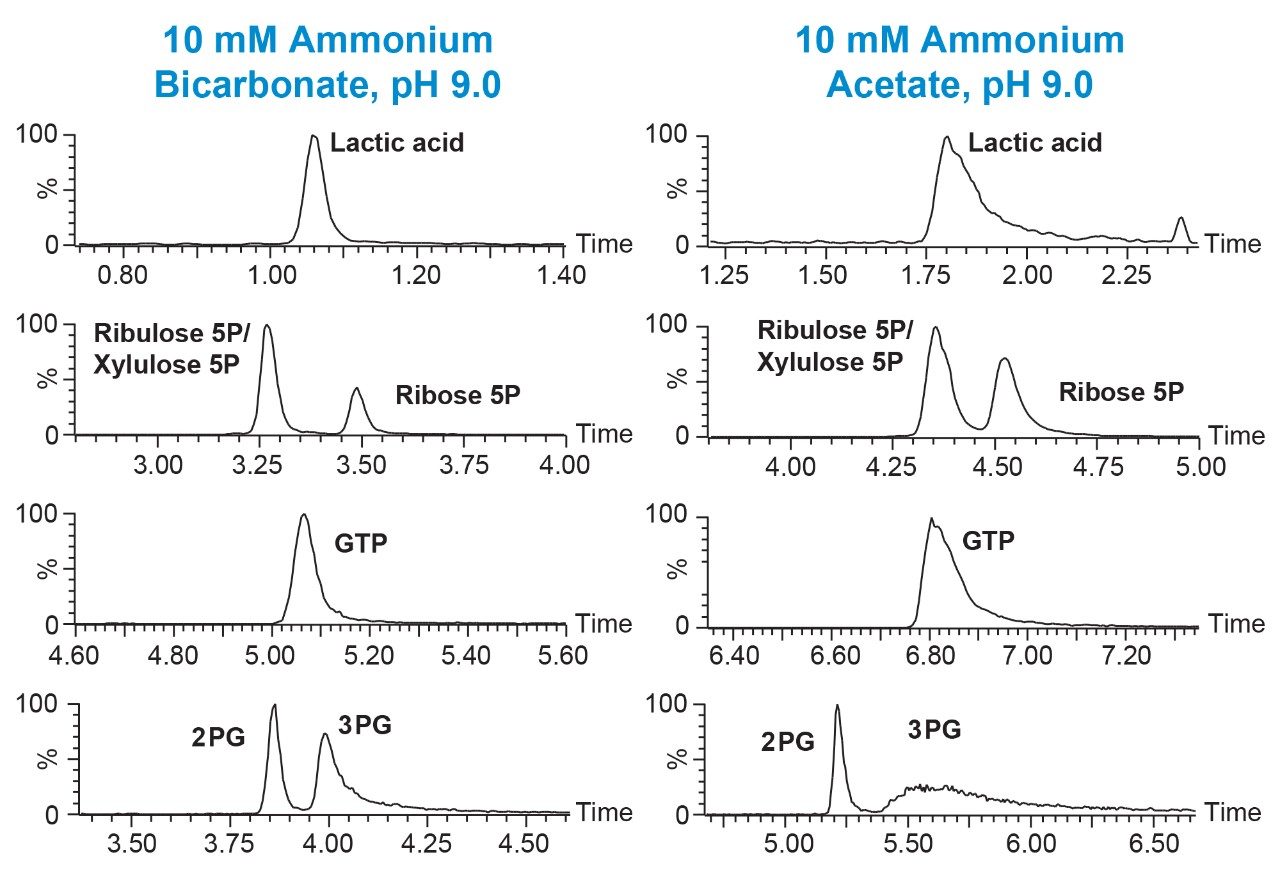
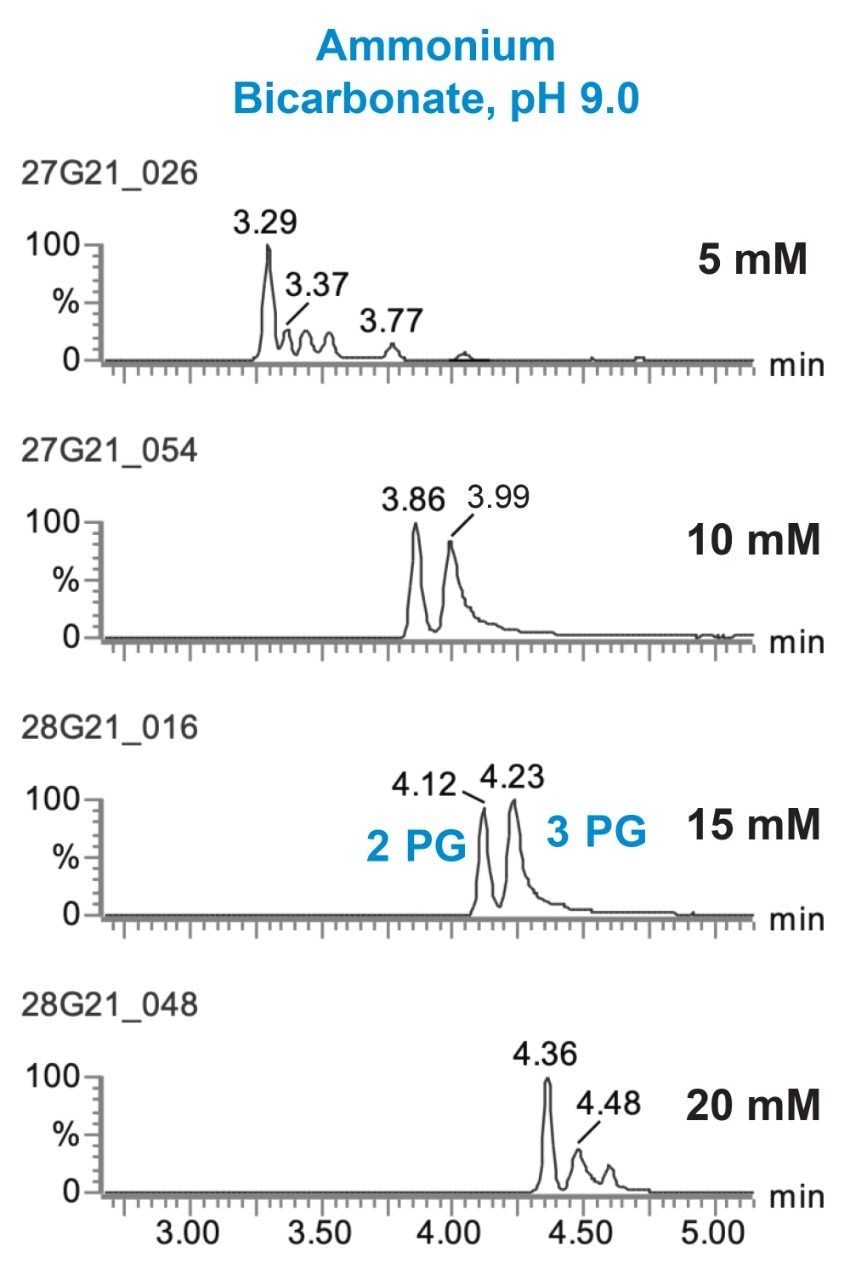
Three different buffer pH values were evaluated to determine the effect on peak sharpness, symmetry, and sensitivity: all contained 10 mM ammonium acetate, with the pH adjusted to pH 5.0, 6.8 or 9.0. The results for four of the analytes are shown in Figure 1. For 3-phosphoglyceric acid (3PG), guanosine triphosphate (GTP), and adenosine triphosphate (ATP), the best results were obtained using the pH 9.0 buffer. This is in agreement with previous studies that used different columns.6–9 In contrast, narrow symmetric peaks were observed for nicotinamide adenine dinucleotide (NAD) with all three buffers. To understand the effect of buffer choice and concentration on the peak shape and retention of the analytes, ammonium bicarbonate at pH 9.0 was also investigated. Although retention decreased, peak shape for the majority of compounds improved using ammonium bicarbonate, pH 9.0 (Figure 2). Notable improvements in the separation of ribose 5-phosphate (5P) from the isobaric ribulose 5P/xylulose 5P as well as a dramatically sharper peak for 3PG were observed using ammonium bicarbonate, pH 9.0. Finally, the effect of buffer concentration on peak shape and retention was studied. Separations were performed using ammonium bicarbonate buffer, pH 9.0 at 5, 10, 15, and 20 mM in both mobile phase A and B. Figure 3 shows the results of this study using as an example the separation of 2PG and 3PG. We can see that increasing the buffer concentration increases the retention time of the analytes. In fact, this phenomenon was observed for all the analytes in this study. 15 mM ammonium bicarbonate pH 9.0 buffer gave the best peak shape for 3PG as well as for other analytes and was chosen for the final method.
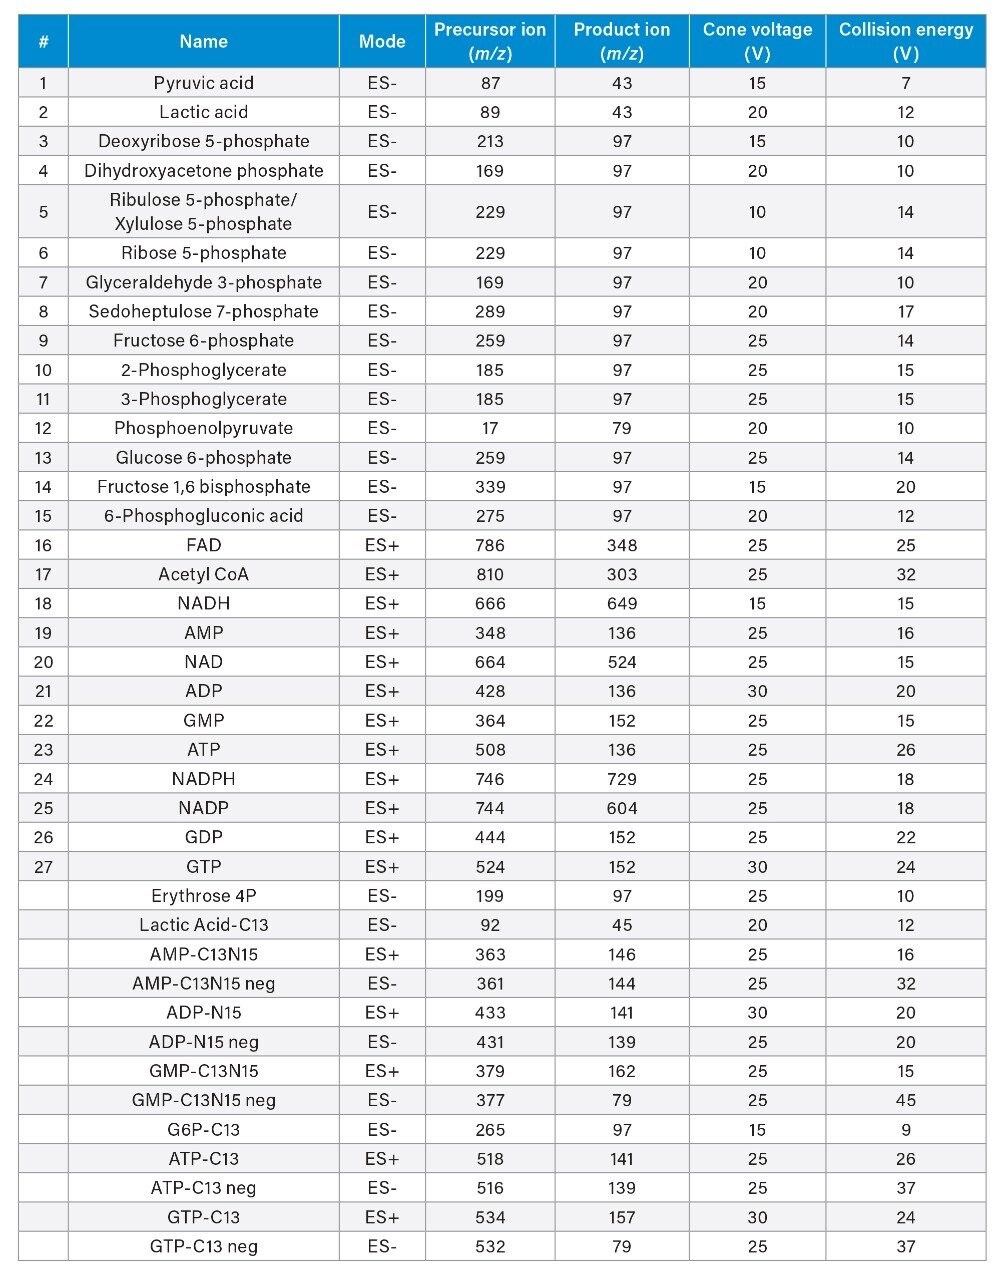
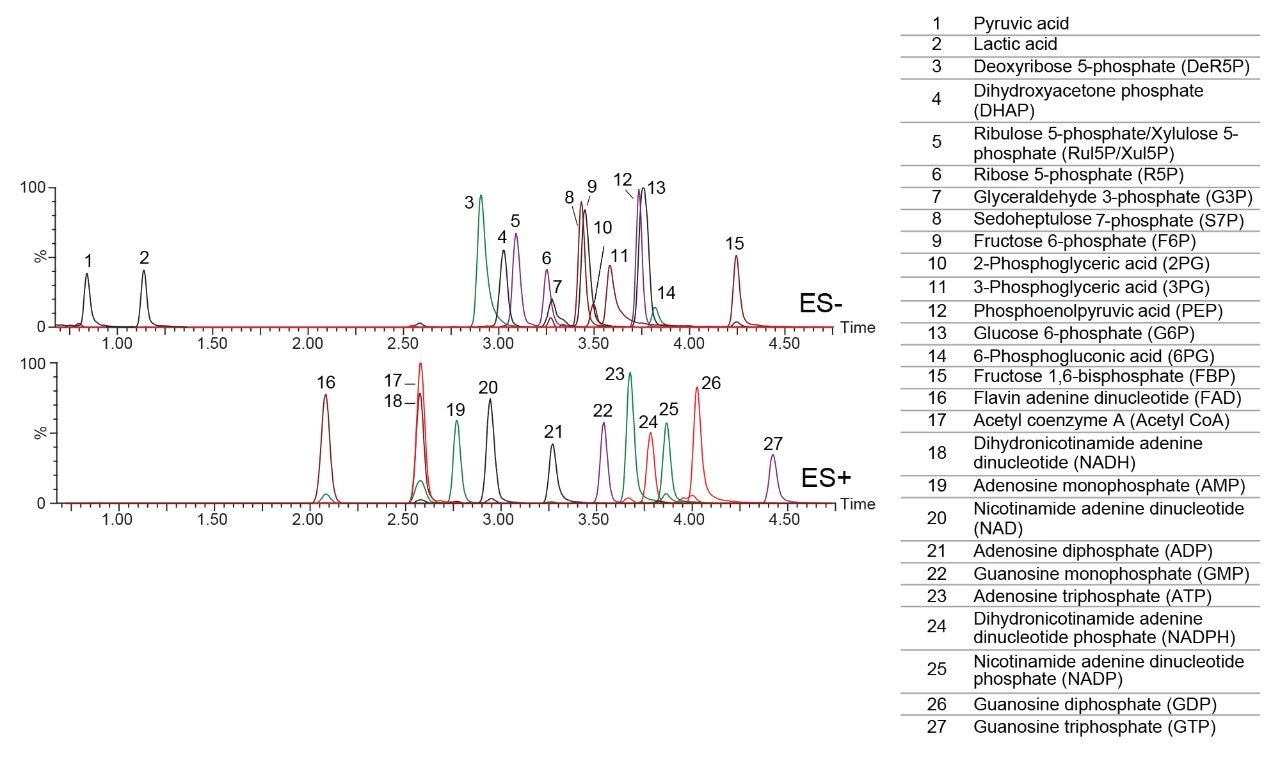
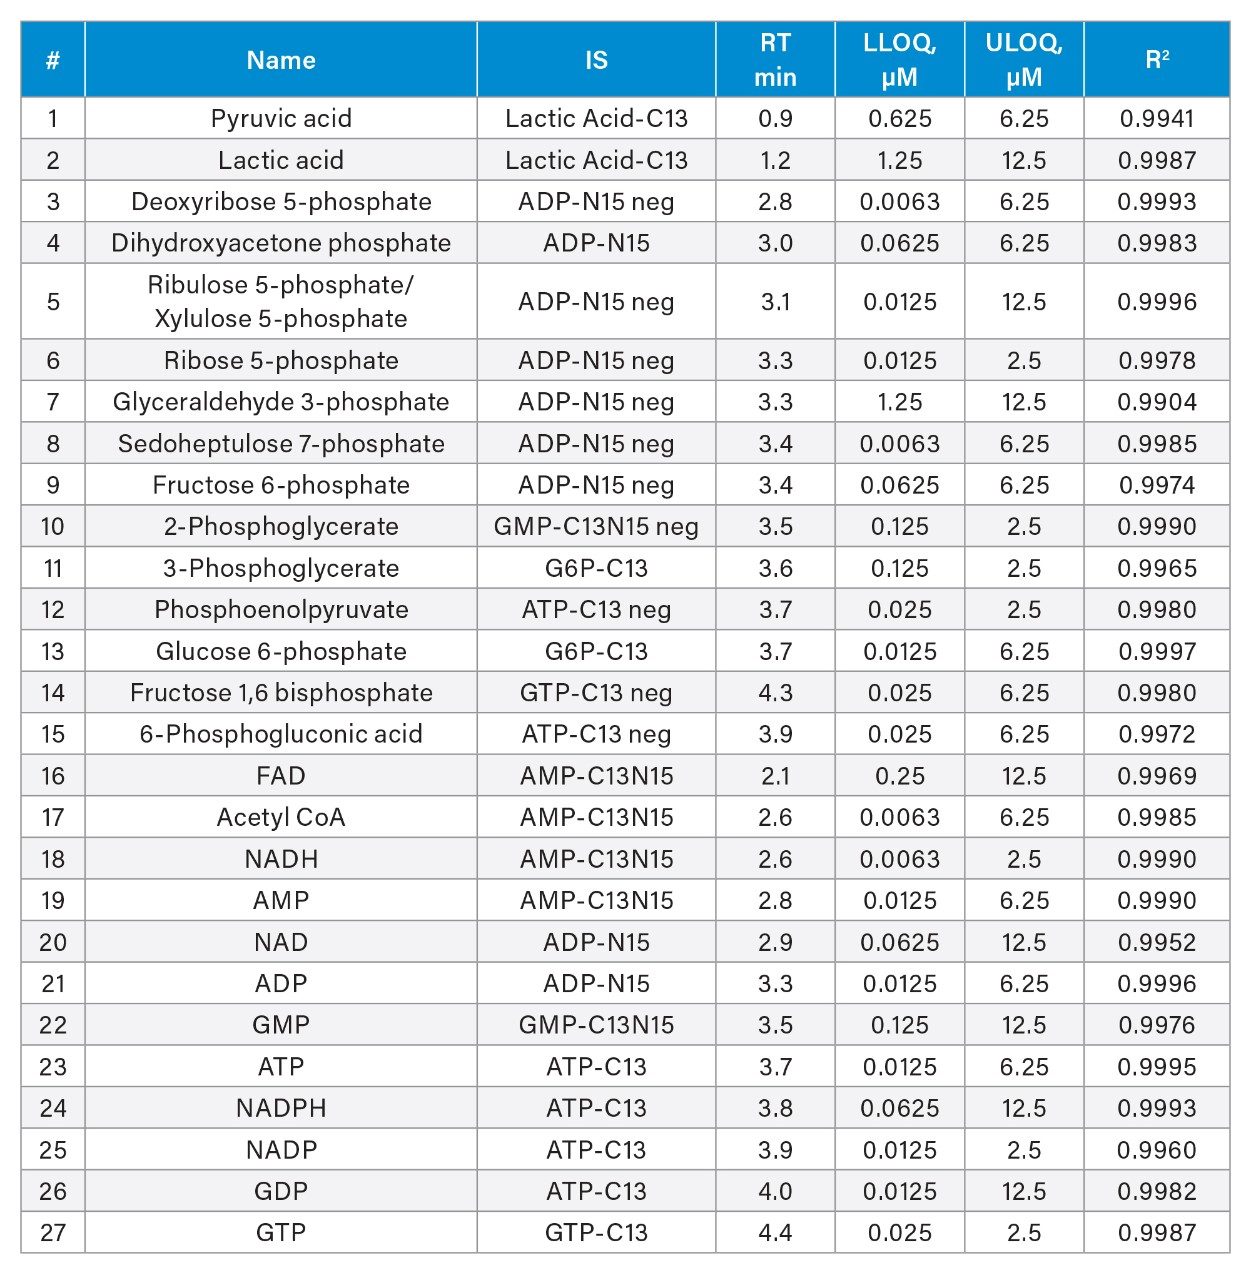
The MS conditions were optimized by infusing each analyte into the mass spectrometer. The optimal parameters are shown in Table 1. A representative separation of twenty-seven analytes dissolved in 50:50 acetonitrile/water is shown in Figure 4. A 2.1 x 100 mm, 1.7 μm Atlantis Premier BEH Z-HILIC Column was used at a flow rate of 0.5 mL/min. Chromatograms detected using positive and negative ion electrospray (ES) ionization are shown separately. Sharp symmetric peaks were observed for nearly all the analytes. The isobaric pairs ribulose 5P/ribose-5P and 2PG/3PG were well resolved. Calibration curves were created for all 27 analytes, using peak areas ratioed to stable isotope labelled internal standards. The correlation coefficients ranged from 0.9904 for glyceraldehyde-3-phosphate to 0.9996 for ribulose5P/xylulose5P and ADP (see Table 2). The lower limits of quantification (LLOQ) ranged from 0.0063 to 1.25 μM.
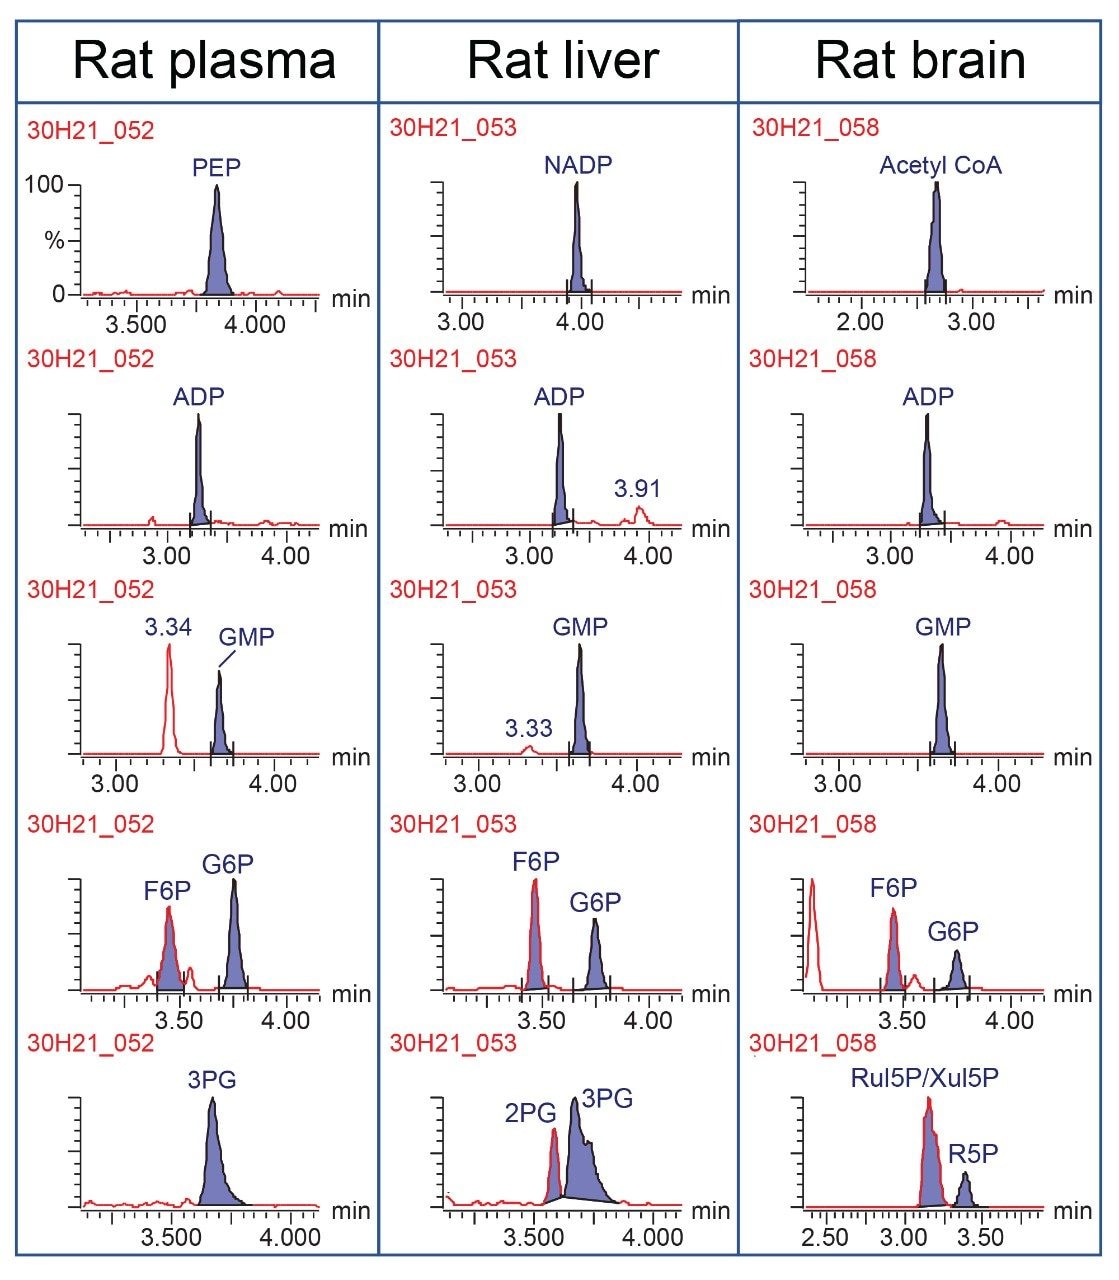
This method was used for targeted analysis of the twenty-seven analytes in rat plasma, rat liver, and rat brain extracts. Representative chromatograms are shown in Figure 5. The sharp, symmetric peaks observed for the standards prepared in solvent were also seen in these tissue extracts. Phosphoenol pyruvate (PEP) was detected at a high concentration in the plasma sample, as was 3PG, ADP, GMP, fructose-6-phosphate (F6P), and glucose-6-phosphate (G6P). The three latter metabolites were also observed in both the liver and brain tissue samples. In addition, a high concentration of nicotinamide adenine dinucleotide phosphate (NADP) was seen in the liver extract, while the brain extract had a high level of acetyl coenzyme A (Acetyl CoA).
Conclusion
We developed a sensitive UPLC-MS/MS method for the targeted analysis of twenty-seven pentose phosphate pathway, glycolysis, and energy metabolites in plasma and tissue extracts. Using an ACQUITY Premier System and an Atlantis Premier BEH Z-HILIC Column we achieved sharp, symmetric peaks for these challenging analytes. The stability of the BEH Z-HILIC column to basic mobile phases was essential for this method, since the best peak sharpness, peak symmetry, and sensitivity was achieved for many of the metabolites when using a pH 9.0 ammonium bicarbonate buffer. These results suggest that the ACQUITY Premier System and Atlantis Premier BEH Z-HILIC Columns will be useful for polar metabolomics assays, particularly for metabolites that interact with metal surfaces.
References
- Murray RK, Bender DA, Botham KM, Kennelly PJ, Rodwell VW, Weil PA. Harper's Illustrated Biochemistry, 28th ed. New York: McGraw-Hill, Chapters 16–18 and 21, Pages 131–156 and 174–183, 2009.
- Ge T, Yang J, Zhou S, Wang Y, Li Y, Tong X. The Role of the Pentose Phosphate Pathway in Diabetes and Cancer. Front in Endocrinol, 11:365, 2020.
- Walter TH, Berthelette KD, Patel A, Alden BA, McGlaughlin J, Field J, Lawrence N, Shiner S. Introducing Atlantis BEH Z-HILIC: A Zwitterionic Stationary Phase Based on Hybrid Organic/Inorganic Particles, Waters Application Note 720007311EN, July 2021.
- Lauber M, Walter TH, Gilar M, DeLano M, Boissel C, Smith K, Birdsall R, Rainville P, Belanger J, Wyndham K. Low Adsorption HPLC Columns Based on MaxPeak High Performance Surfaces, Waters White Paper 720006930EN, Oct 2020.
- Want EJ, Masson P, Michopoulos F, Wilson ID, Theodoridis G, Plumb RS, Shockcor J, Loftus N, Holmes E, Nicholson JK. Global Metabolomic Profiling of Animal and Human Tissues via UPLC-MS. 8, 17–32, 2013.
- Bajad SU, Lu W, Kimball EH, Yuan J, Peterson C, Rabinowitz JD. Separation and Quantitation of Water Soluble Cellular Metabolites by Hydrophilic Interaction Chromatography–Tandem Mass Spectrometry, J. Chromatogr. A.; 1125:76–88, 2010.
- Teleki A, Sánchez-Kopper A, Takors R. Alkaline Conditions in Hydrophilic Interaction Chromatography for Intracellular Metabolite Quantification Using Tandem Mass Spectrometry. Anal. Biochem.; 475:4–13, 2015.
- Zhang T, Creek DJ, Barrett MP, Blackburn G, Watson DG. Evaluation of Coupling Reversed Phase, Aqueous Normal Phase, and Hydrophilic Interaction Liquid Chromatography With Orbitrap Mass Spectrometry for Metabolomic Studies of Human Urine. Anal. Chem.; 84:1994–2001, 2012.
- Zhang R, Watson DG, Wang L, Westrop GD, Coombs GH, Zhang T. Evaluation of Mobile Phase Characteristics on Three Zwitterionic Columns in Hydrophilic Interaction Liquid Chromatography Mode for Liquid Chromatography-High Resolution Mass Spectrometry Based Untargeted Metabolite Profiling of Leishmania Parasites. J. Chromatogr. A.; 1362:168–179, 2014.
- DeLano M, Walter TH, Lauber MA, Gilar M, Jung MC, Nguyen JM, Boissel C, Patel AV, Bates-Harrison A, Wyndham KD. Using Hybrid Organic-Inorganic Surface Technology to Mitigate Analyte Interactions With Metal Surfaces in UHPLC. Anal. Chem.; 93(14): 5773–5781, 2021.
- Walter TH, Trudeau M, Simeone J, Rainville P, Patel AV, Lauber MA, Kellett J, DeLano M, Brennan K, Boissel C, Birdsall R, Berthelette K. Low Adsorption UPLC Systems and Columns Based on MaxPeak High Performance Surfaces: The ACQUITY Premier Solution. Waters White Paper 720007128EN, Feb 2021.
720007411, Revised November 2021