Comprehensive Two-Dimensional Analysis of Graft Polymers
This is an Application Brief and does not contain a detailed Experimental section.
Abstract
Two graft copolymer samples deriving from the same starting materials need not to be alike, especially if the polymerizations were conducted under different conditions. Structural differences may comprise different lengths of side chains and backbone or the distribution of side chains among the different molecules. Using a size-based separation technique, separation of the analyte fractions is achieved, if the fractions have sufficiently different hydrodynamic volumes. However, polymers can differ in structure but may have identical hydrodynamic sizes so that co-elution occurs. Adding a chemistry-based separation to a separation based on size using a two-dimensional (2D) analytical approach can resolve co-eluting fractions.
Benefits
Graft polymers can be analyzed by comprehensive 2D analysis using WinGPC software for data acquisition and processing.
Introduction
Size exclusion chromatography (SEC) is a suitable analytical tool for the analysis of simple polymers. It allows for batch-to-batch comparisons and simple screening purposes. Reliable molecular weight (MW) data can be obtained if no co-elution occurs. Based on the separation principle of SEC, i.e., separation by hydrodynamic volume, co-elution occurs when the hydrodynamic volumes of two compounds are identical. Often, increasing the chromatographic resolution by using a multi-column bank does not solve this problem. However, adding an additional separation dimension based on another structural feature, for example by chemistry, can eventually resolve co-elution occurrences. A separation by chemistry can be achieved by allowing for interaction of repeating units, functional groups, and/or branched moieties with the packing surface due to their different affinity. A sequential elution of the sample components can be realized by modifying the interaction strength of a gradient induced changing mobile phase composition.
By combining both dimensions, the separation power can be greatly improved. Such a combination bears an excellent separation tool for complex polymers with different chain lengths, but multiple functional groups, different graft densities, different block lengths, etc. All these structural and functional polymers are no longer considered simple polymers, because they may possess heterogeneity not only with respect to molecular weight, but with respect to end-groups, functionality, chemical composition, topology, etc. Furthermore, information gathered from either one of the dimensions in single mode, does not sufficiently describe the composition of a complex polymer sample.
Using a gradient separation in the first dimension of a 2D separation approach is beneficial for sample loading. A high sample loading is required, so that the analyte concentration of the fractions transferred and separated in the second dimension is not too low for the detection. If MW information is needed, the second (SEC) dimension can be calibrated using molecular weight reference materials.
From an instrumental perspective, the two individual separation dimensions outlined above are connected by an 8-port valve that entails two sample loops. The software controls the valve switching back and forth between both loops. Once the first loop is filled with the effluent exiting the first-dimension column, the valve is switched. The second-dimension pump is now flushing the loop contents of the first loop onto the second-dimension column. While the content of the first loop is separated by size. The time it takes to fill one loop must match the run time of the second dimension analysis. The second loop is filled with the effluent of the first-dimension column. In comprehensive 2D chromatography, the entire sample amount injected into the first dimension is analyzed in the second dimension and is eventually passing through the detector. Using ACQUITY™ Advanced Polymer Chromatography System components as an example, Figure 1 demonstrates a typical instrumental set-up featuring a quaternary solvent manager stack for the first dimension and an isocratic solvent manager stack for the second dimension.
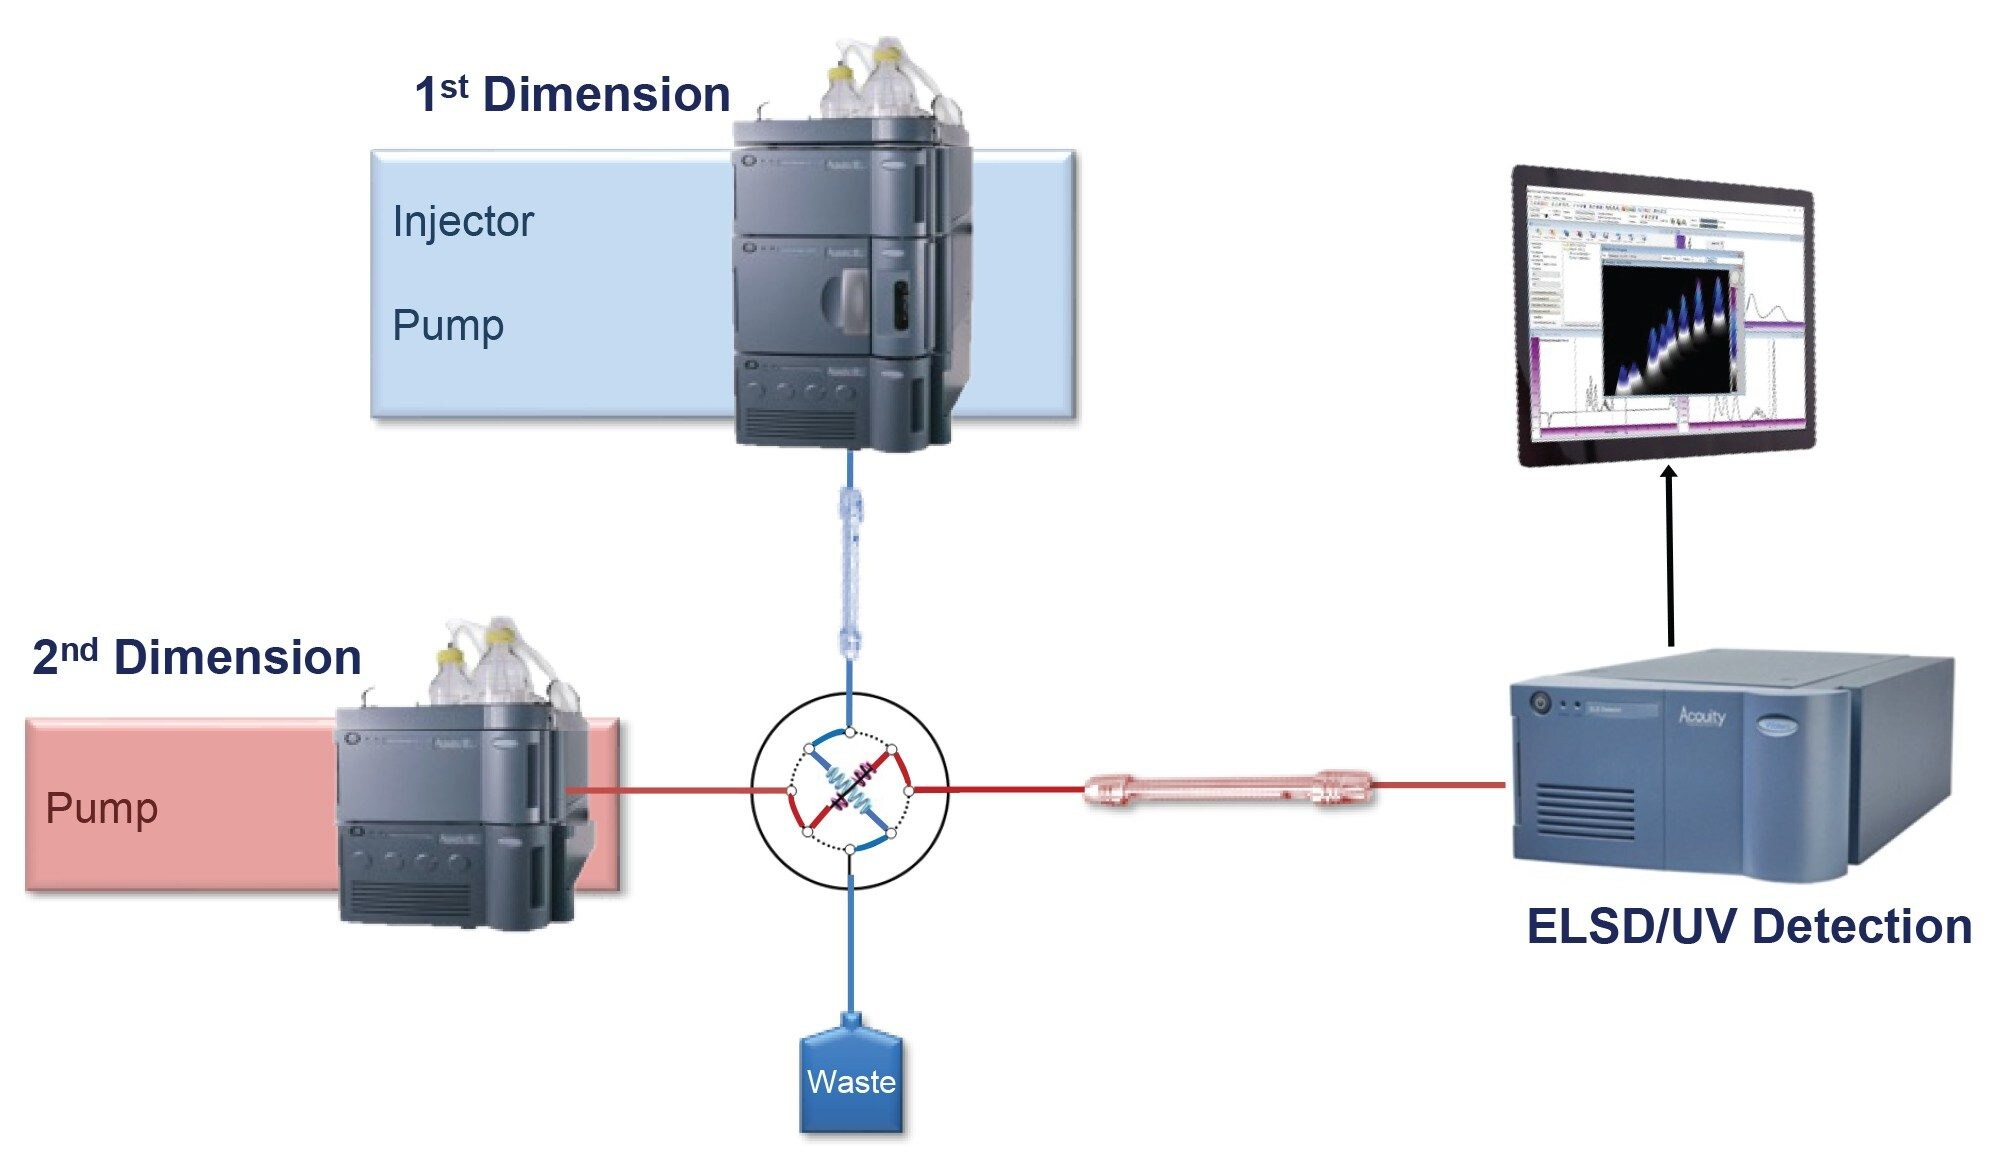 Figure 1. Instrumental set-up for a 2D application.
Figure 2 displays a screenshot of WinGPC from Polymer Standards Services (PSS). Each time the valve switches from one loop to the other, it is considered as an ‘injection’ and marked as a 'sample. (grey vertical line, bottom of Figure 2).
All separated fractions from the first dimension entering the second dimension are integrated. This can easily be automated with the "quick analysis" function in WinGPC. After integrating the second dimension chromatograms, the software will merge all integrated, second dimension subfractions and create a two-dimensional chromatogram. Thus, a few clicks will transform the raw data into a multi-color contour plot (as displayed in Figure 5 and 6).
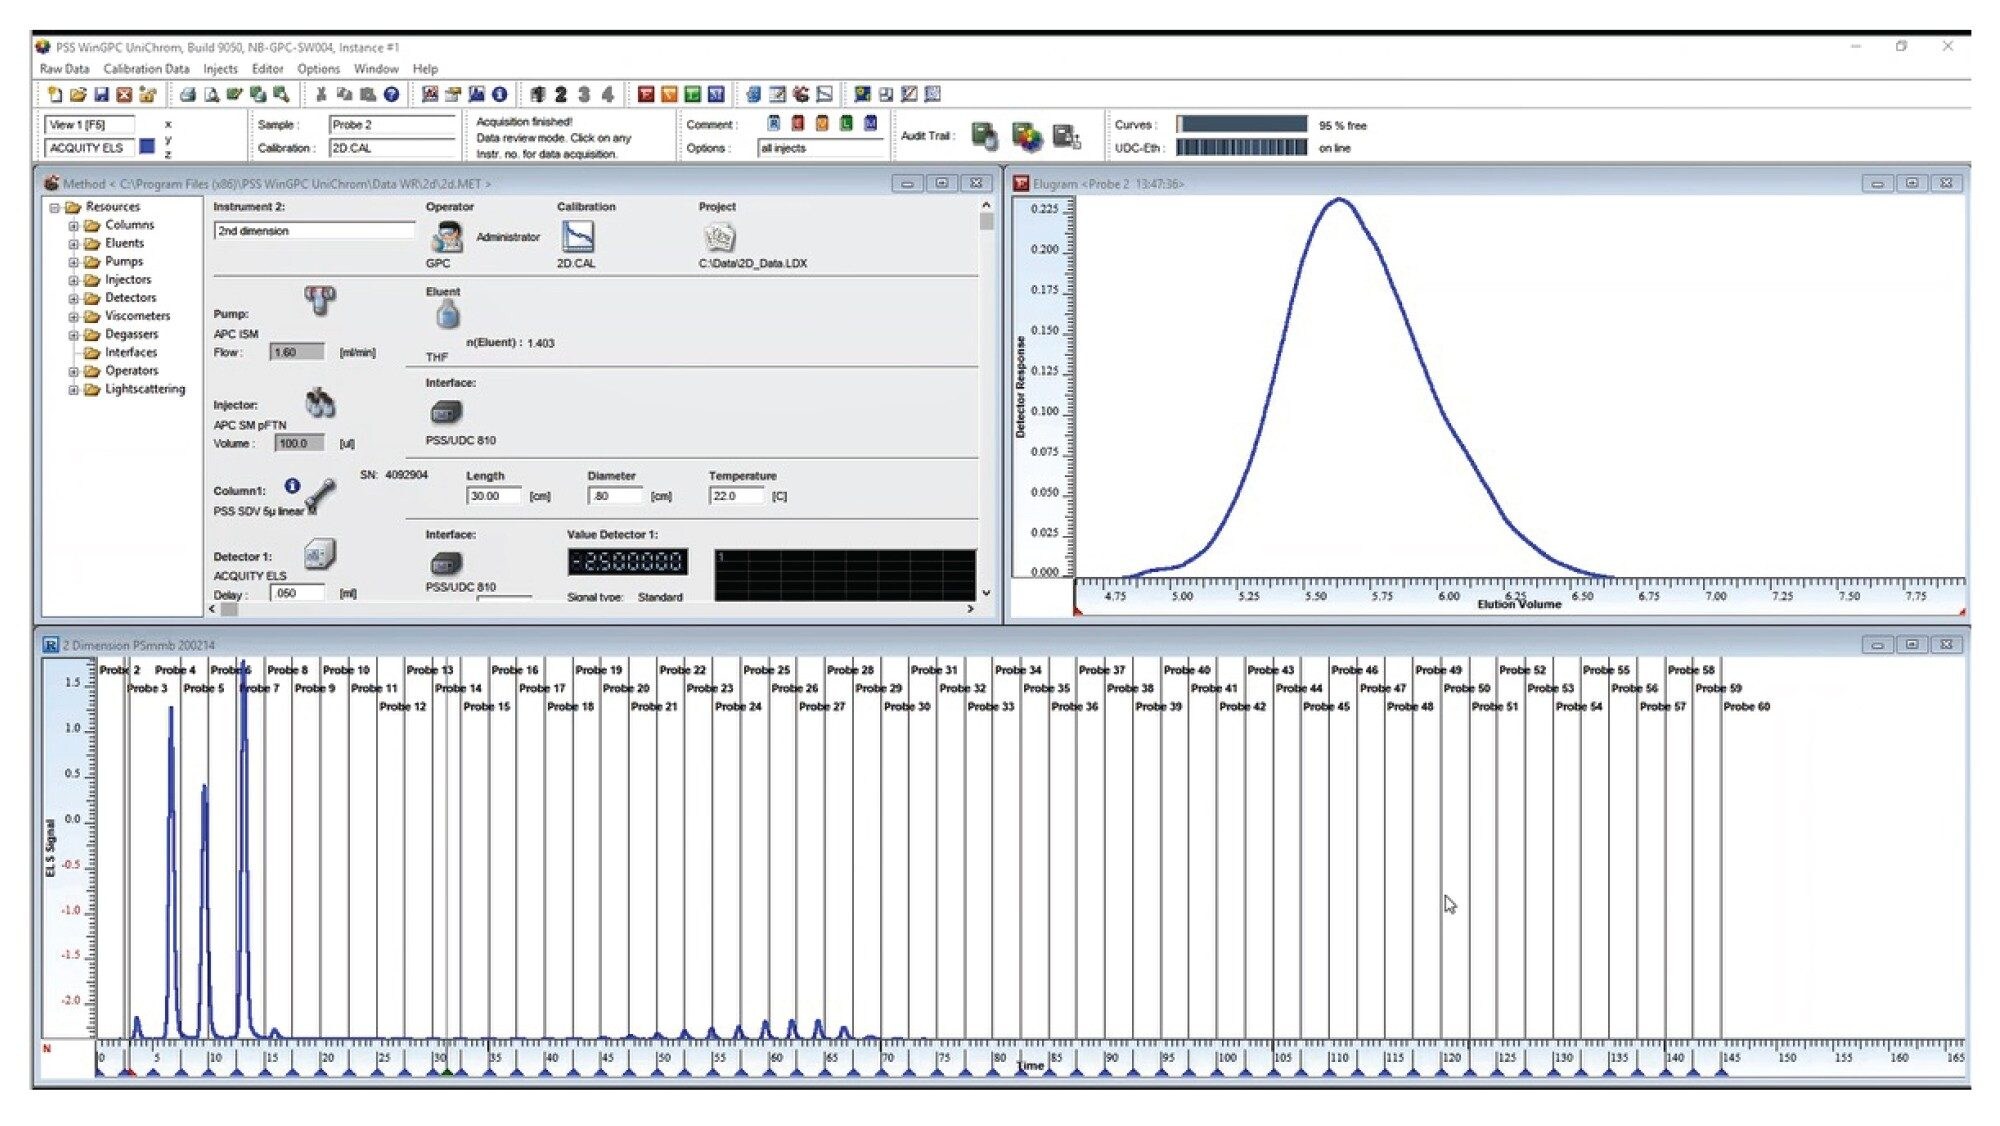 Figure 2. Method window (top left), raw data window (bottom across), and Elugram window of an individual injection (top right) of PSS WinGPC.
The focus of this app brief is the separation of two graft polymers. The backbone consists of polymethyl methacrylate (PMMA) and the side chains of polystyrene (PS). Both graft polymers derive from syntheses that were conducted under different conditions, applying, however, identical PMMA and polystyrene raw materials as well as identical raw material amounts.
Results and Discussion
As a preliminary step, the analytes were run separately on both individual dimensions. Figure 3 shows the overlaid ELSD traces from the gradient analysis. The chromatogram exhibits multiple peaks for both graft copolymers, sample a (red trace), and sample b (blue trace). It appears that despite having identical gross composition, both graft polymers consist of a different components resulting in with some baseline-separated peaks.
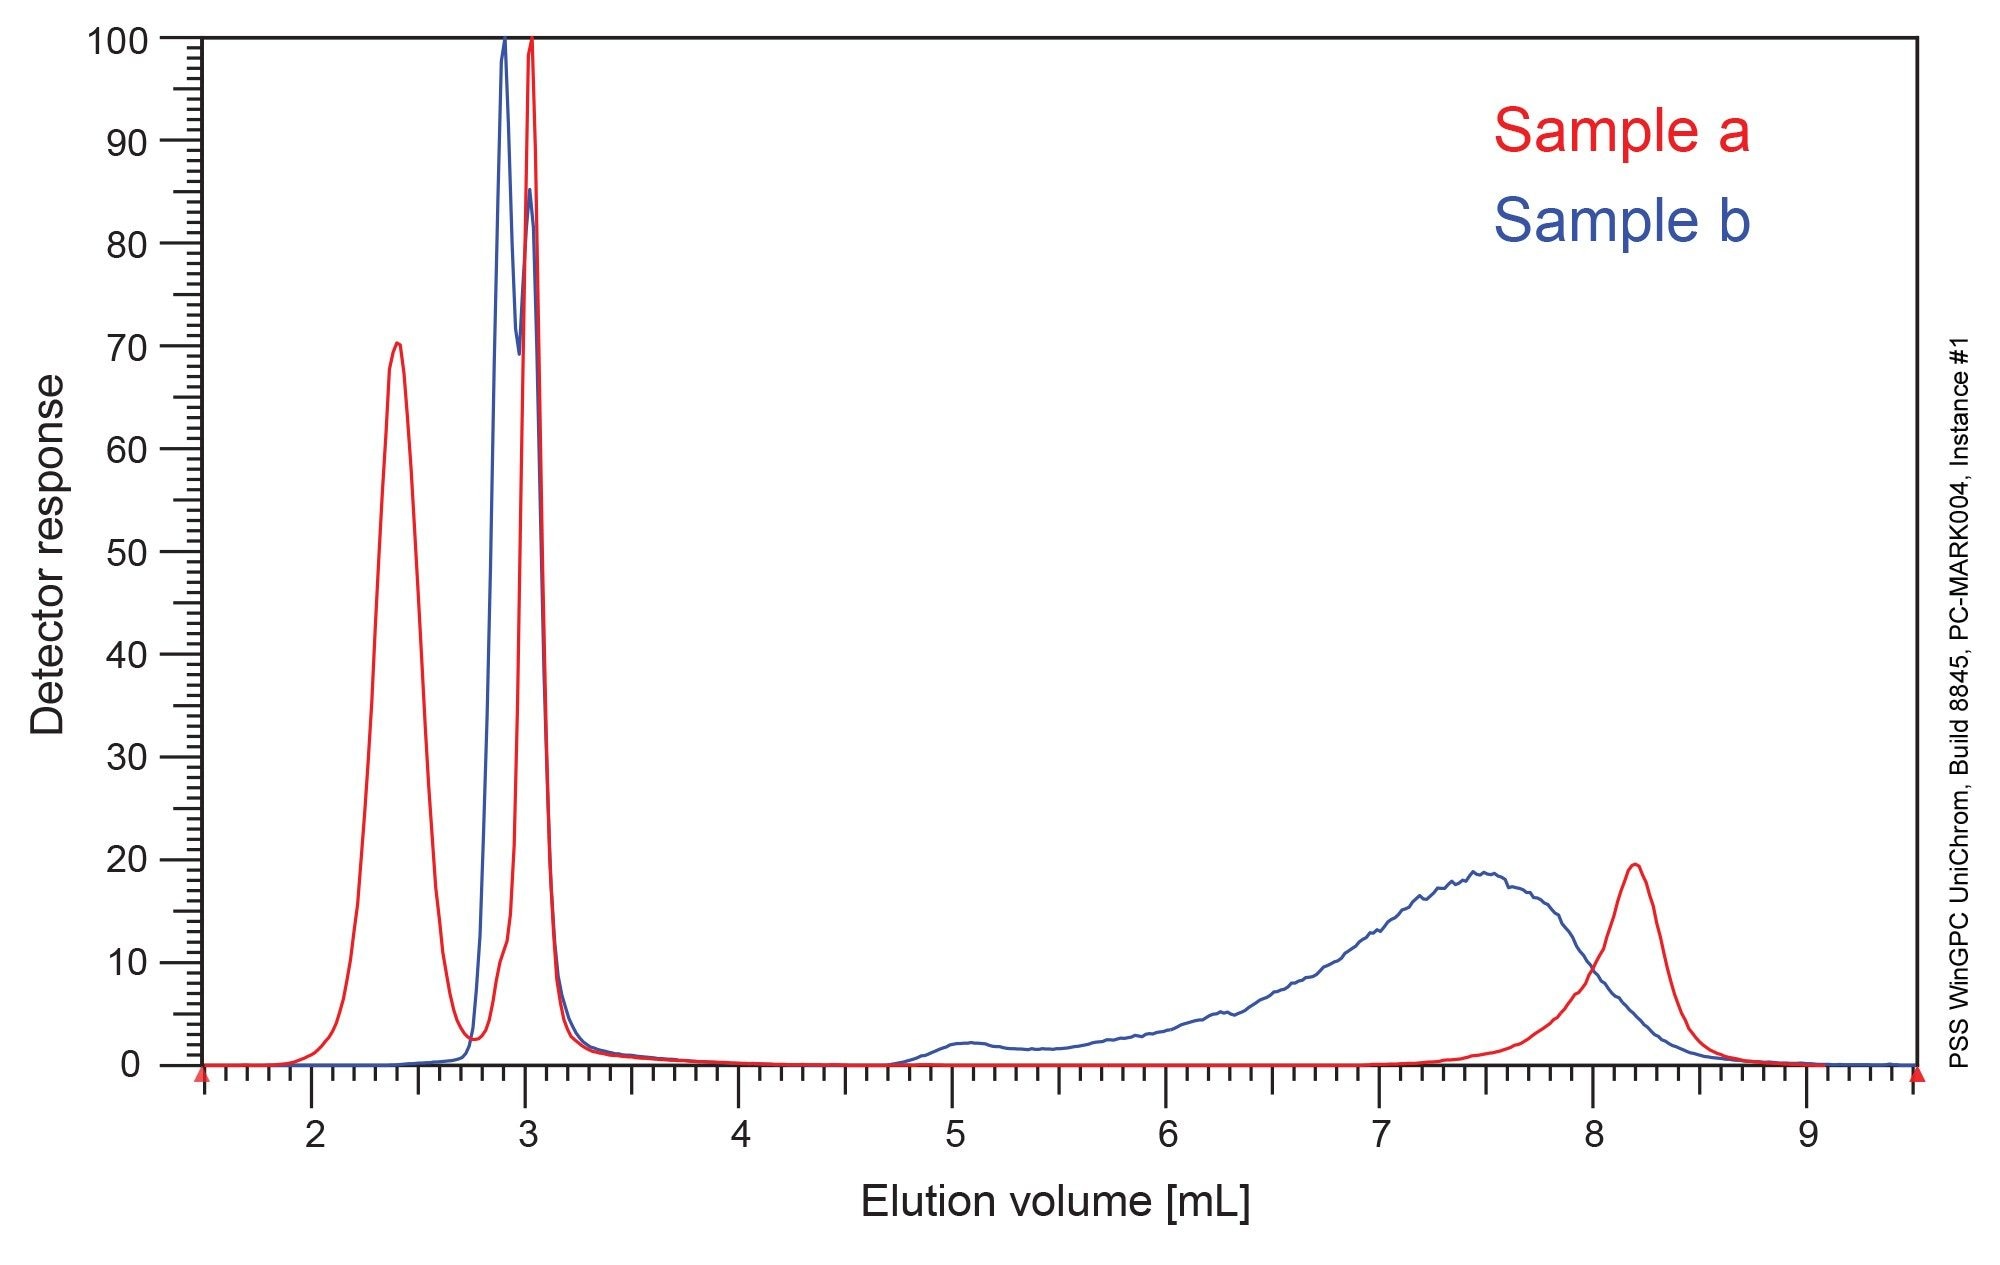 Figure 3. Overlaid ELSD traces from the chemistry-based, gradient analysis sample a (red trace), and sample b (blue trace).
Figure 4 depicts the single dimension size-based separated (SEC) chromatograms of both graft polymers. The overlaid SEC traces exhibit three distinct, but not baseline-separated peaks in total. Knowing that synthesis conditions were different, the unreacted side chains or backbone could still be present. As observed from the overlaid traces, the abundance of the separated fractions varies, hence the product compositions of the graft polymer samples are different. Both techniques performed in one dimensional mode yield insufficient information to confidently characterize these polymers.
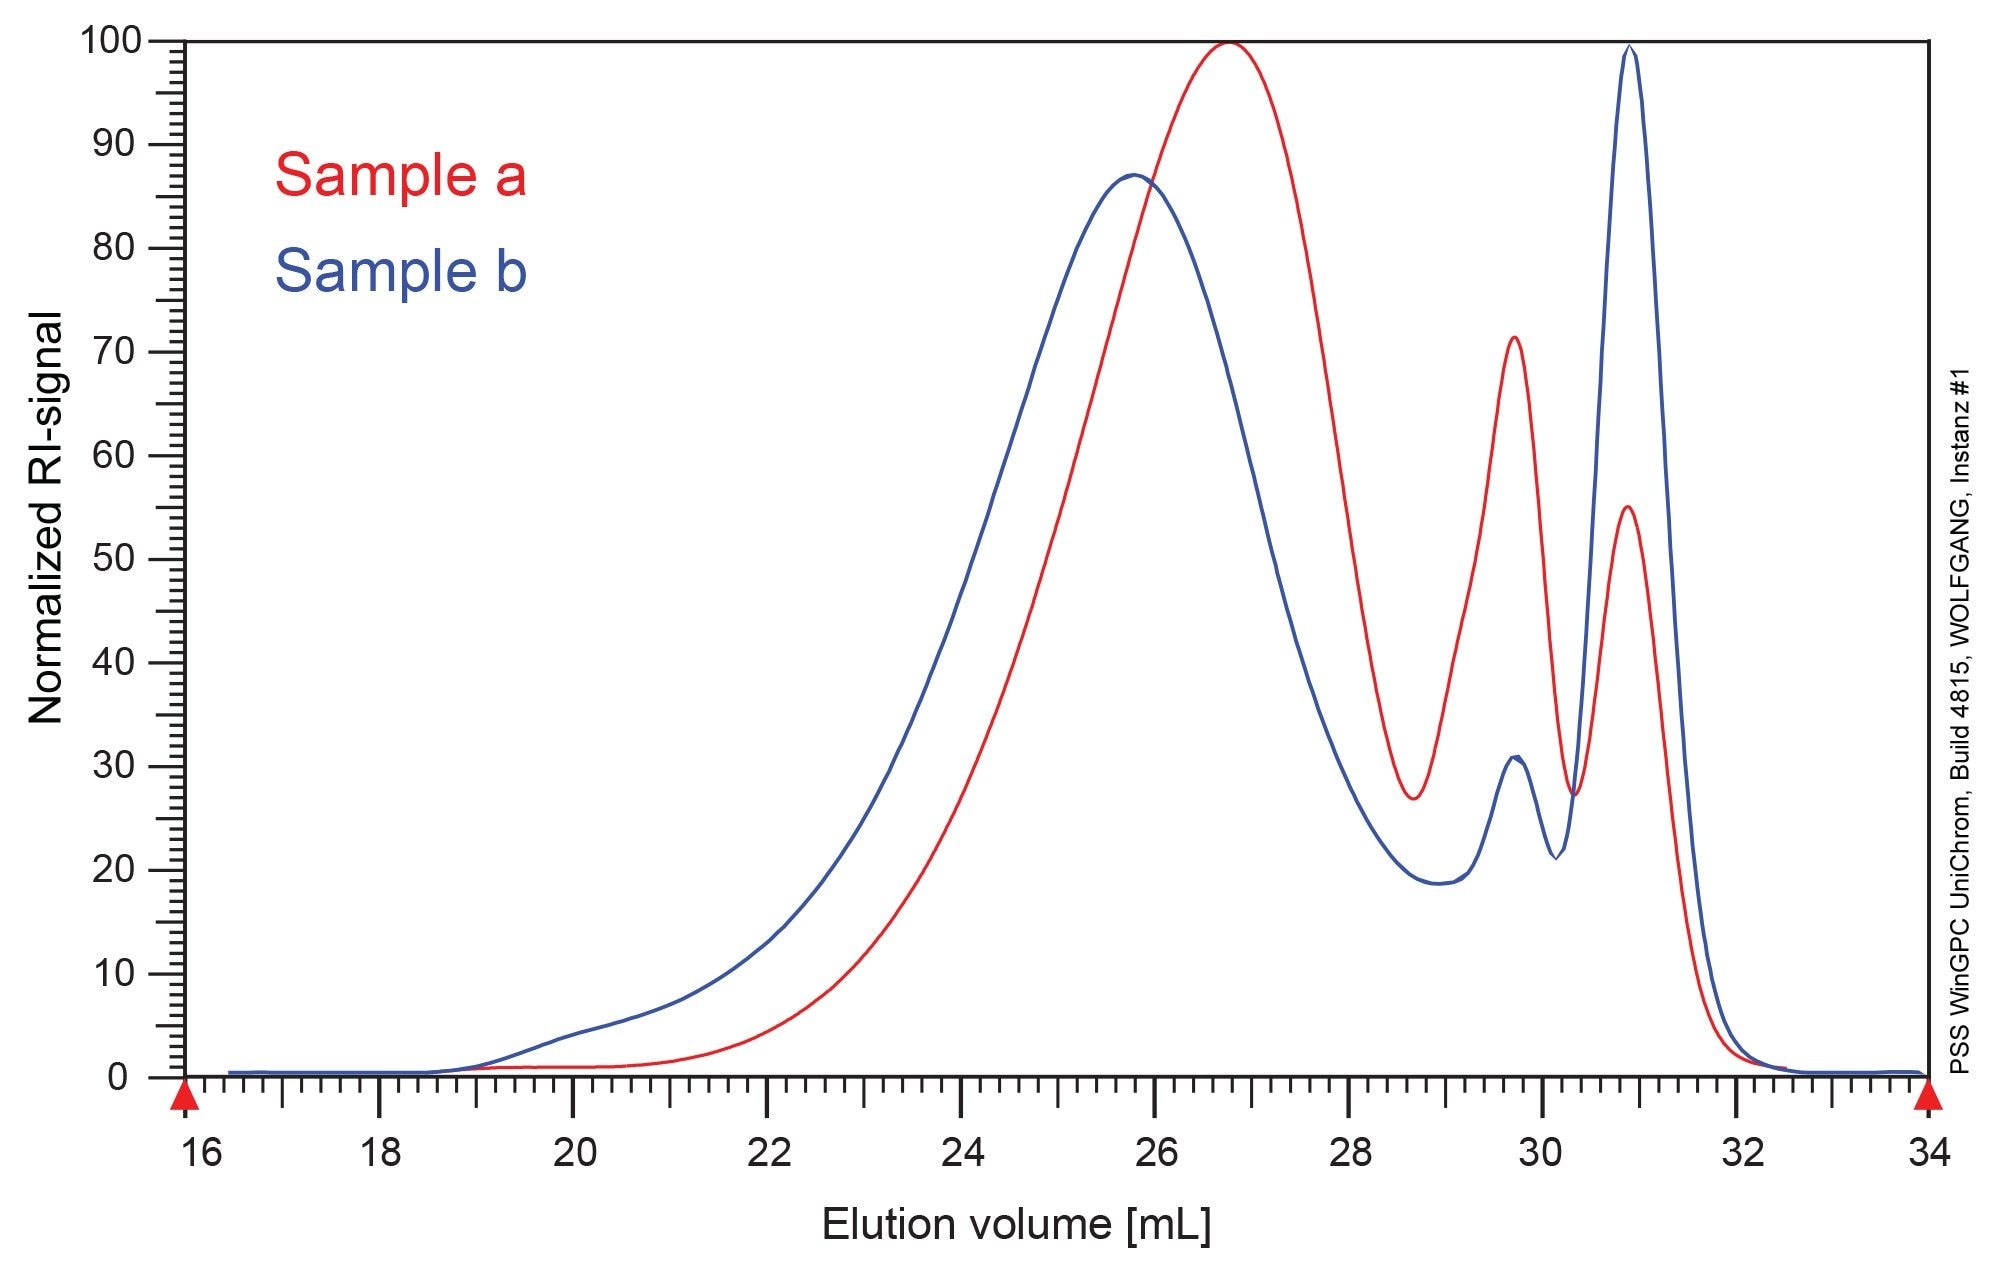 Figure 4. RI chromatogram of size-based separation of graft polymer samples a (red trace) and b (blue trace).
Next step was to combine both individual separations (chemistry and size-based) into a single, two-dimensional or 2D analysis to gain additional information. Figures 5 and 6 display the contour plots for both graft polymers a and b. The polymer sample a in Figure 5, exhibits three main peaks. The fraction eluting at the top, i.e., at around 7 mL on the y-axis corresponds to ungrafted backbone, i.e. pure PMMA. The fraction on the lower left-hand corner is the target polymer or graft polymer. Right next to the graft polymer fraction, there is a separate fraction consisting of unreacted side chains. Those two fractions were separated from one another compared to Figure 3.
Although the individual, one-dimensional SEC-traces appeared similar, the 2D result of sample b differs greatly from sample a. In the top half of the chromatogram in Figure 6, there is a large fraction of graft polymer with different grafting densities as evidenced by the extension along the y-axis. The contour plot also reveals the presence of unreacted side chains around a first-dimension elution volume of 3 mL on the y-axis as could also be seen in sample a. Comparing the contour plots of both samples, it becomes clear that the different synthesis strategies resulted in two very different product compositions, despite using the same educts at identical amounts.
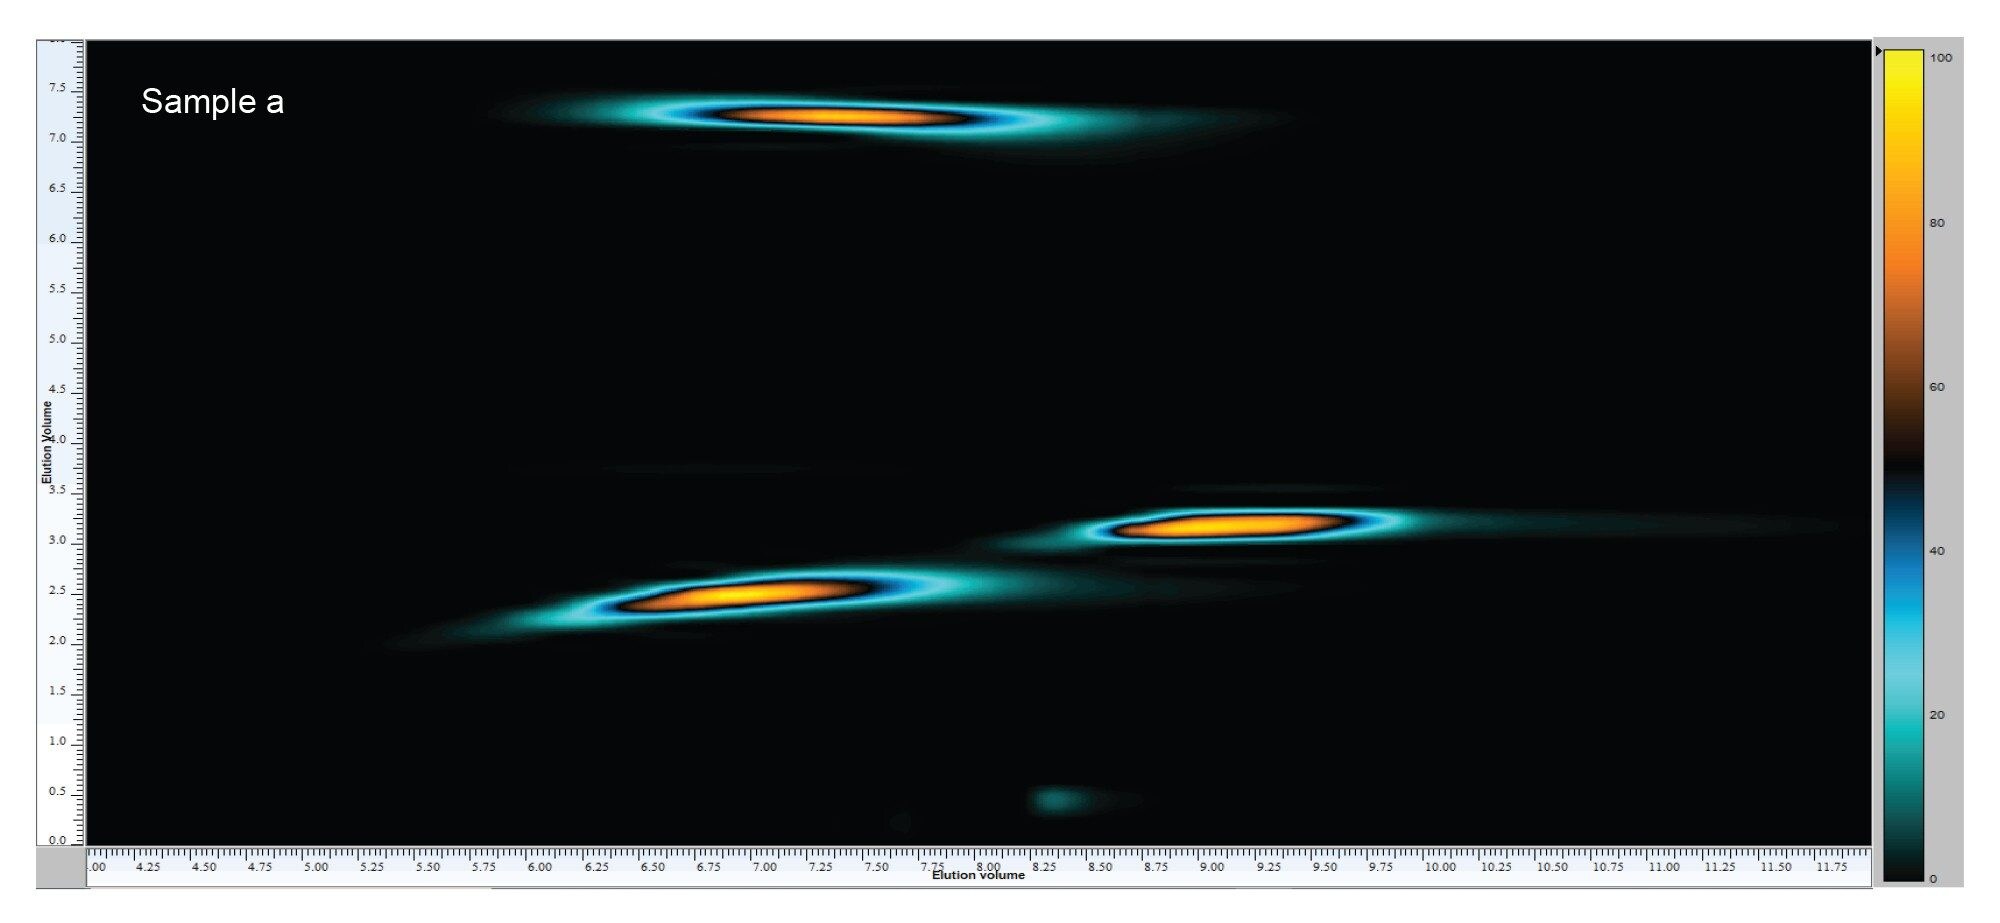 Figure 5. Contour plot of polymer sample a.
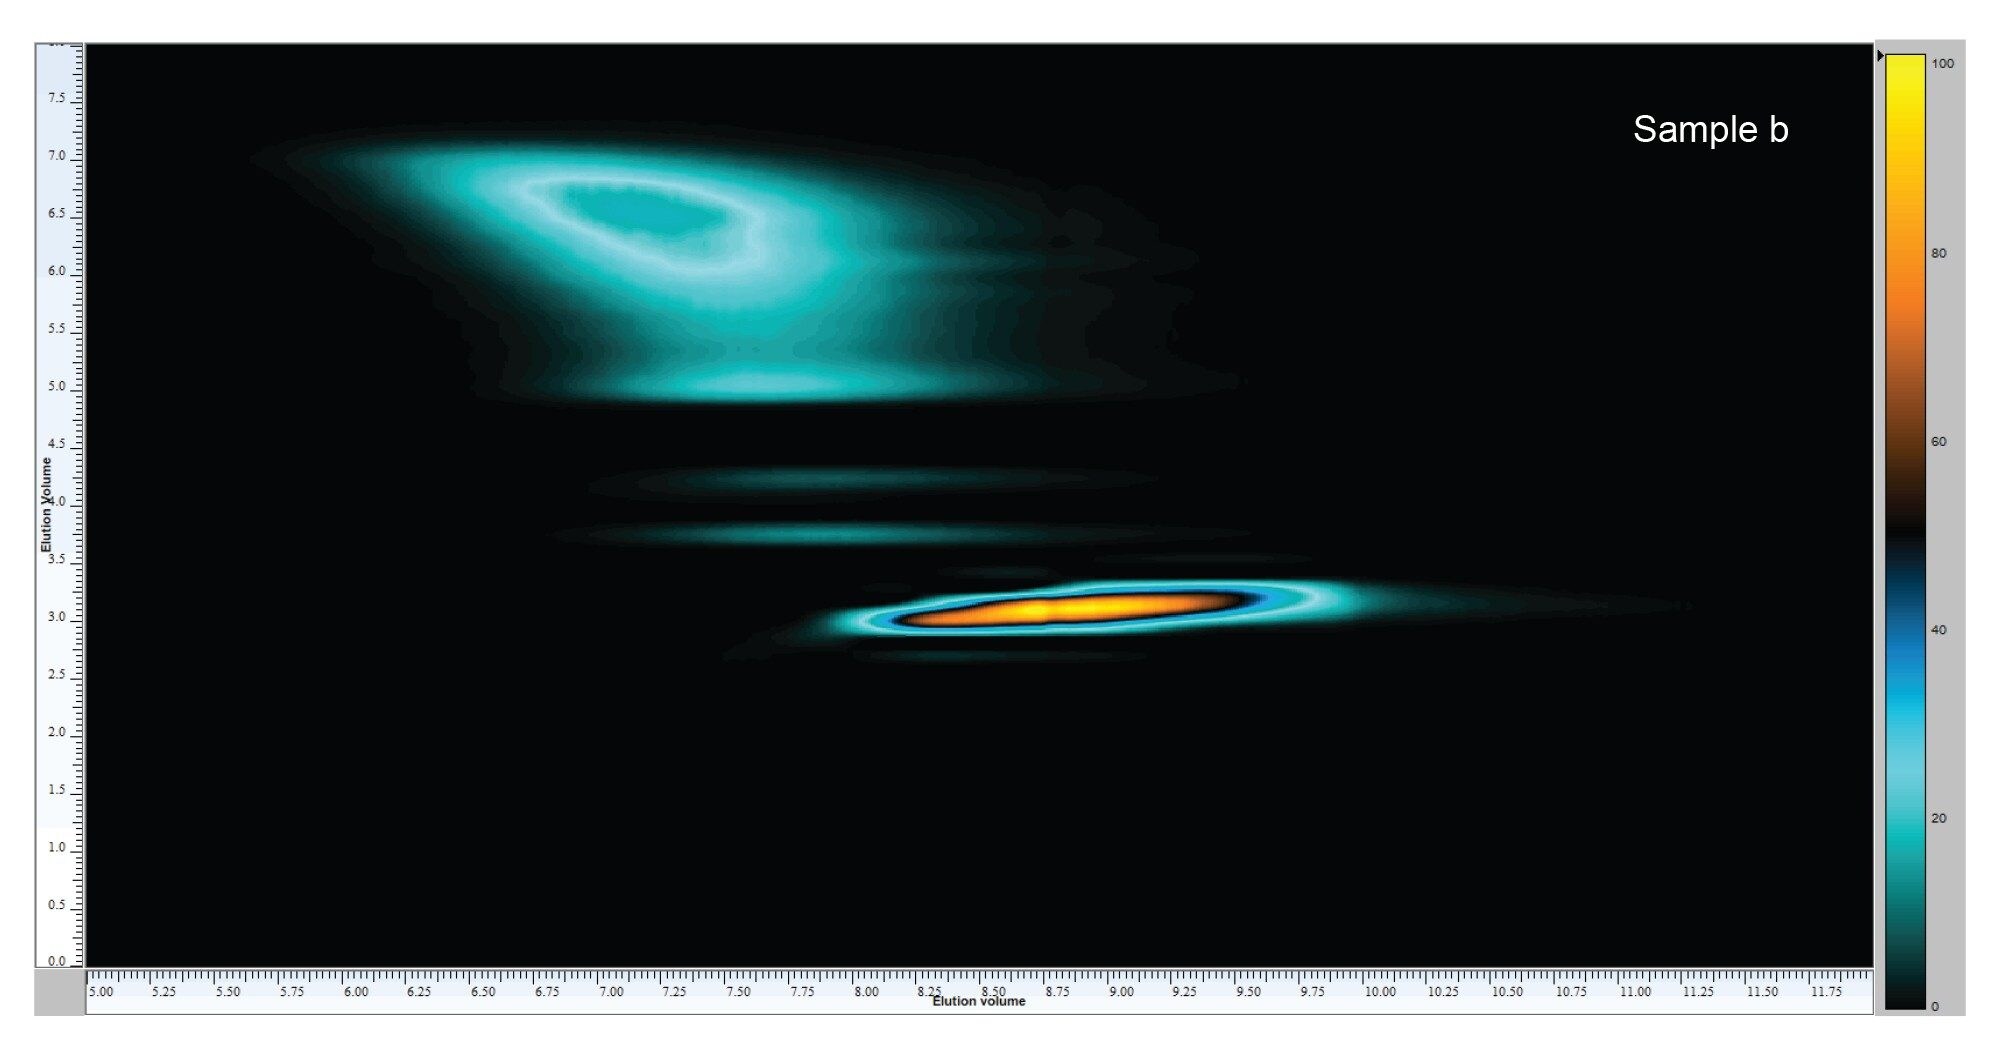 Figure 6. Contour plot of polymer sample b.
Migrating from 1D to 2D separation improved the separation, yet additional information such as MWs of the fractions relative to a standard can also be obtained for each peak of the two-dimensional chromatogram. The MW determination process is very similar to that of a one-dimensional SEC measurement. Prior to setting up the 2D measurement, the second dimension must be calibrated with suitable calibration standards. For the graft copolymers, multiple polystyrene standards were injected to cover the full separation range of the second-dimension column. The same was repeated with narrow distribution PMMA standards. Using graft polymer A as an example, the fractions of interest for MW determination are circled in the contour plot (Figure 7). The circling of fractions is also used to determine the volume percentage of each separated fraction. Different calibration curves can be assigned to the circled fraction, accounting for differences in the associated chemical compositions. WinGPC calculates the respective MW numbers. The numerical results of the defined fractions using the grid are shown in Table 1 for sample a and Table 2 for sample b. The MWs of the separated fractions of sample a ranges from approximately 3,000 Da to approximately 90,000 Da. The MW range for sample b spans approximately 3,000 to approximately 54,000 Da.
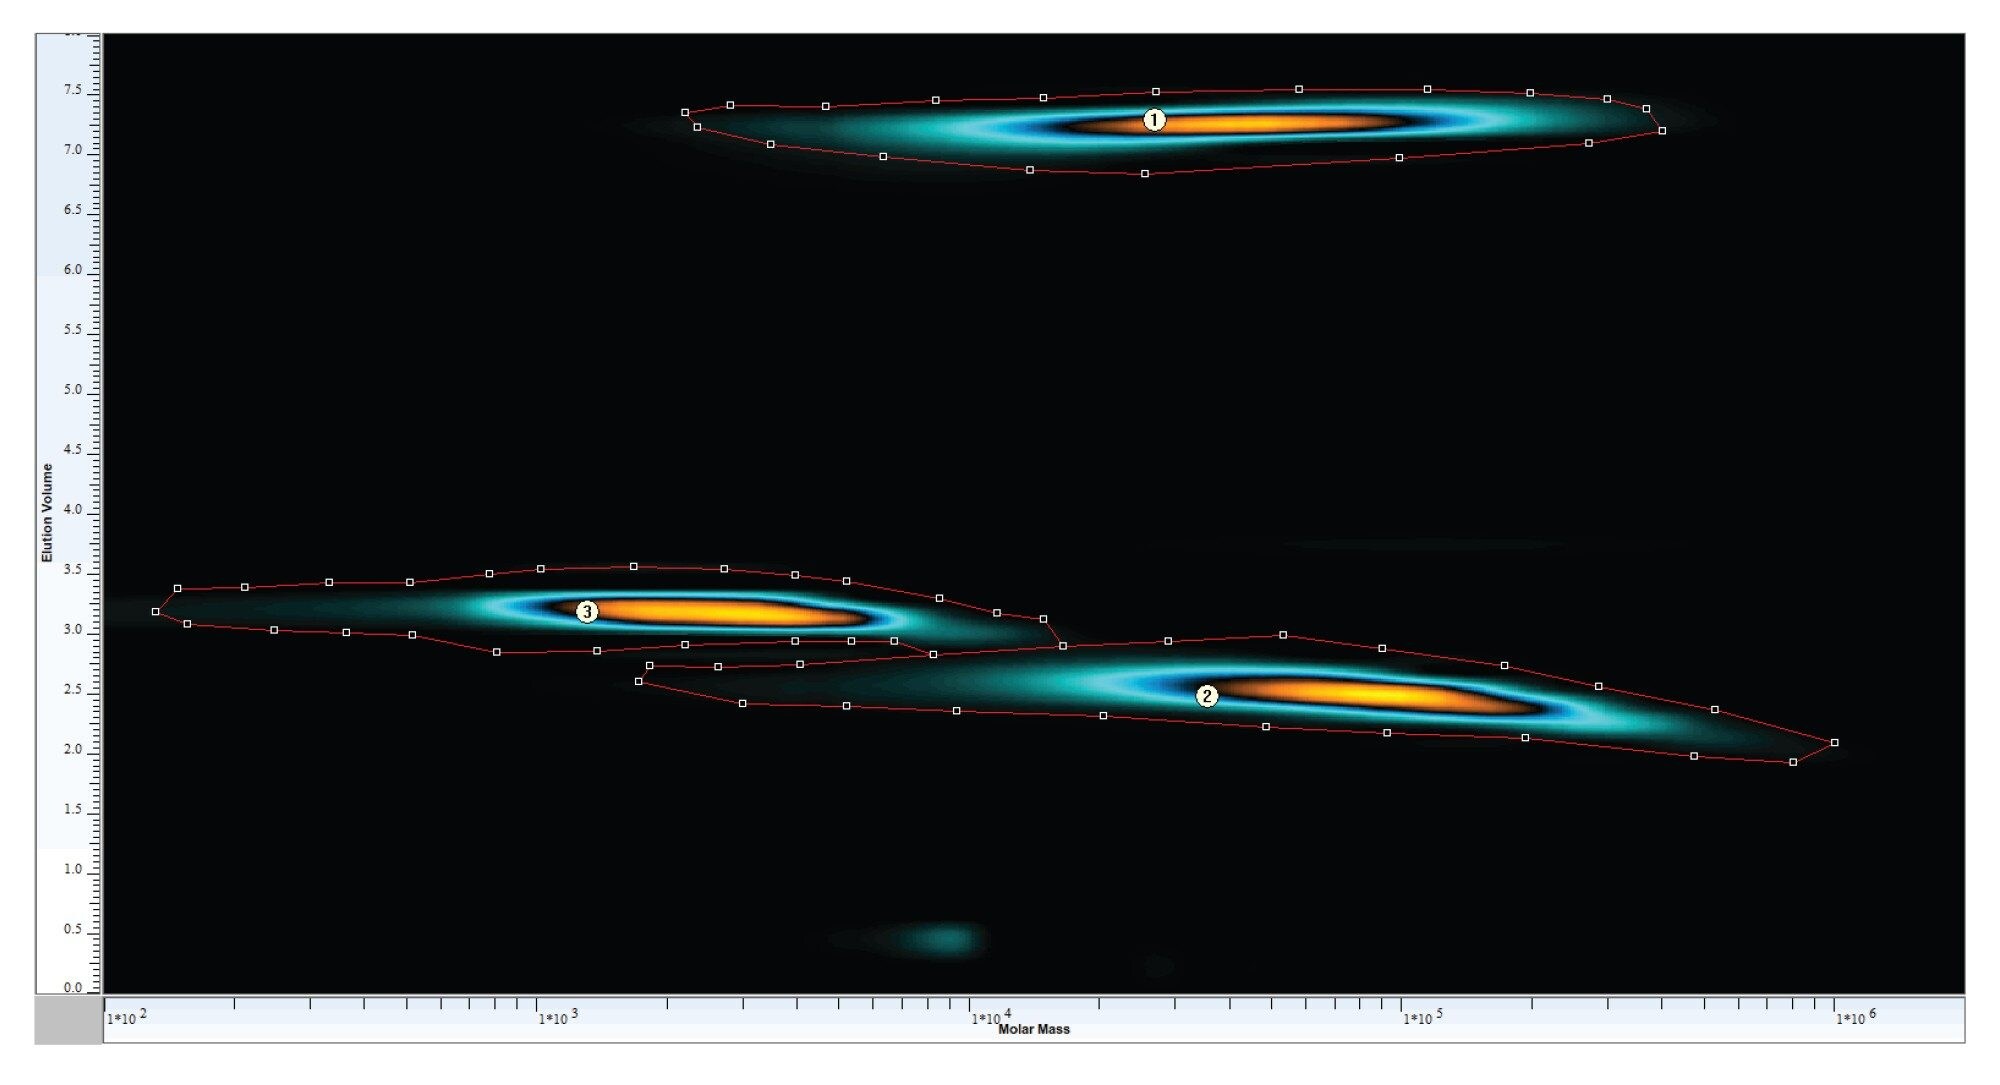 Figure 7. Contour plot of sample a with MW axis for MW determination.
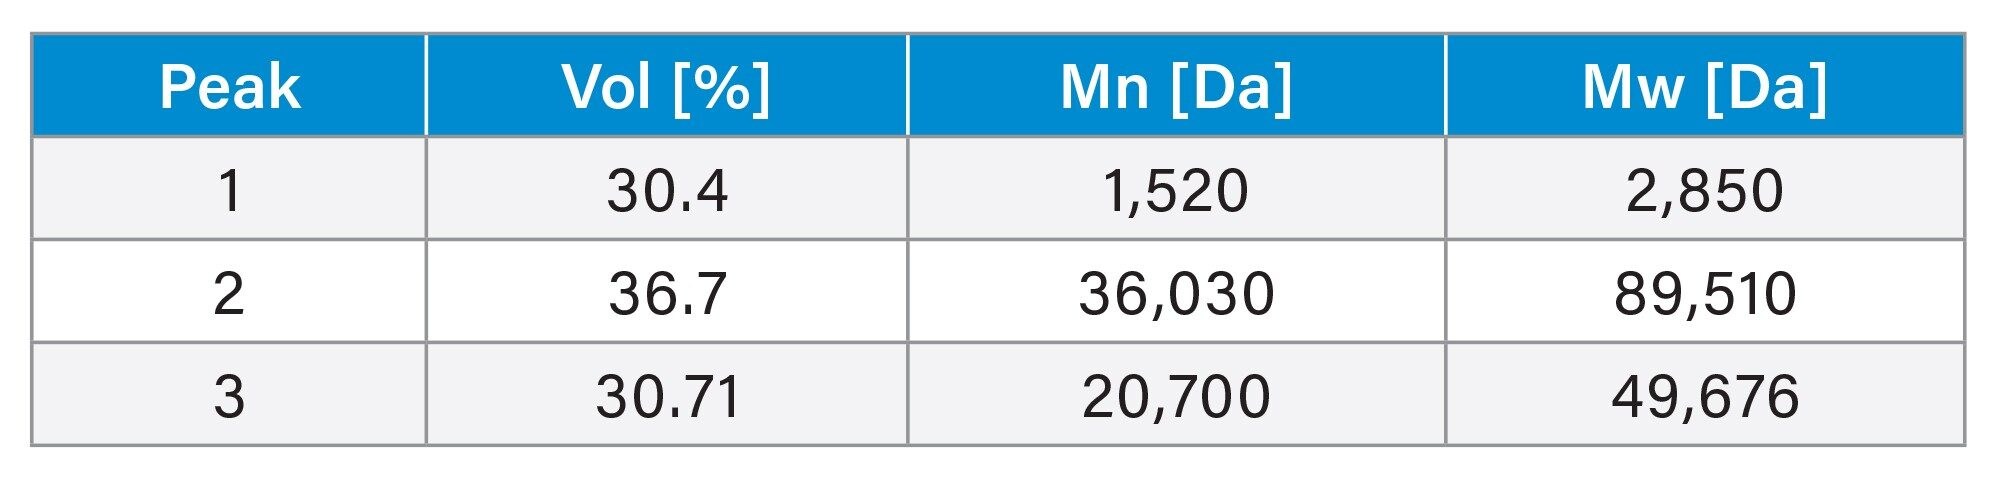 Table 1. Molecular weights and volume percentages of the fractions of sample a.
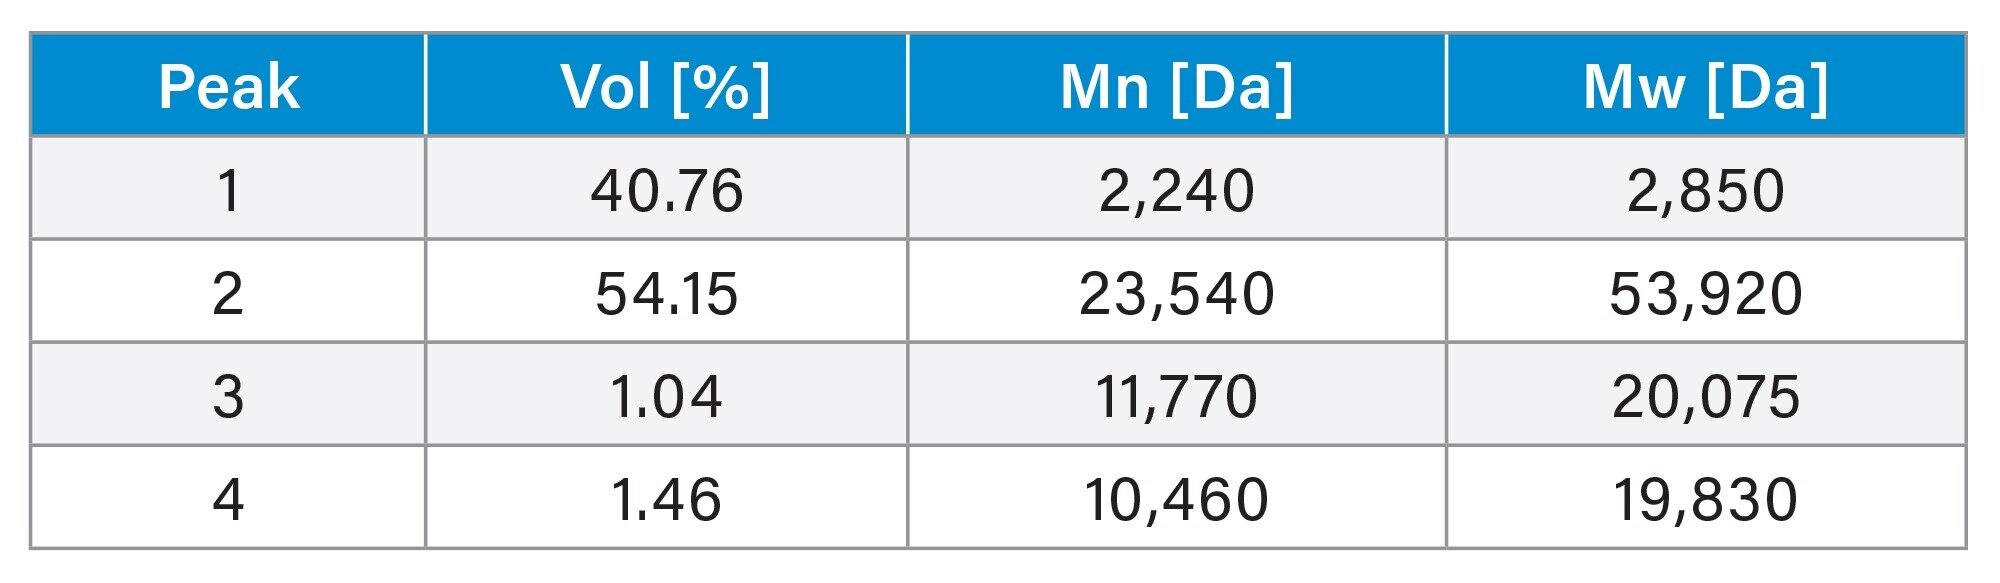 Table 2. Molecular weights and volume percentage of the fractions of sample b.
Conclusion
Co-eluting fractions of two graft polymers that were not or only partially resolved in one-dimensional chromatograms can be completely separated by adding a second chromatographic dimension.
MW information for individual components of the contour plots can be calculated after calibrating the second dimension with suitable narrow distribution standards. The MWs of the separated fractions of sample a ranged from approximately 3,000 Da to approximately 90,000 Da. The MW range for sample b ranged from approximately 3,000 to approximately 54,000 Da.
Switching from one-dimensional SEC to two-dimensional analysis improves compositional and structural characterization of emerging complex polymers.
Chromatographic separation following the 2D LC x SEC approach is significantly improved, ensuring complete confidence in the analytical results and eliminating the need of costly and time-consuming sample re-analysis.
Acknowledgements
1. Claudia Lohmann - Waters Corporation.
2. Wolfgang Radke - PSS Polymer Standards Service.
720007590, April 2022