LipidQuan™: A Robust LC-MS/MS Methodology for Rapidly Profiling the Lipidome of Liver Tissue Following Metabolism of the Drug Gefitinib
For research use only. Not for use in diagnostic procedures.
Abstract
Lipid and metabolite phenotyping provides unique insights into mammalian biology, disease progression, treatment efficacy and population health. LipidQuan™ is a rapid HILIC based liquid chromatography tandem mass spectrometry (LC-MS/MS) platform that can be implemented to develop targeted assays. Method development and training costs are reduced when using the Quanpedia™ Library which contains over 2000 lipids with improved identification and specificity (e.g., the use two fatty acyl chain fragments for phospholipid related MRMs increases specificity). In this study over 500 biologically relevant lipids were deployed to screen tissue samples. The methodology provides broad coverage of multiple lipid classes as well as facilitating the measurement of low abundance bioactive lipids such as PAs, PSs, and PCs. We have applied the LipidQuan methodology to the analysis of mouse liver tissue following the intravenous (IV) administration of Gefitinib an inhibitor of epidermal growth factor receptor's (EGFR) tyrosine kinase domain used to treat various cancers. The resulting data showed dysregulation of the lipid metabolism pathways with a time-related trajectory following the administration of the drug.
Benefits
- Robust, reliable lipid analysis
- Ability to measure 500 lipids from a library of over 2000 biologically relevant lipids
- Fast and simple methodology that can be readily deployed
- Rapid analysis of eight minutes
Introduction
Liquid Chromatography-Mass Spectrometry (LC-MS) based Proteomics, Lipidomics, and Metabolomics offer great potential to understand the biological changes in mammalian systems as a result of, disease, environmental changes and exposure to pharmacological or toxicological agents.1 Lipidomics, which involves the comprehensive analysis of lipids of all types, can be used to detect and identify thousands of lipids across the eight common lipid classes.1 These lipidomic approaches have revealed that various diseases and conditions have resulted in changes in the phenotypes of these classes of lipids, including triple-negative breast cancer, diabetic cardiovascular disease, and Non-Alcoholic SteatoHepatitis (NASH).2
Gefitnib is a drug belonging to a class of tyrosine kinase inhibitors (TKIs) which competes with ATP for its binding pocket in mutated or overexpressed EGFR receptors.3 By inhibiting tyrosine kinase activity, Gefitinib prevents cancer cell proliferation. Previous plasma-based studies have shown evidence of changes in the circulating lipid composition as a result of pharmacological effects of the drug.4
LipidQuan is a robust, simple, HILIC based LC-MS/MS methodology that employs stable label isotope lipids and an odd chain lipid mix for the rapid, accurate quantification of lipids, that was deployed to screen over 500 lipids. Here, we demonstrate the application of LipidQuan to the analysis of lipids in samples of mouse livers obtained following the IV administration of Gefitinib.
Experimental
Study Design
Mouse plasma samples were sourced from a previous pharmacokinetics study of Gefitinib in male C57Bl/6JRj mice (20–27 g) (full description of the study can be found in previous publications).4 The study was performed with full management review and according to national and EU guidelines by Evotec SAS (Toulouse, France). Briefly, Gefitinib was formulated in 0.5% Hydroxypropyl methylcellulose HMPC in 0.1% polysorbate 80 and administered intravenously (IV) at 10 mg/kg. Liver samples were obtained pre-dose and at 0.5, 1, 3, 8, and 24 hours post-dose.
Sample Preparation
Lipids were extracted from the liver samples using the procedure outlined by Want et. al 2012 [5]. Between 50–60 mg of tissue was sampled to 1.5 mL tubes pre-filled with silica beads. To this 1 mL of dichloromethane/methanol (3:1, v/v) solution containing a 250-fold dilution of neat deuterated ceramide LIPIDOMIX (Avanti, Birmingham, Al, USA), SPLASH LIPIDOMIX (Avanti, Birmingham, Al, USA) and Geitinib (d6) (Cayman Chemical, Ann Arbor, Michigan, USA) at 3000 ng/mL as internal standards. The tissue was homogenised using the tissue setting of Bertin Precellys Evolution (Bertin Instruments, Basingstoke, England) which are three sessions of twenty second pulses at 6000 rpm with fifteen second pauses. The tubes were centrifuged for ten minutes at 2000 g before transferring the organic layer to glass vials to dry under nitrogen. The extraction procedure was repeated on the remaining pellet to optimise the extraction.
After the extracts had dried down, samples were reconstituted in 1 mL of IPA/Acetonitrile (1:2, v/v) with ten minutes sonication. Six pre-dose sample extracts were used to generate the calibration curve, which were reconstituted in IPA/Acetonitrile solutions containing six concentration levels of Odd Chain LIPIDOMIX ranging from 5 ng/mL (LPE) to 84750 ng/mL (Cholesterol Ester). Gefitinib (Sigma Aldrich, Poole, UK) and O-desmethyl-Iressa (Cayman Chemical, Ann Arbor, Michigan, USA) standards were also included in the calibrant solutions at concentrations ranging from 12 ng/mL to 1333 ng/mL. Samples were transferred to Eppendorf tubes for a further five minute centrifugation step to remove debris. The supernatant was transferred to maximum recovery vials for LC-MS analysis.
LC Conditions
|
LC system: |
ACQUITY™ UPLC I-Class Flow Through Needle (FTN)) Ultraperformance LC™ |
|
Detection: |
Xevo™ TQ-XS Tandem Quadrupole Mass Spectrometer |
|
Vials: |
Certified Glass Screw Neck Max Recovery Vial | 186000326C |
|
Column(s): |
ACQUITY Premier UPLC™ BEH™ Amide 2.1 x 100 mm, 1.7 µm |
|
Column temperature: |
45 °C |
|
Sample temperature: |
10 °C |
|
Injection volume: |
0.5 µL |
|
Flow rate: |
0.6 mL/min |
|
Mobile phase A: |
95% ACN, 5% 10 mM ammonium acetate (v/v) |
|
Mobile phase B: |
50% ACN, 50% water, 10 mM ammonium acetate (v/v) |
|
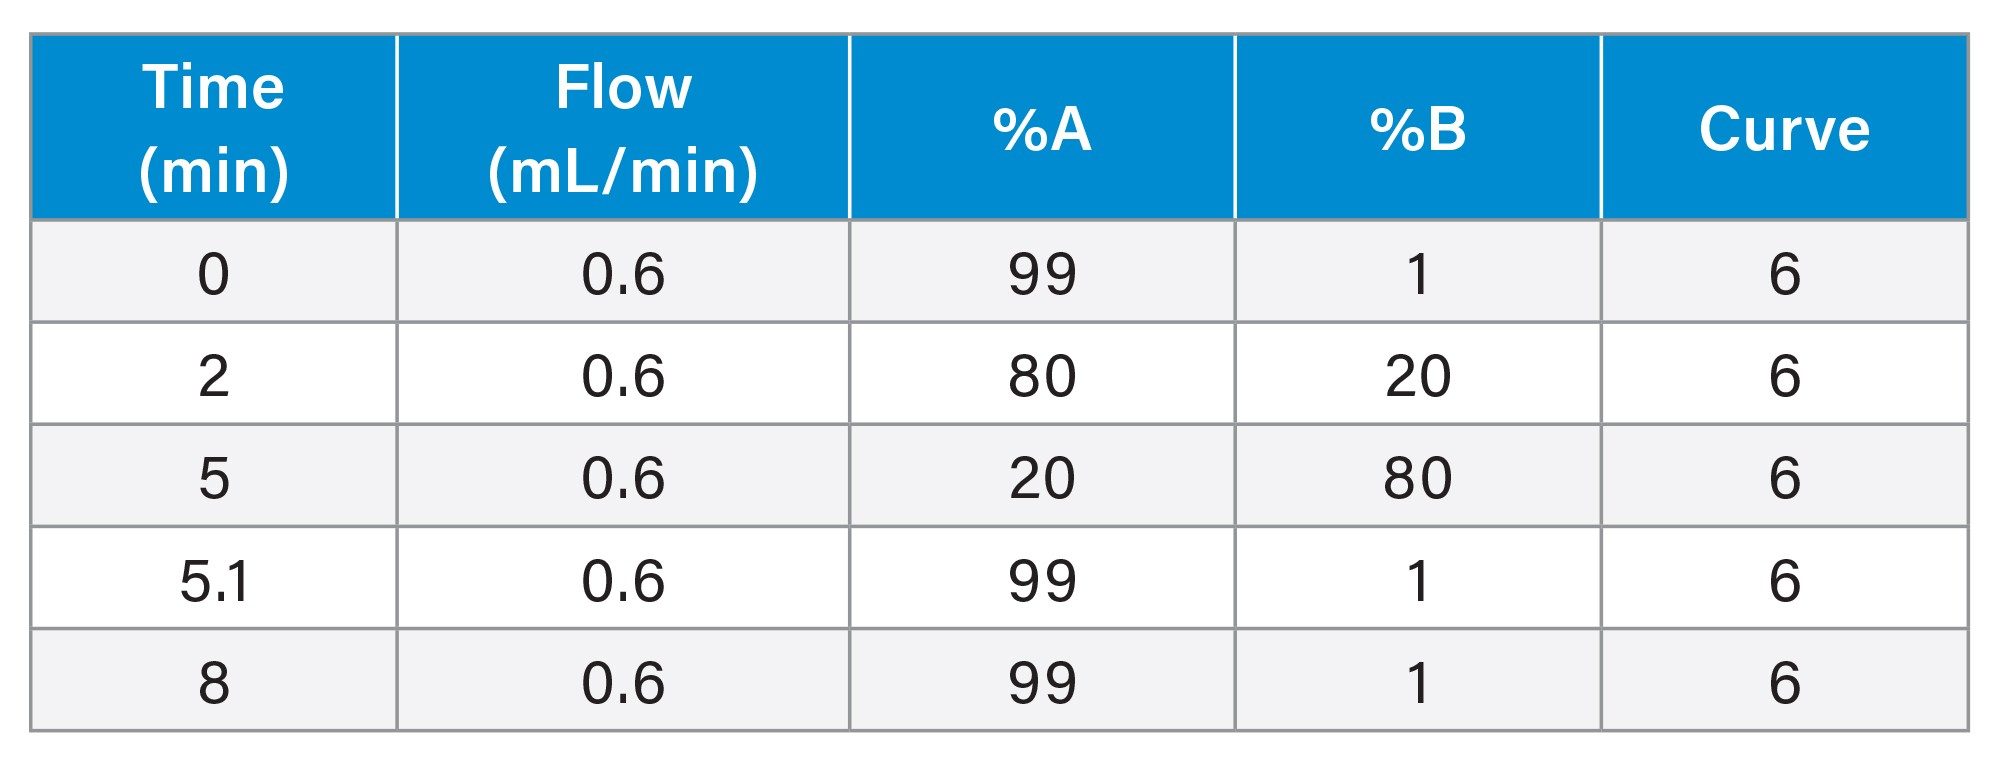
Gradient: |
1% to 20.0% B for 2 minutes, then 20% to 80% B for 3 minutes followed by 3 minutes re-equilibration |
Gradient Table
MS Conditions
|
MS systems: |
Xevo TQ-XS |
|
Ionization mode: |
Positive and negative ion mode |
|
Capillary voltage: |
2.8 kV (+) 1.9 kV (-) |
|
Acquisition mode: |
MRM |
|
Source temperature: |
120 °C |
|
Desolvation temp.: |
500 °C |
|
Cone gas flow: |
150 L/hr |
|
Desolvation flow: |
1000 L/hr |
|
Nebuliser gas: |
7 bar |
|
Ion guide offset 1: |
3 V |
|
Ion guide offset 2: |
0.3 V |
Data Management
Data were processed using TargetLynx™ XS vs.4.2 (Waters, Wilmslow, UK) and Skyline (MacCoss Lab Software, University of Washington). Data processing using TargetLynx software, the SIL standards of deuterated ceramide LIPIDOMIX and SPLASH LIPIDOMIX are set to act as internal standards based on the corresponding natural abundance class of the lipid. The multivariate statistical analysis was performed using MetaboAnalyst6 and Spotfire (TIBCO, Somerville, MA, USA).
Results and Discussion
Gefitinib, N-(3-chloro-4- fluorophenyl)-7-methoxy-6-(3-morpholino-propoxy)quinazo-lin-4-amine (Figure 1) is a drug approved in 2003 for the treatment of certain breast and non-small cell lung (NSCL) cancers as well as some other specific cancers under the brand name of Iressa®. Gefitinib acts by interrupting epidermal growth signaling in target cancer cells in the tyrosine kinase domain and is classified as an epidermal growth factor receptor (EGFR) inhibitor. Gefitinib is well absorbed in mammalian systems with good bioavailability, with peak plasma concentrations observed three to seven hours following dosing with a mean oral bioavailability of 60%. Gefitinib undergoes extensive biotransformation in preclinical species and humans (e.g., resulting in a large number of drug metabolites). As Gefitinib acts on the tyrosine kinase pathways and has been shown to cause liver damage, the investigation of the lipidomic effect of Gefitinib in the liver was performed.4
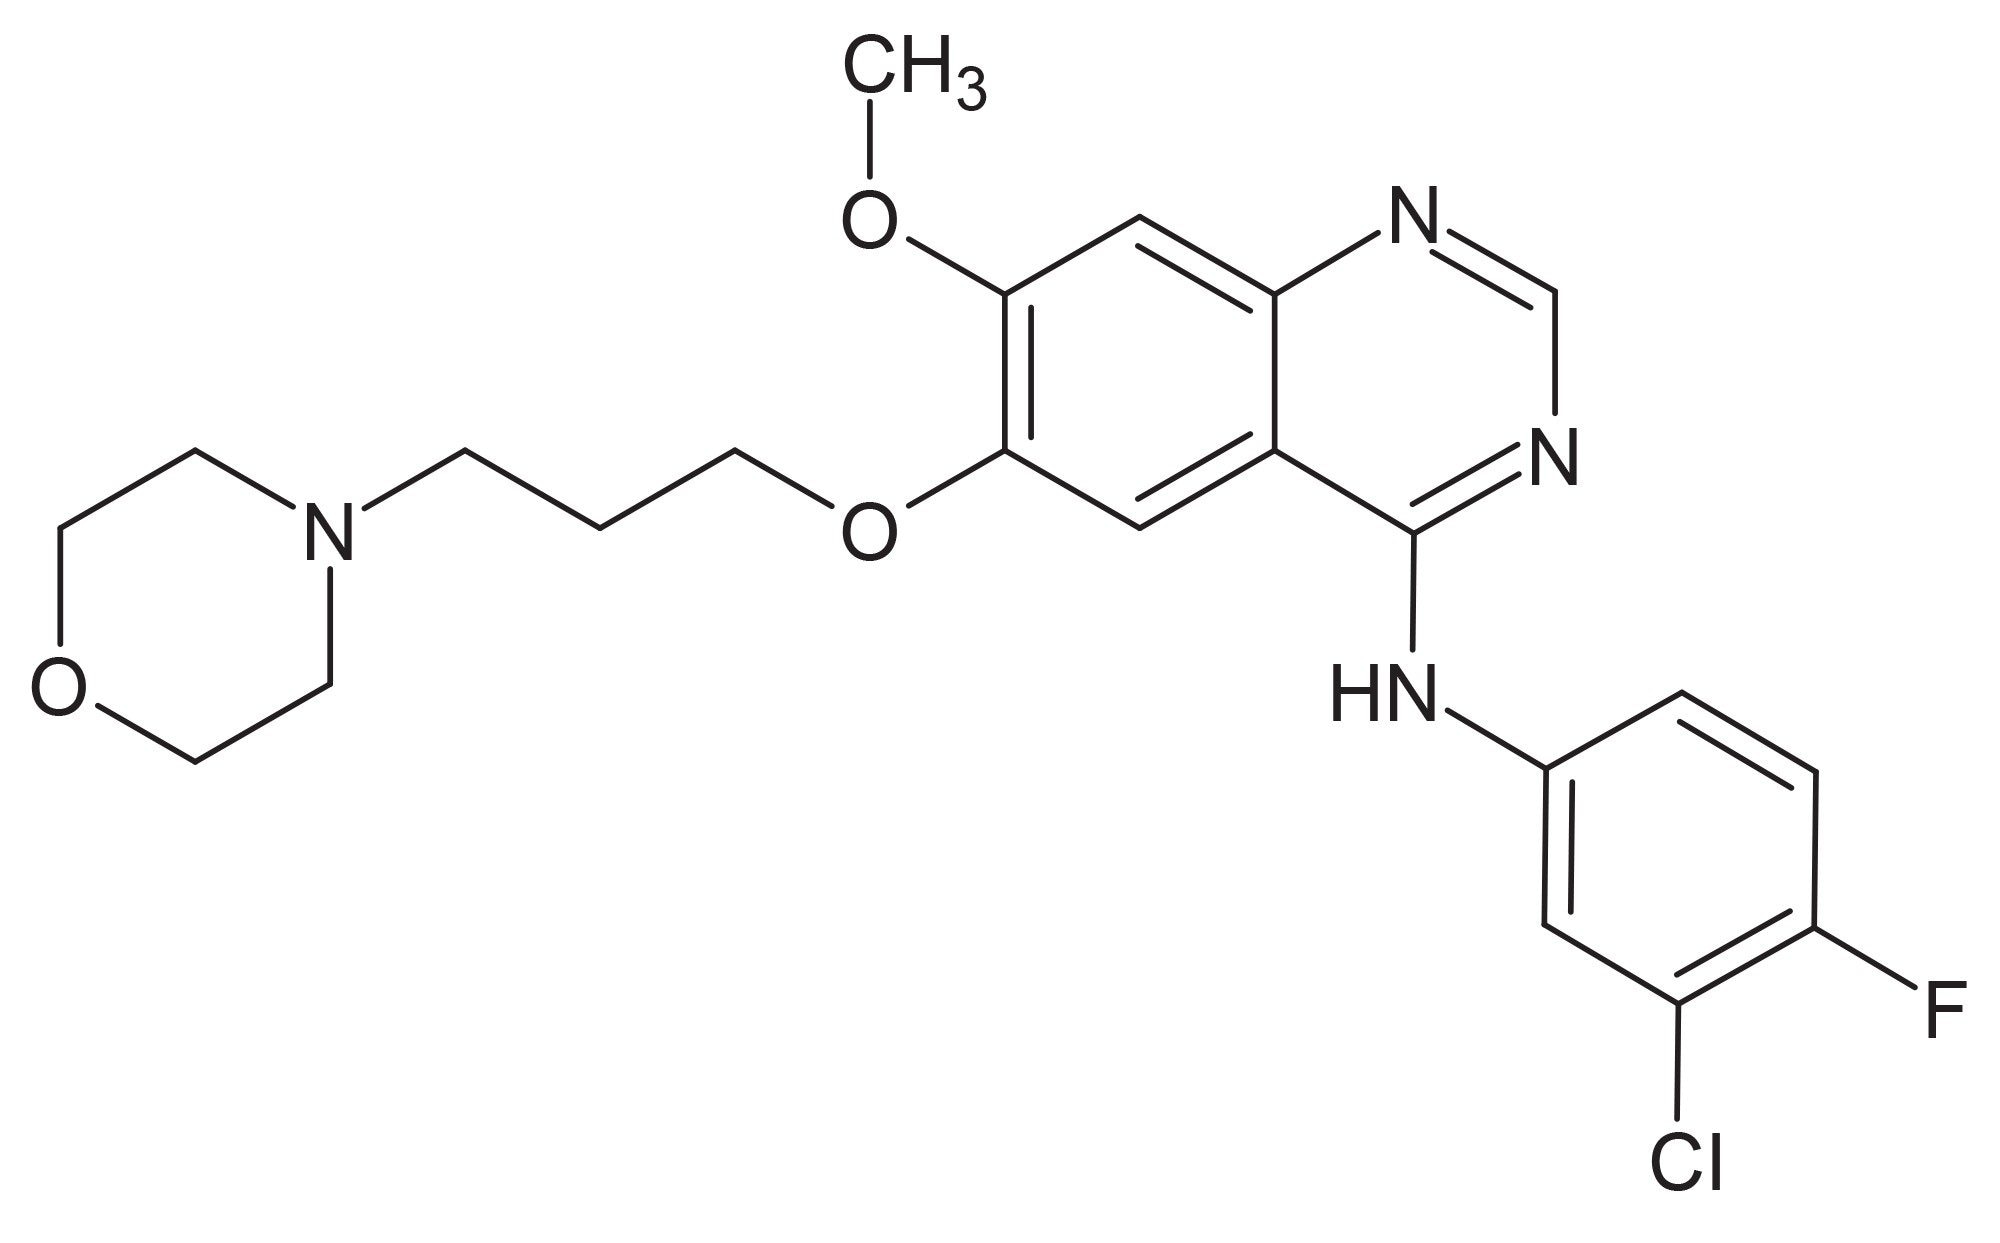 Figure 1. Structure of Gefitinib.
Prior to the commencement of sample analysis multiple injections of control blank sample were performed to ensure the stability of the analytical methodology. A lipid calibration curve was analysed at the beginning and end of the analytical process. A control quality control (QC) was generated by pooling all the pre-dose samples. A study reference QC was constructed by pooling a small volume from each sample, a treated sample QC was also constructed by pooling a small volume of sample from each time point of the animals which were dosed with Gefitinib. These study reference QCs, control QCs and treated QCs were analysed after every eighth sample injection. The samples were randomized and analysed in triplicate using the LipidQuan HILIC-MS/MS methodology.
Representative positive and negative ion ESI HILIC-MS/MS chromatograms for the liver extracts are shown in Figures 2 and 3. This data illustrates the separation and detection of the various lipids in the two ionization modes. As can be seen from this data the lipids elute in classes based on the polar head group, “non-polar” triglycerides and cholesterol esters eluting first and LPC and LPE eluting at the end of the chromatogram. Along with the lipids classes it was possible to monitor and measure various acylcarnitines with the long-chain C18 and C14 carnitines eluting at 1.8 minutes and the short-chain C4 to C0 carnitines eluting between 2.9 and 3.8 minutes. Using this approach, a total of 238 lipids were quantified in positive ion mode and 232 lipids were monitored in negative ion mode excluding internal standards and calibrants. The lipid standard concentrations ranged from 5 ng/mL (LPE) to 84750 ng/mL (Cholesterol Ester). Analysis of the calibration samples showed that the methodology produced a linear response over three orders of magnitude. The retention characteristics of Gefitinib and its metabolites were determined using Gefitinib and the O-desmethyl metabolite calibrant standards via the methodology described above. The resulting data showed that both Gefitinib and the O-desmethyl metabolite eluted at 0.7 minutes.
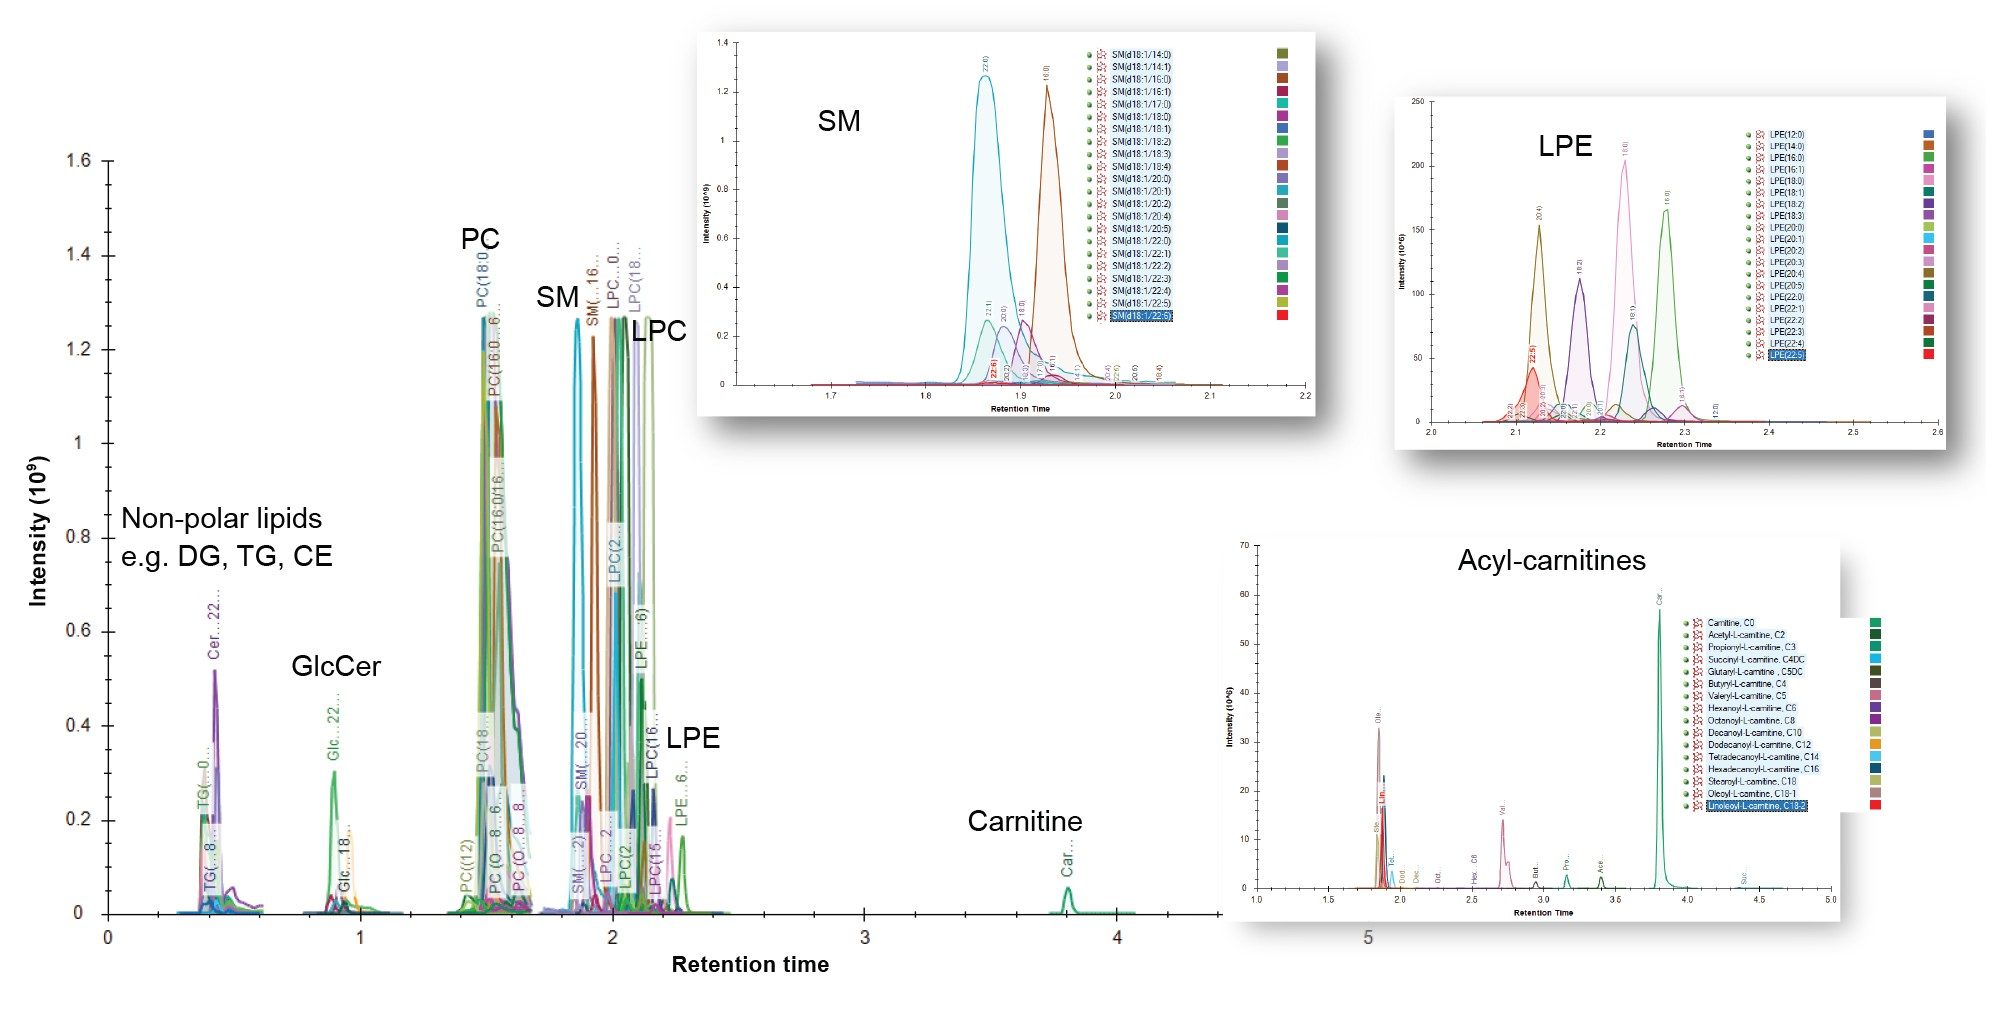 Figure 2. Positive ion ESI HILIC-MS/MS chromatogram of a liver extract following administration of Gefitinib.
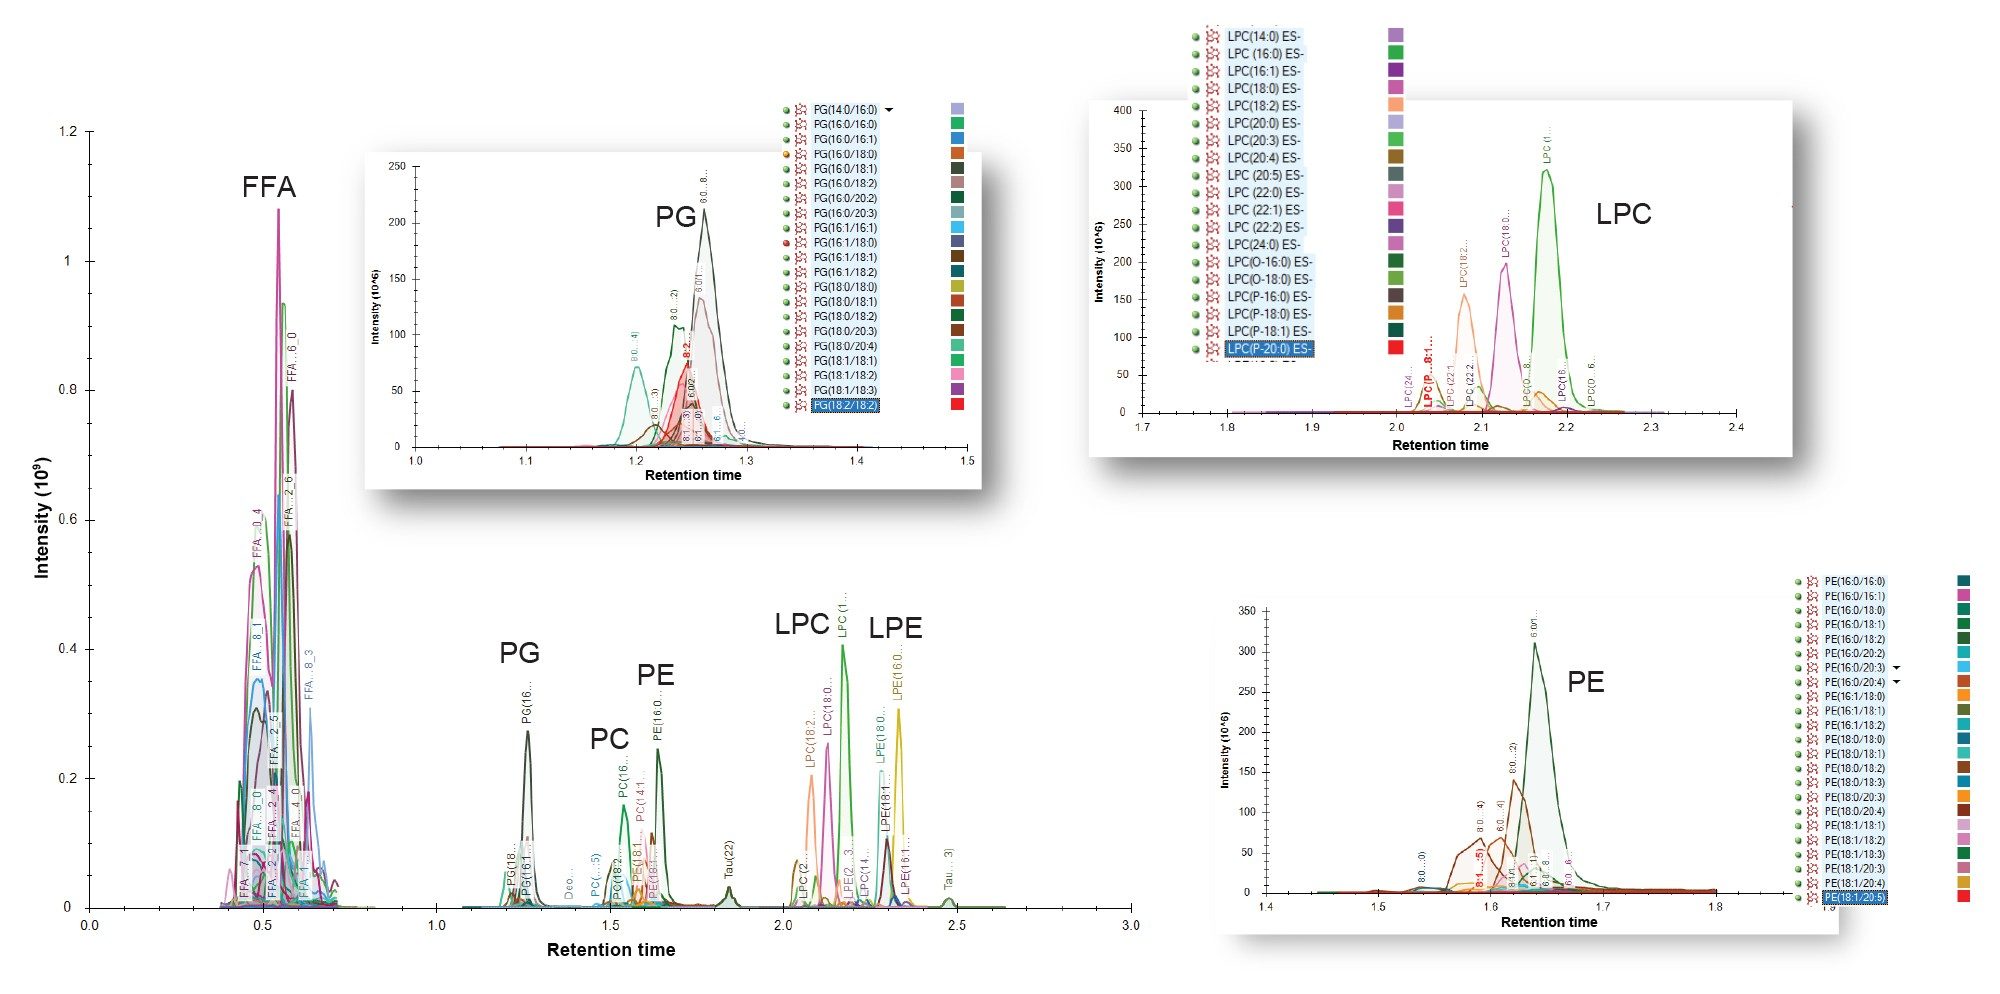 Figure 3. Negative ion ESI HILIC-MS/MS chromatogram of a liver extract following administration of Gefitinib.
The peak areas derived from Skyline were transferred to MetaboAnalyst for multivariate analysis using both non supervised PCA and supervised PLSDA analysis. The LC-MS/MS signals resulting from Gefitinib, and its metabolites were not included in the multivariate statistical analysis. However, the data obtained from the positive ion ESI LC-MS/MS MRM data for Gefitinib showed a peak concentration was obtained at the 0.5 hour time point which steadily declined over the duration of the study and was not measurable at the 24 hours time point, which is in agreement with previous published results.3,4 The data displayed in Figure 4 illustrates the multivatiate statistical analysis of the negative ion analysis of the data using both the PCA and PLSDA methodologies. In both the positive and negative ion ESI data sets, the treated samples group was clearly separated from the control group, with the study reference QCs and treated sample QCs clustered tightly together in their individual groups. It is evident from both the PCA and PLSDA data processing that there is significantly more variation in the treated sample group compared to the control group suggesting that the dosing of Gefitinib has resulted in dysregulation of the lipid metabolism. A similar trend was observed for the positive ion ESI LC-MS/MS data.
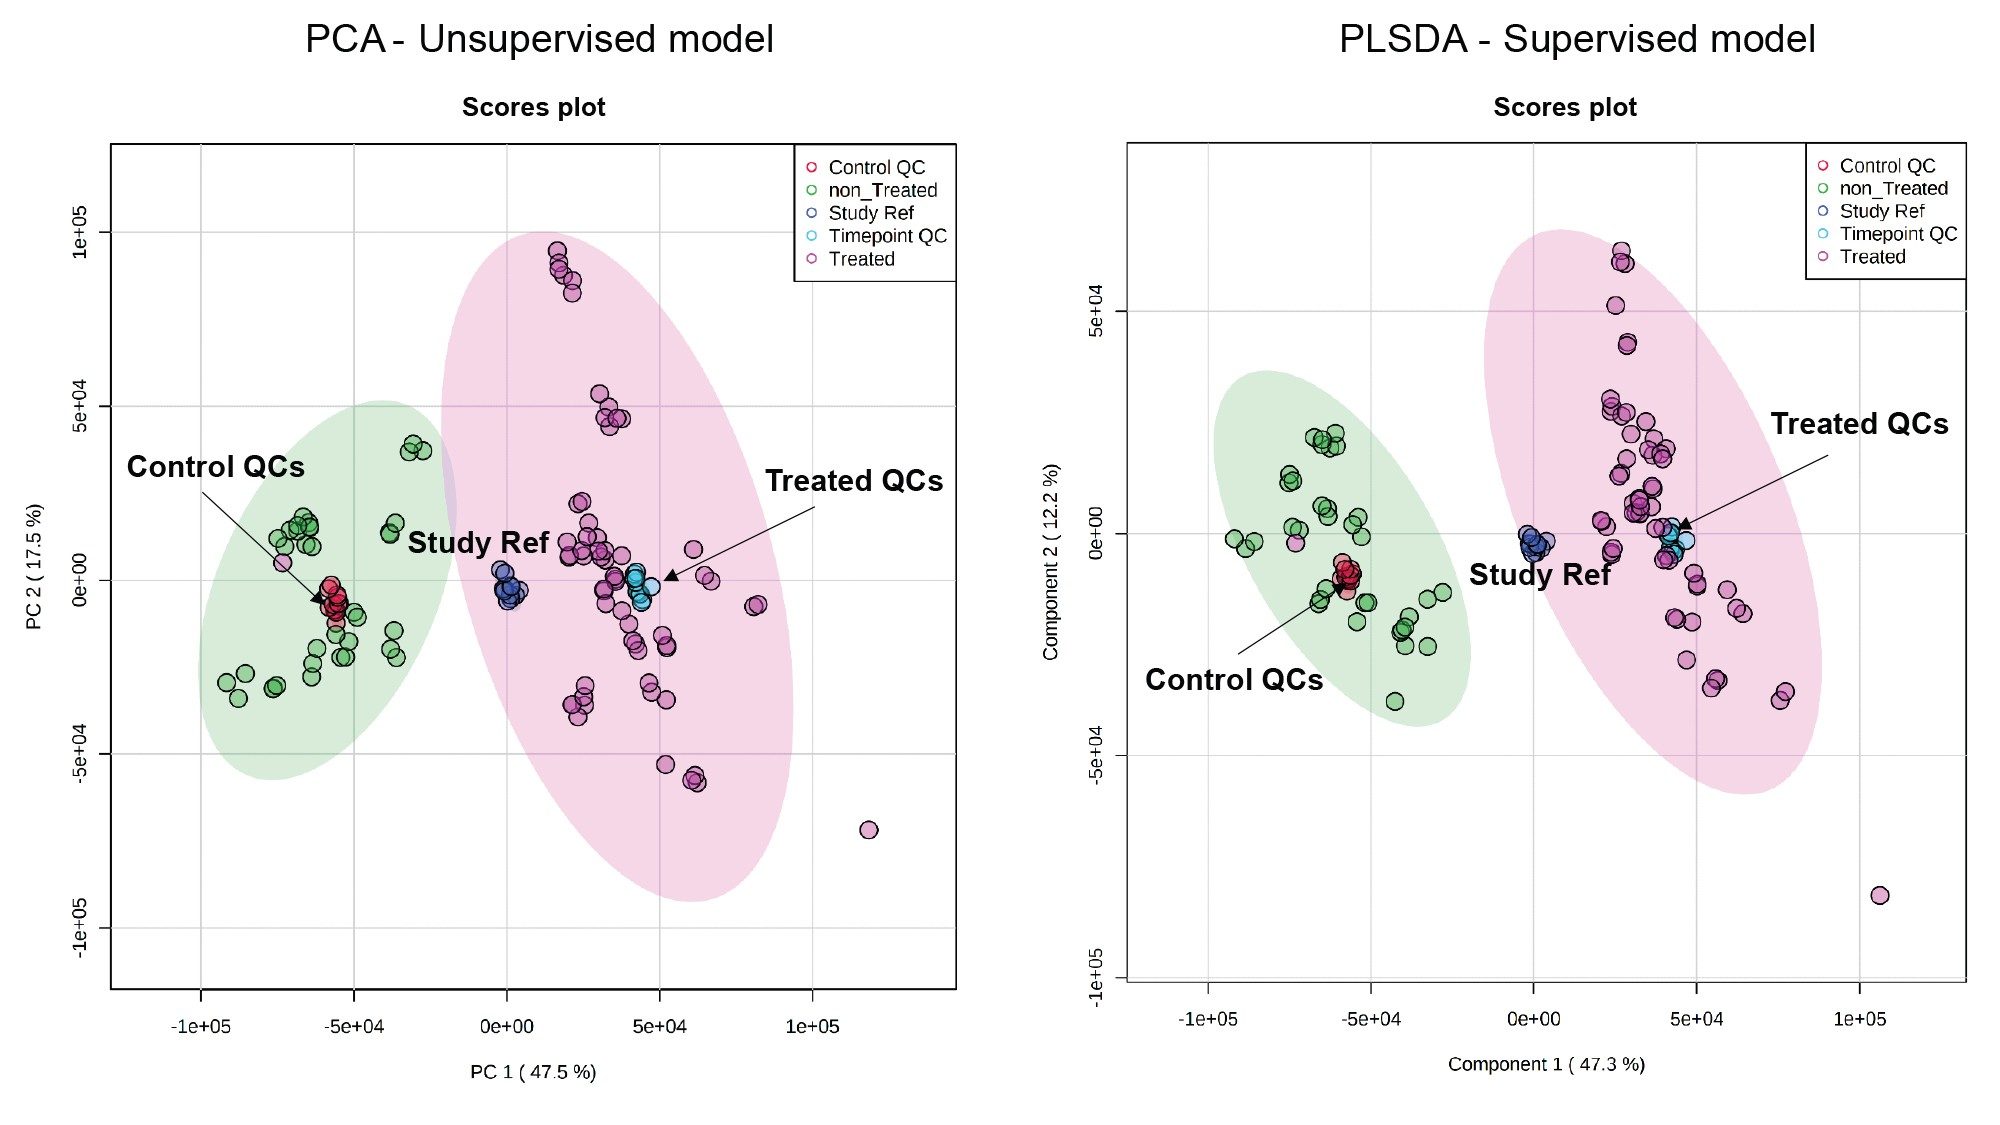 Figure 4. PCA and PLSDA models based on the negative ion LC-MS/MS liver extract data.
The data derived from the Gefitinib IV dose group only was subjected to PLSDA, Figure 5. In this data analysis a clear time related trajectory can be observed in the metabolic signals from the 0.5, 1, 3, 8, and 24 hours time groups. It is clear from the data that the samples do not return to the pre-dose position at the 24 hours time point, suggesting that lipid dysregulation was still occurring at 24 hours. Statistical analysis showed that of the top 25 features contributing to the observed metabolic changes in the PLSDA model, the majority corresponded with free fatty acids (FFA), PEs, PGs, LPC, and LPCs. A similar result was also observed for the positive ion ESI data, with contributions observed from the SM, TG, and PC lipids contributing strongly to the observed variance in the data.
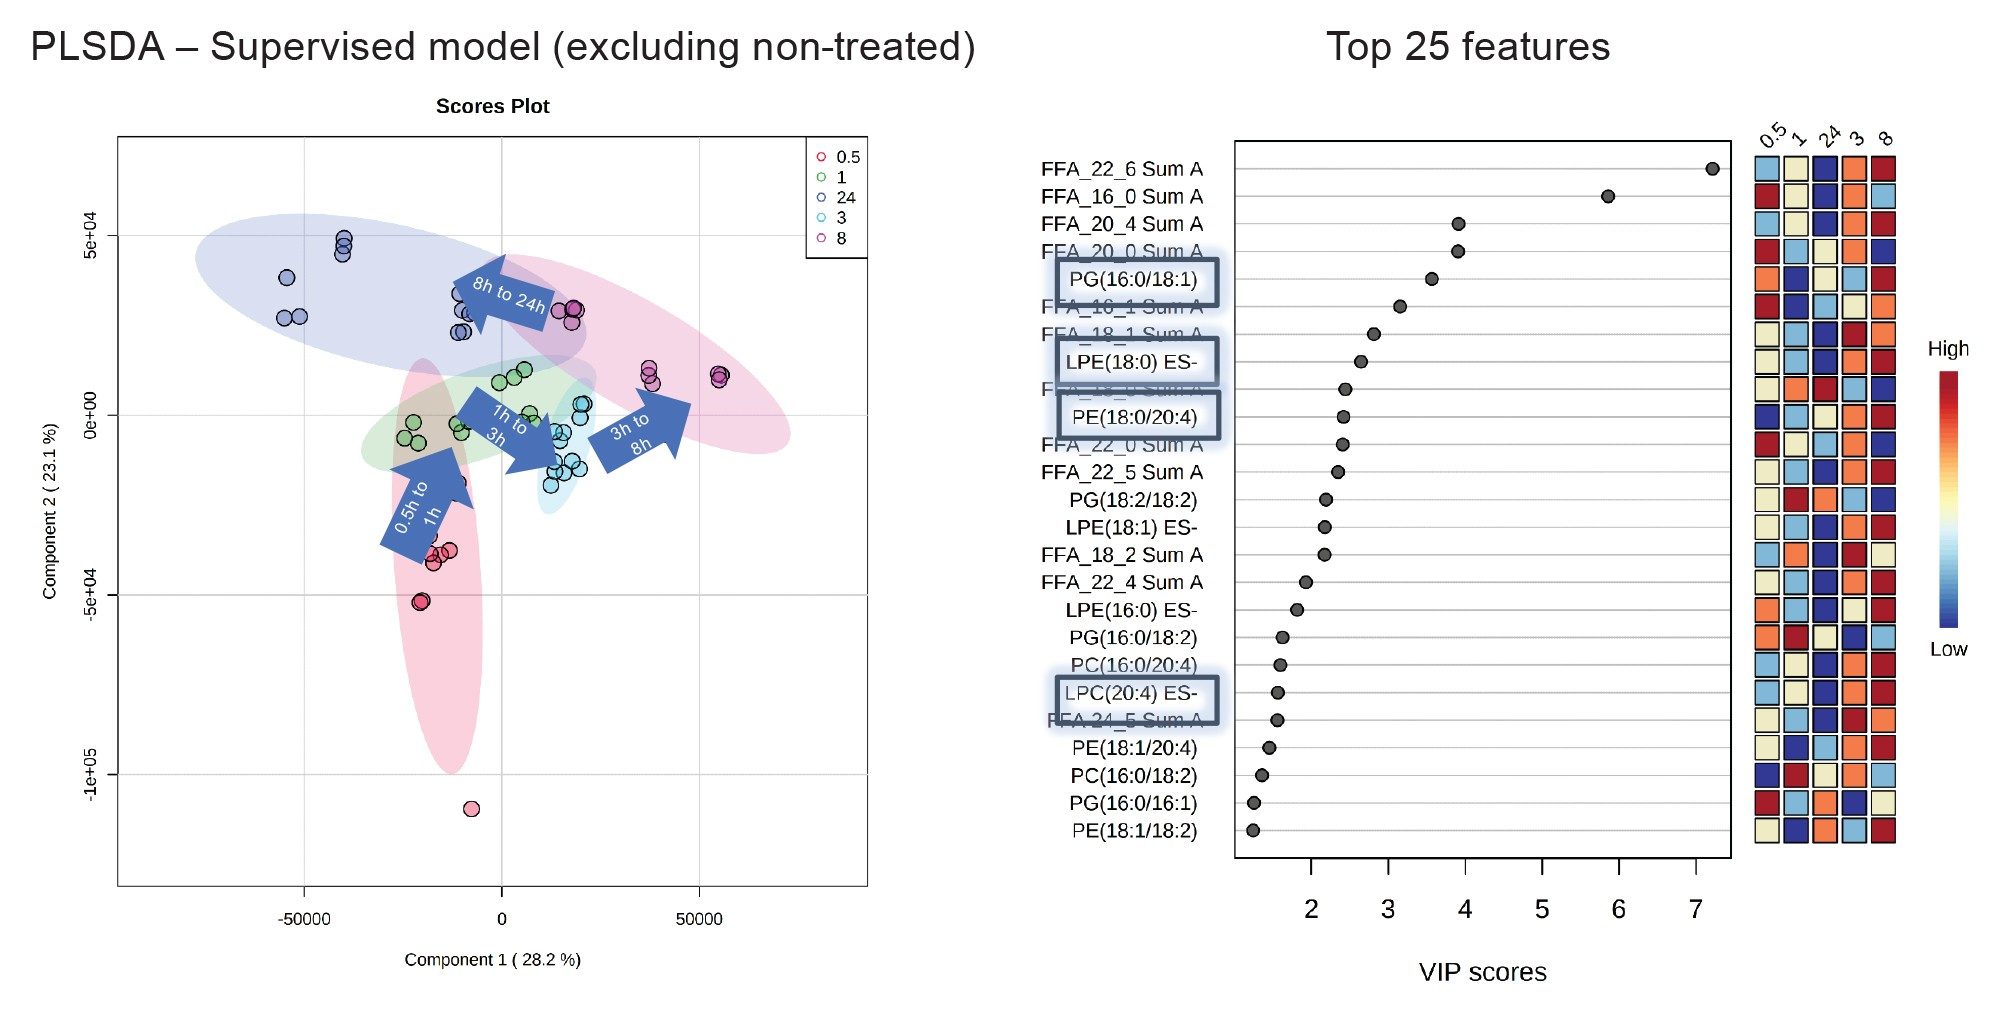 Figure 5. PLSDA of negative ion LC-MS/MS data.
The peak area response time profile for four of these dysregulated lipids, LPE (18:0), PG (16:0/18:1), PE 18:0/20:4), and LPC (20:4) obtained from the negative ion ESI LC-MS/MS analysis are shown in Figure 6. Although the time course profile for each of these lipids is different, they all show a steady increase in concentration with time reaching a maximum at the eight hour time point with a reduction in concentration at the 24 hour time point.
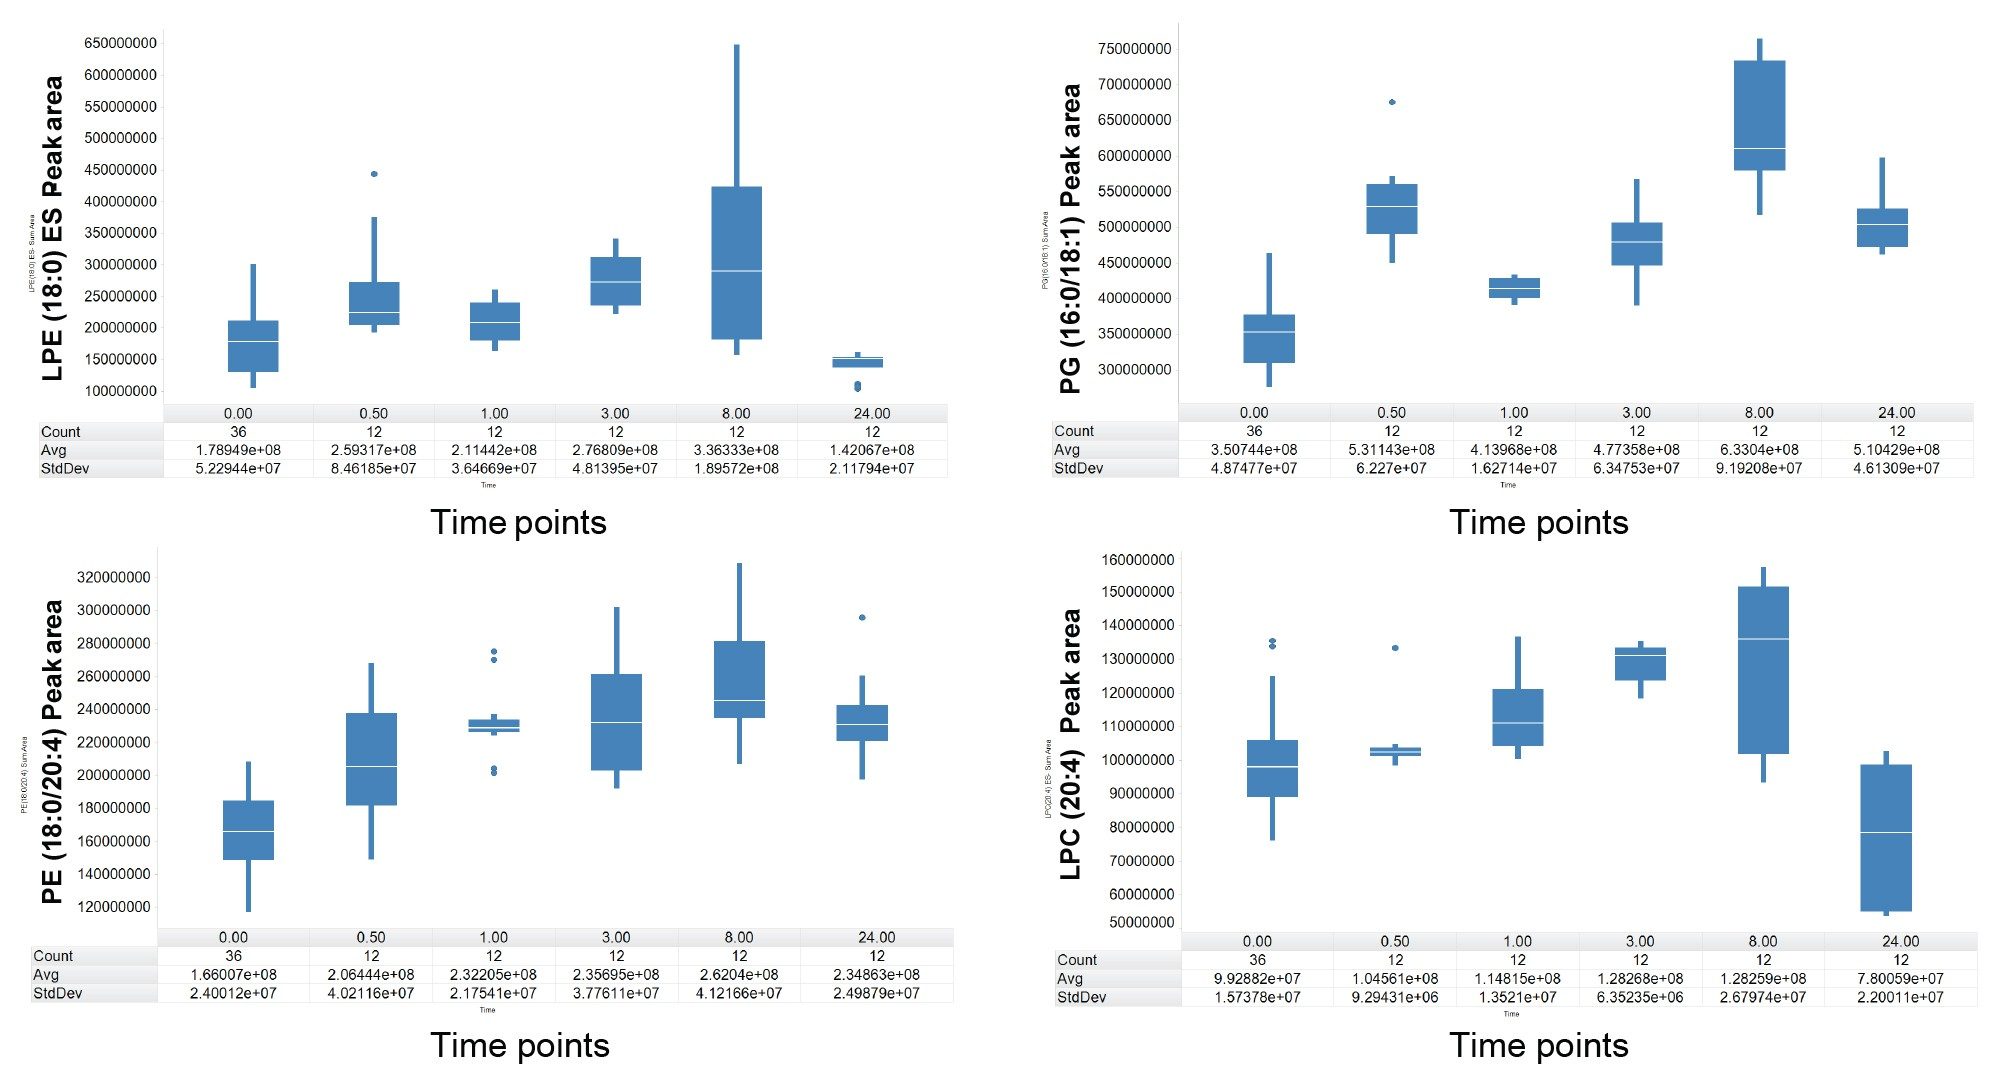 Figure 6. Box-whisker plots highlighting the peak area responses for selected lipids which were dysregulated over the 24 hour period.
Conclusion
Metabolomics and Lipidomics profiling provide a mechanism to observe and understand changes in the metabolome and lipidome following exposure to a pharmacological or toxicological agent, or to monitor disease progression. LipidQuan methodology provides a rapid simple approach to the quantitative measurement of lipids in biological fluids allowing over 500 lipids to be monitored in a combined positive and negative ion experiment. In this study LipidQuan has been applied to the quantification of lipids from mouse liver extracts following the IV administration of the EGFR inhibitor Gefitinib. Analysis of the QC data also showed that no time-related drift or variation in the analytical data was observed, further highlighting the robustness of the methodology. The data revealed a time-related trajectory for the lipid signals in the dose group with the FFAs, PEs, PGs, LPEs, and LPCs showing a strong contribution to the observed variation in the negative ion ESI data, whilst SMs, TGs, and PCs showed a significant contribution in the positive ion data.
References
- Han X. Lipidomics for Studying Metabolism. Nat. Rev. Endocrinol. 2016, 12, 668–679.
- Eghlimi R, Shi X, Hrovat,J, Xi B, Gu H. Triple Negative Breast Cancer Detection Using LC-MS/MS Lipidomic Profiling. J. Proteome Res. 2020, 19, 2367–2378.
- McKillop D, Hutchison M, Partridge E.A, Bushby N, Cooper C.M, Clarkson-Jones J.A, Herron W, Swaisland H.C. Metabolic Disposition of Gefitinib, an Epidermal Growth Factor Receptor Tyrosine Kinase Inhibitor, in Rat, Dog and Man. Xenobiotica 2005, 34, 914–934.
- Molloy B.J, King A, Mullin L.G, Gethings L.A, Riley R, Plumb R.S, Wilson I.D. Rapid Determination of the Pharmacokinetics and Metabolic Fate of Gefitinib in the Mouse Using a Combination of UPLC-MS/MS, UPLC/QTof/MS, and Ion Mobility (IM)-enabled UPLC/QTof/MS. Xenobiotica 2021, 51, 434–446.
- Want, E., Masson, P., Michopoulos, F. et al. Global Metabolic Profiling of Animal and Human Tissues via UPLC-MS. Nat Protoc, 2013, 8, 17–32. https://doi.org/10.1038/nprot.2012.135.
- Chong, J., Soufan, O., Li, C., Caraus, I., Li, S., Bourque, G., Wishart, D.S., Xia, J. MetaboAnalyst 4.0: Towards More Transparent and Integrative Metabolomics Analysis. Nucl. Acids Res., 2018, 46, W486–494.
720007598, April 2022