Method Development and Validation for the Determination of Pyrrolizidine Alkaloids in a Range of Plant-Based Foods and Honey Using LC-MS/MS
Abstract
Pyrrolizidine alkaloids (PAs) are toxins exclusively biosynthesised by plants. Expressing both genotoxic and carcinogenic properties, an increasing number of reports reveal relatively high contaminations with PAs in food, herbal infusions, and teas. This Application Note describes an analytical method for the determination of PAs in plant-derived product (e.g. botanicals such as tea, herbs, spices and cumin seeds) and honey. Samples were extracted with a sulfuric acid solution, cleaned up using Oasis MCX SPE cartridges, concentrated and resuspended prior to LC-MS/MS analysis. The chromatographic resolution of critical pairs of isomers was addressed in this study. Good method recoveries and excellent repeatability were obtained, which complied with the acceptance criteria in the CEN standard for single laboratory validation. Limits of quantification for individual compounds were 0.6 µg/Kg, which were shown to exceed regulatory compliance, such that the method can also be applied to food intended for infants and young children.
Benefits
- Validated quantitative method for the analysis of 35 EU-regulated Pyrrolizidine Alkaloids in plant-based foods and honey suitable for checking regulatory compliance
- Removal of major co-extractives using Oasis MCX SPE clean-up to decrease the amount of isobaric interference
- Simplify and accelerate the development of robust methods using RADAR, the unique feature of Xevo™ tandem quadrupoles
- Good method recoveries and excellent repeatability, which complied with the acceptance criteria in the CEN standard for single laboratory validation
- Very low limits of quantification demonstrate the potential to employ the method for the analysis of Pyrrolizidine Alkaloids in products for infants and young children where maximum levels can be as low as 75 µg/kg for the sum of PAs
Introduction
PAs are toxins exclusively biosynthesised by plants. They are typical plant secondary metabolites against herbivores. It has been estimated that approximately 6000 plant species are capable of producing PAs (2% of all flowering plants).1 By now the presence of PAs has been confirmed for over 600 different species, which are for the most part from the families Asteraceae (Compositae), Boraginaceae, and Fabaceae (Leguminosae). In recent years, an increasing number of reports revealed relatively high contaminations with PAs in food and herbal infusions and teas not prepared from so-called ‘PA–containing plants’, which is mainly due to cross contamination during harvesting.2
PAs are regarded as undesirable substances in food and feed, due to their genotoxic and carcinogenic properties, and for that reason were the subject of an EFSA opinion in 2011.3 Based on the outcomes of various risk assessments, the fact that teas/herbal infusions and other food items could contain substantial amounts of PAs has to be considered as a relevant food safety issue. In 2017, EFSA published the statement on the risks for human health related to the presence of PAs in honey, tea, herbal infusions, and food supplements.4 The CONTAM Panel established a new reference point of 237 µg/kg body weight per day to assess the carcinogenic risks of PAs and concluded that there is a possible concern for human health related to the exposure to PAs, in particular for frequent and high consumers of tea and herbal infusions. Based on these studies, the European Commission has set maximum levels of PAs in certain foodstuff, such as herbs, spices, teas, herbal infusions, and pollen products. Maximum levels refer to the “lower bound” sum of 35 PAs and are set in EC Reg. (EU) 2020/20405 enforced from 1st July 2022 and amending Regulation (EC) 1881/2006. For example, the maximum level for PAs in most tea is 150 µg/kg, whereas the value for cumin is set at 400 µg/kg.
Due to the risk posed to human health, food testing laboratories need to develop and validate suitable confirmatory methods for the quantitative determination of PAs. Currently, only methods with mass spectrometric detection provide the prerequisites to analyse PAs at trace levels in food and feed. The German Federal Institute for Risk Assessment (BfR) and the EU Reference Laboratory for mycotoxins and plant toxins in food and feed (EURL-MP) published validated methods for the determination of certain groups of PAs in plant-based food and feed materials and honey.6-8 However, the BfR methods do not include all PAs listed by the Regulations and present various coelutions of isomeric compounds, while the EURL-MP method utilizes a neutralization step prior to a reverse-phase SPE clean-up and a dual-condition chromatography (acidic and basic) to achieve a better separation of certain isomeric compounds. Certainly, the main challenge of this analysis is the presence of a large number of isomers that present the same MRM transitions and are extremely challenging to resolve in the chromatographic dimension.
In this work, we describe a simplified approach for the quantification of 35 EU regulated PAs in plant-based food and honey using UPLC-MS/MS and we address the separation of a number of the isomers in a single chromatographic run. The proposed method has been validated in-house and the performance parameters, including trueness and precision, have been assessed. In addition, the enhanced selectivity of the clean-up protocol using Oasis MCX SPE was demonstrated by employing RADAR, an acquisition mode that acquires both MRM and full scan MS simultaneously, which makes it a useful feature of the Xevo tandem quadrupoles for monitoring matrix interferences during a routine quantitative analysis and to optimize method development.9
Experimental
Solutions and Standards
Pyrrolizidine alkaloids analytical standards were purchased from PhytoPlan (Heidelberg, Germany). Individual stock solutions (2500 µg/mL) were prepared by solubilizing 10 mg of each compound into 4 mL of methanol. A stock mixture (15 µg/mL) of all 35 PAs was prepared in H2O:methanol 95:5 (v/v). Matrix-matched calibrants were prepared by serial dilution of the stock mixture using a sample blank extract for each sample type. Stock solutions were stored at -20 °C.
Sample Description and Pre-treatment
Test samples consisted of green tea, herbal infusions of chamomile and rooibos, oregano, cumin seeds, and honey, which were purchased at a local market. For each sample type a pool sample was created and used for recovery experiments and matrix-matched calibration. Prior to extraction, plant-based commodities were ground and homogenized using an impact mill (IKA, Oxford, England), while honey samples were stirred before weighting into a centrifuge tube.
Sample Extraction and Clean-up
Plant-based food
The sample preparation method for tea, herbs, spices, and herbal infusions was based on work from Kwon Y. et. al. (2021)10 and from Jeong S. H. et. al. (2021).11 A portion of homogenized sample (1 ±0.01 g) was weighed in a 50 mL plastic centrifuge tube. The sample was extracted with 20 mL of 50 mM sulfuric acid in H2O:MeOH 1:1 (v/v) for ten minutes on automated Vortex. The tube was centrifuged for ten minutes at 5000 g, and 2 mL of supernatant were loaded onto the Oasis MCX Cartridge (6 cc, 150 mg, p/n: 186000256), which was previously conditioned with 3 mL MeOH and equilibrated with 3 mL H2O. The cartridge was washed with 4 mL H2O and 4 mL MeOH. PAs were eluted with 4 mL 2.5% NH4OH in MeOH into a silanized glass tube (maximum flow rate was one drop(s) at all stages). The purified extract was then evaporated to dryness under a gentle nitrogen stream at 50 ºC, and reconstituted with 500 µL H2O:MeOH 95:5 (v/v). The extract was filtered through a 13 mm d, 1.2 µm glass fiber syringe filter into a TruView™ LCMS Certified Maximum Recovery Vial for analysis (p/n: 186005662CV). The overall sample dilution factor was five.
Honey
The sample preparation method for honey was based on a work from Kowalczyk E. et. al. (2018).12 Homogenized honey sample (2 ±0.01 g) was weighed in a 50 mL plastic centrifuge tube. The sample was extracted with 20 mL of 50 mM sulfuric acid by shaking the tube until complete dissolution and subsequently ten minutes on automated Vortex. The tube was centrifuged for ten minutes at 5000 g, and 2 mL of supernatant were loaded onto the Oasis MCX cartridge (6 cc, 150 mg, p/n: 186000256), which was previously conditioned with 3 mL of MeOH and equilibrated with 3 mL of H2O. The cartridge was washed with 6 mL of H2O and 6 mL of MeOH. PAs were eluted with 6 mL of solvent mixture consisting of ethyl acetate:methanol:acetonitrile (80:10:10, v/v/v) with 1% NH4OH and 1% triethylamine into a silanized glass tube (maximum flow rate was 1 drop/s at all stages). The purified extract was then evaporated to dryness under a gentle nitrogen stream at 50 °C, and reconstituted with 1 mL of H2O:MeOH 95:5 (v/v). The extract was transferred into a TruView LCMS Certified vial for analysis (p/n: 186005666CV). Overall sample dilution factor was 5.

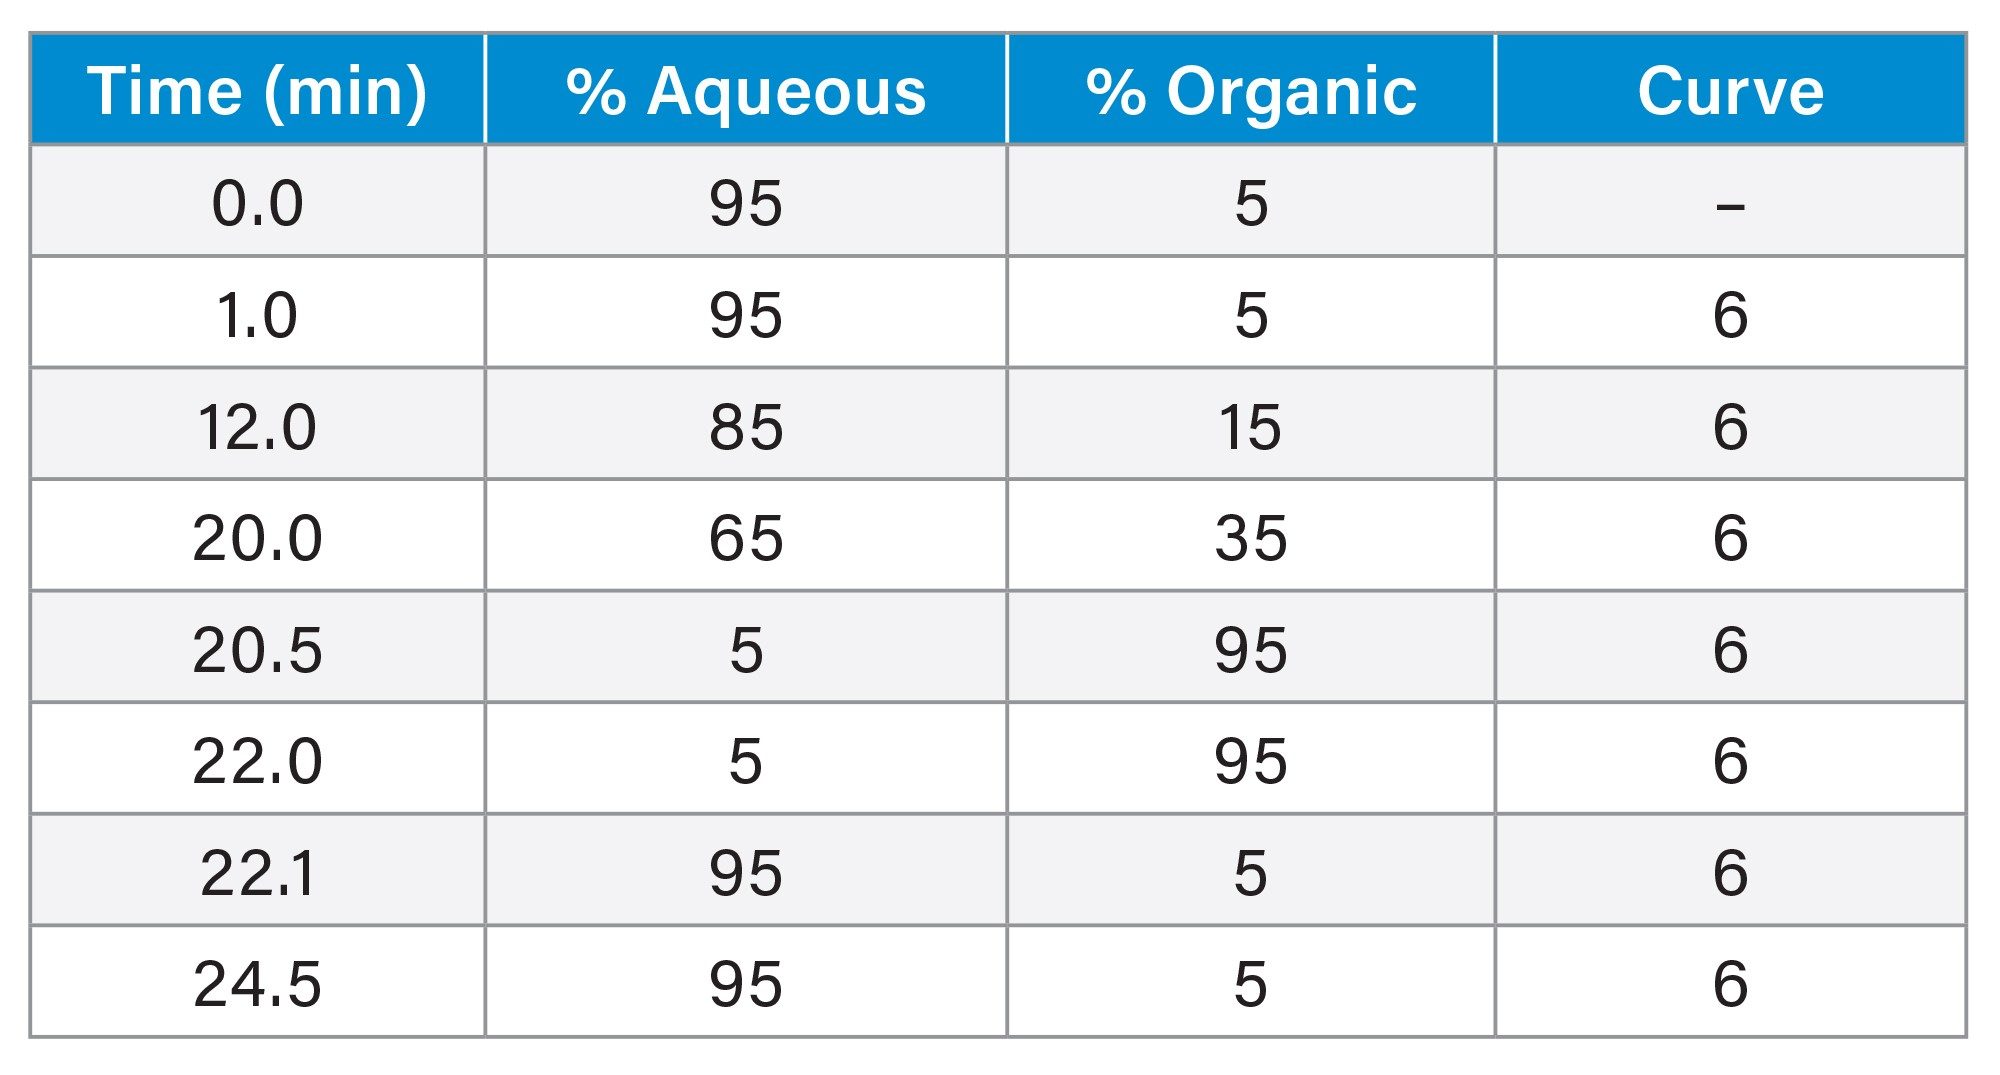
LC Conditions
|
Chromatographic system: |
ACQUITY™ UPLC I-Class PLUS System with column manager |
|
Autosampler and injector: |
Flow Through Needle injector (FTN) with 15-µL needle |
|
Column: |
ACQUITY UPLC BEH™ C8 (2.1 × 100 mm, 1.7 µm particle size, 130 Å pore size, p/n: 186002878) |
|
Aqueous mobile phase: |
5 mM ammonium formate in water + 0.1% formic acid (v/v) |
|
Organic mobile phase: |
acetonitrile + 0.1% formic acid (v/v) |
|
Needle wash solvent: |
water:methanol:acetonitrile:isopropanol 20:40:20:20 + 0.5% formic acid (volumetrically) |
|
Seal wash solvent: |
water:methanol 80:20 (v/v) |
|
Column temp.: |
40 °C |
|
Sample temp.: |
10 °C |
|
Injection volume: |
5 µL |
|
Flow rate: |
0.30 mL/min |
MS Conditions
|
MS system: |
Xevo TQ-S micro |
|
Ionization mode: |
ESI+ |
|
Acquisition mode: |
Multiple Reaction Monitoring (MRM) |
|
Capillary voltage: |
+0.75 kV |
|
Cone gas flow: |
50 L/Hr |
|
Desolvation temp.: |
600 °C |
|
Desolvation gas flow: |
850 L/Hr |
|
Source temp.: |
150 °C |
|
Resolution: |
MS1 Unit, MS2 Unit |
|
Software: |
waters_connect™ for quantitation (v. 1.0.) for data acquisition and processing |
Compound Optimization
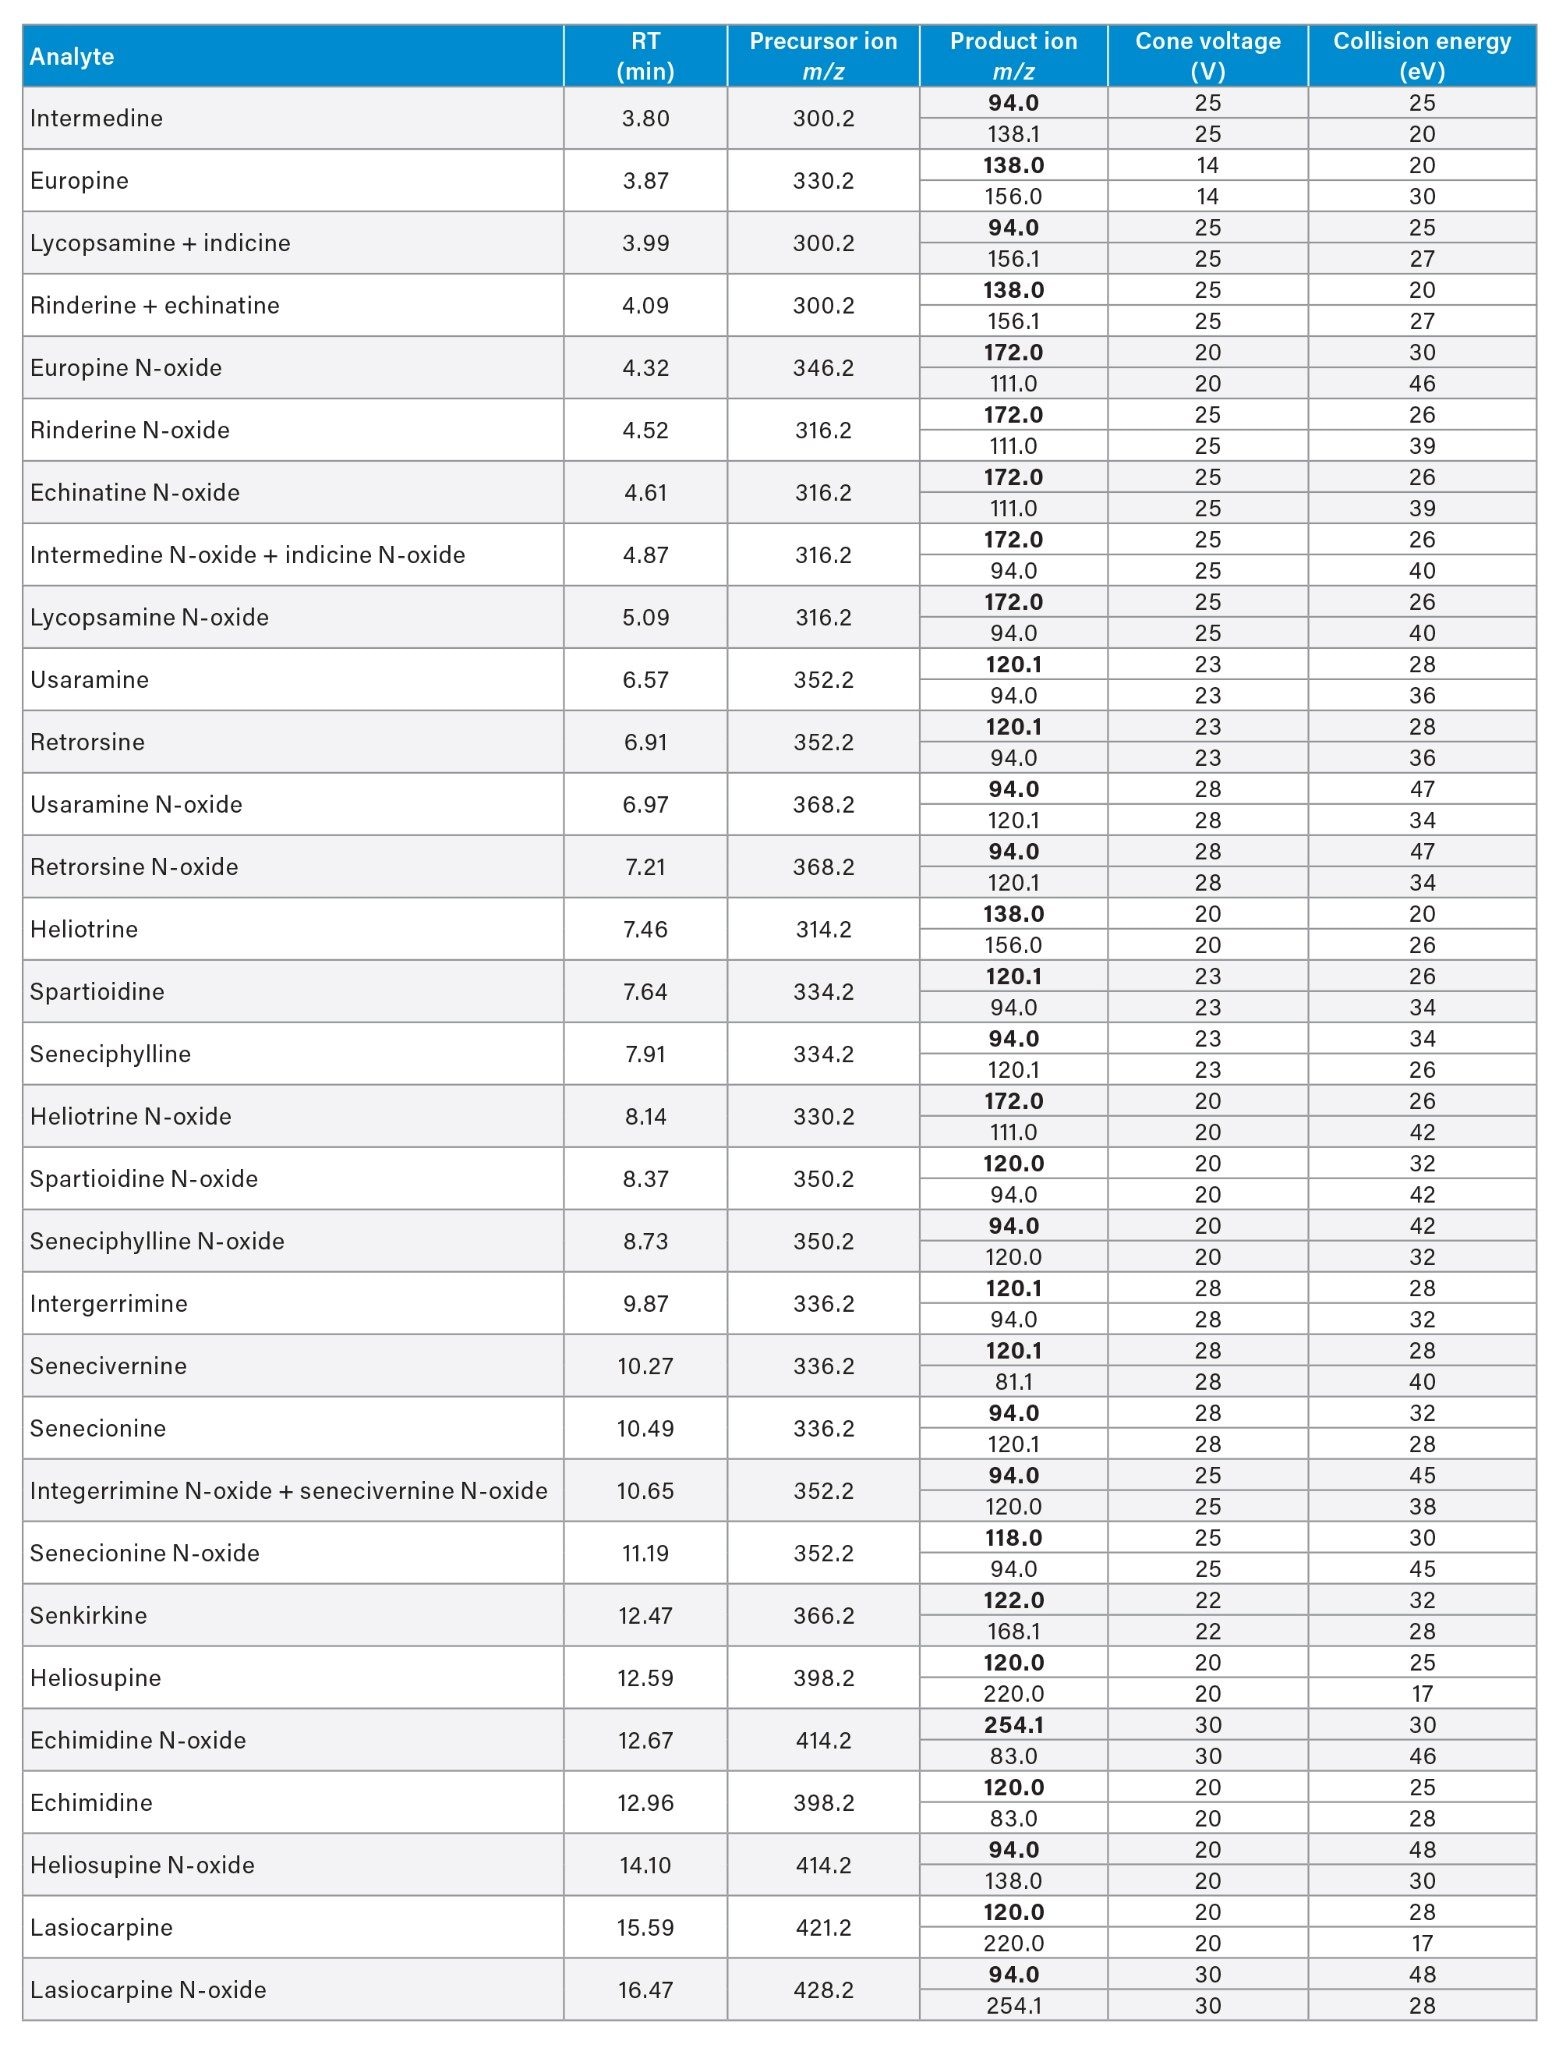
Individual compound solutions of 10 µg/mL were infused at 5 µL/min combined with 0.3 mL/min of mobile phase (1:1 aqueous:organic). Optimal precursor ion -> product ion MRM transitions, cone voltages, and collision energies were obtained automatically by using the optimization tool. Source voltages, gas flows, and temperatures were optimized based on the least sensitive compounds.
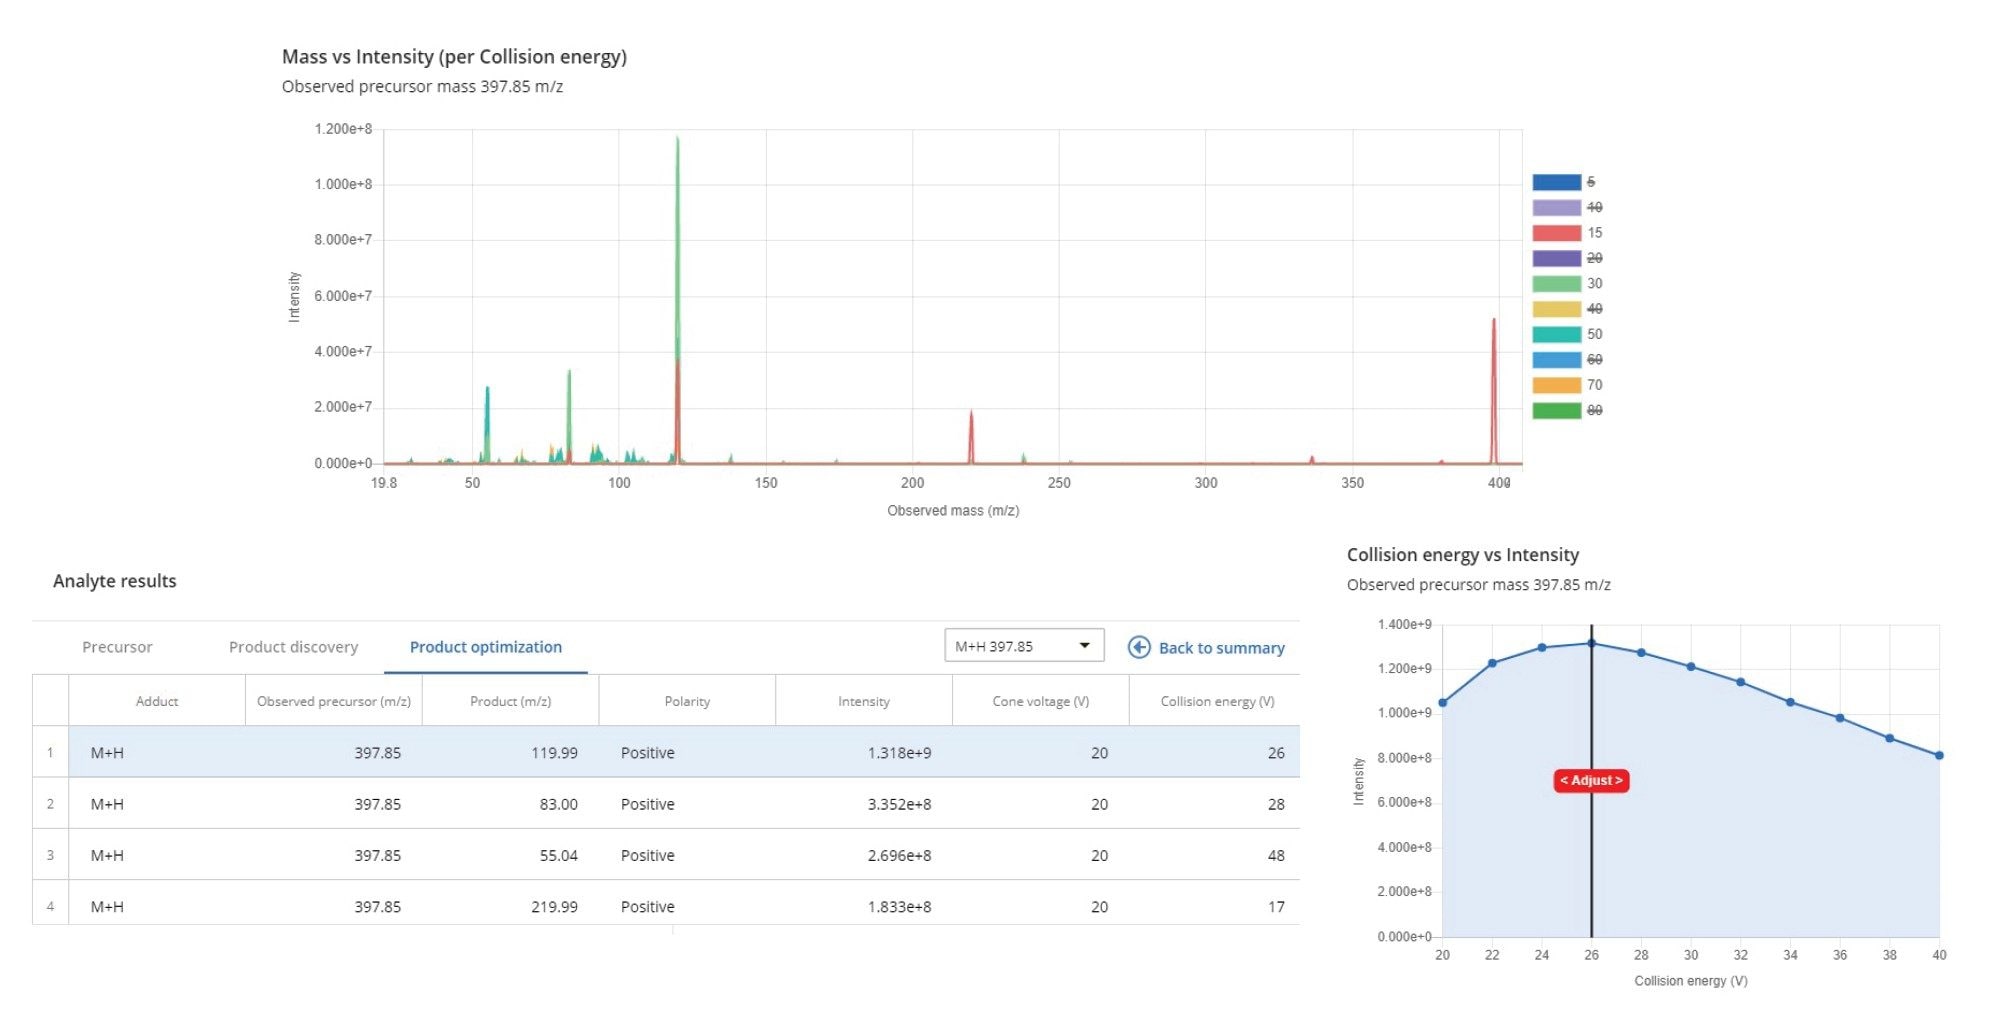
The optimization tool returns optimal MRM parameters for each analyte in less than one minute, and only requires specification of the name of the compound, monoisotopic mass or molecular formula, and adducts to be monitored. As an output, the tool generates a list of MRMs sorted by relative intensity, and it allows the manual refinement of cone voltage and collision energy via interactive plots (Figure 2).
Method Validation
The trueness of the method was assessed by spiking blank samples of green tea, chamomile and rooibos tea, oregano, cumin seeds, and honey with a mixture of 35 PAs at three concentration levels: 1 µg/kg in triplicate, 20 µg/kg in six replicates, and 250 µg/kg in triplicate, where these concentrations refer to each individual compound. Blanks and spiked samples were then extracted and analysed as described in the previous section. Repeatability of the method was assessed by standard deviation and %RSDr.
The performance of the method was evaluated using the criteria set out in the document CEN/TR 16059:2010 on single laboratory validation of mycotoxin methods.13
Results and Discussion
Chromatography
Obtaining a good chromatographic separation of all 35 PAs was undoubtedly the biggest challenge in the development of the present method. This is because there are ten groups of isomers, for a total of 28 compounds out of 35, and 14 are known to co-elute in both reverse and normal phase liquid chromatography. In fact, the well-known difficulties in achieving baseline separation was one of the reasons why the EU Regulation set maximum limits for the sum of PAs, rather than setting limits for individual compounds.
During the method development stage, a series of different conditions were tested with the aim to enhance the resolution of critical pairs of isomers.
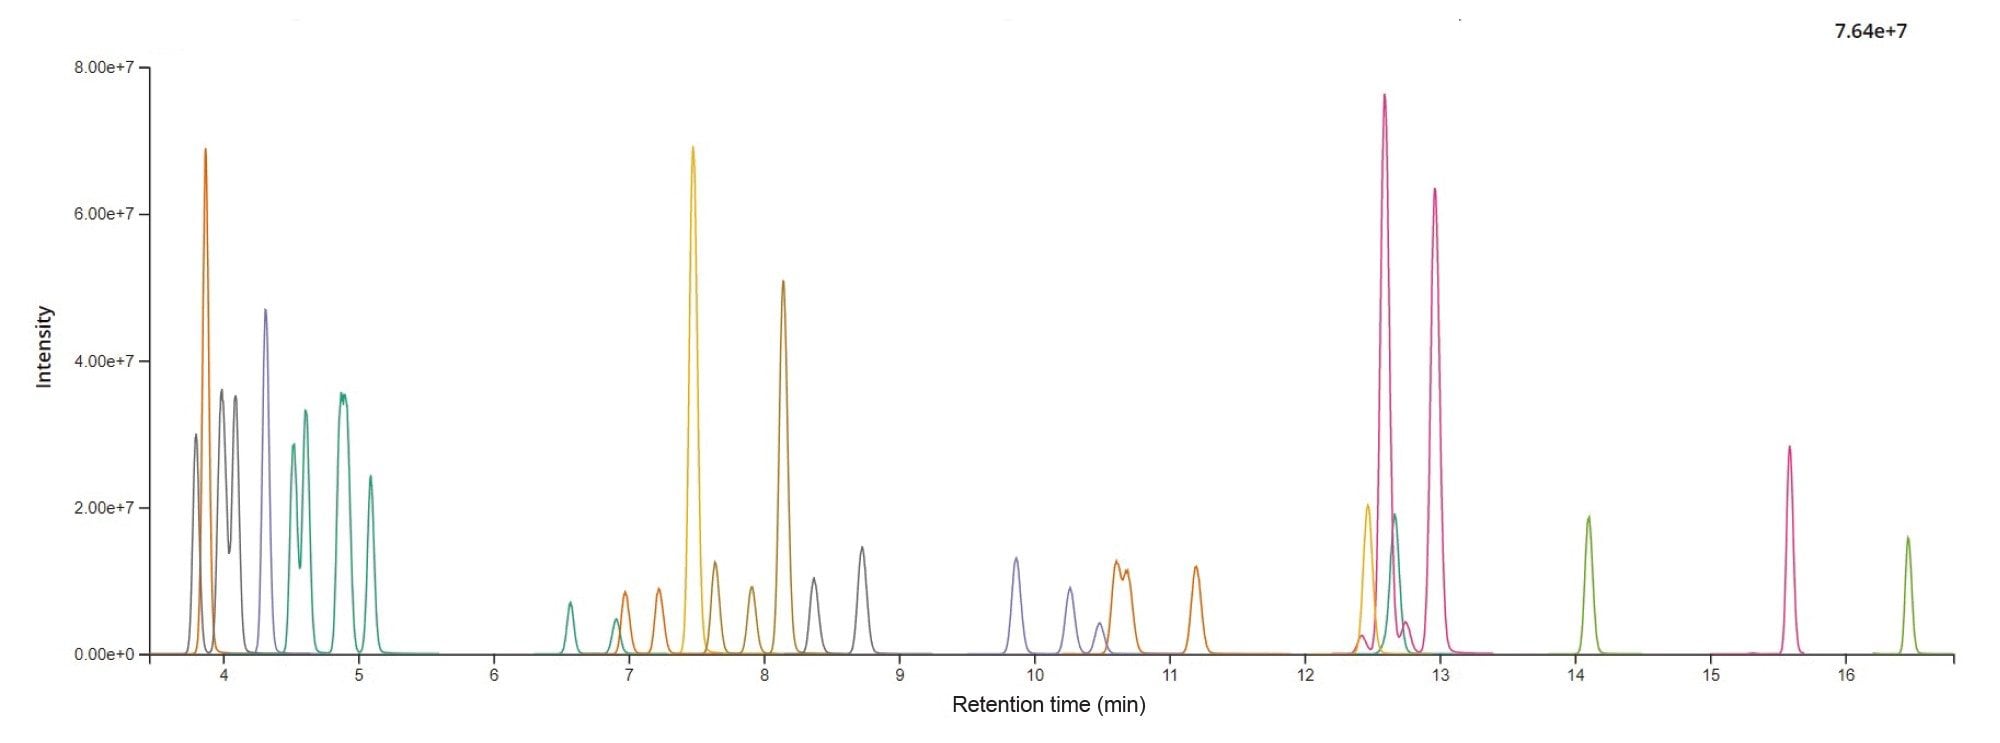
The BEH C8 2.1 x 100 mm (1.7 µm p.s.) was selected for method validation as it provided the best compromise in chromatographic resolution across all compounds in a single method. Optimized LC conditions are listed in the experimental section. A representative chromatogram of a tea extract spiked with 35 PAs is shown in Figure 3. Baseline separation was achieved for the isomeric compounds: Heliosupine/Echimidine, Spartioidine N-oxide/Seneciphylline N-oxide, Integerrimine/Senecivernine/Senecionine, Spartioidine/Seneciphylline, Usaramine N-oxide/Retrorsine N-oxide (see examples in Figure 4). Whilst four pairs of coeluting isomers were quantified as sum: Lycopsamine + Indicine (RT = 3.99 minutes), Rinderine + Echinatine (RT = 4.09 minutes), Intermedine N-oxide+Indicine N-oxide (RT = 4.87 min) and Integerrimine N-oxide + Senecivernine N-oxide (RT = 10.65 minutes). Retention time precision was excellent, with retention time shifts less than ±0.03 minutes within each analysis batch.
![Chromatographic peaks of isomers with ions (a). [C18H23NO6+H]+ m/z 350.2>94.0 (b). [C20H31NO7+H]+ m/z 398.2>120.0, (c). [C18H25NO5+H]+ m/z 336.2>120.1 and (d). [C18H23NO5+H]+ m/z 334.2>94.0.](/content/dam/waters/en/app-notes/2022/720007624/720007624en-f4.jpg.82.resize/img.jpg)
Linearity And Limits Of Quantification
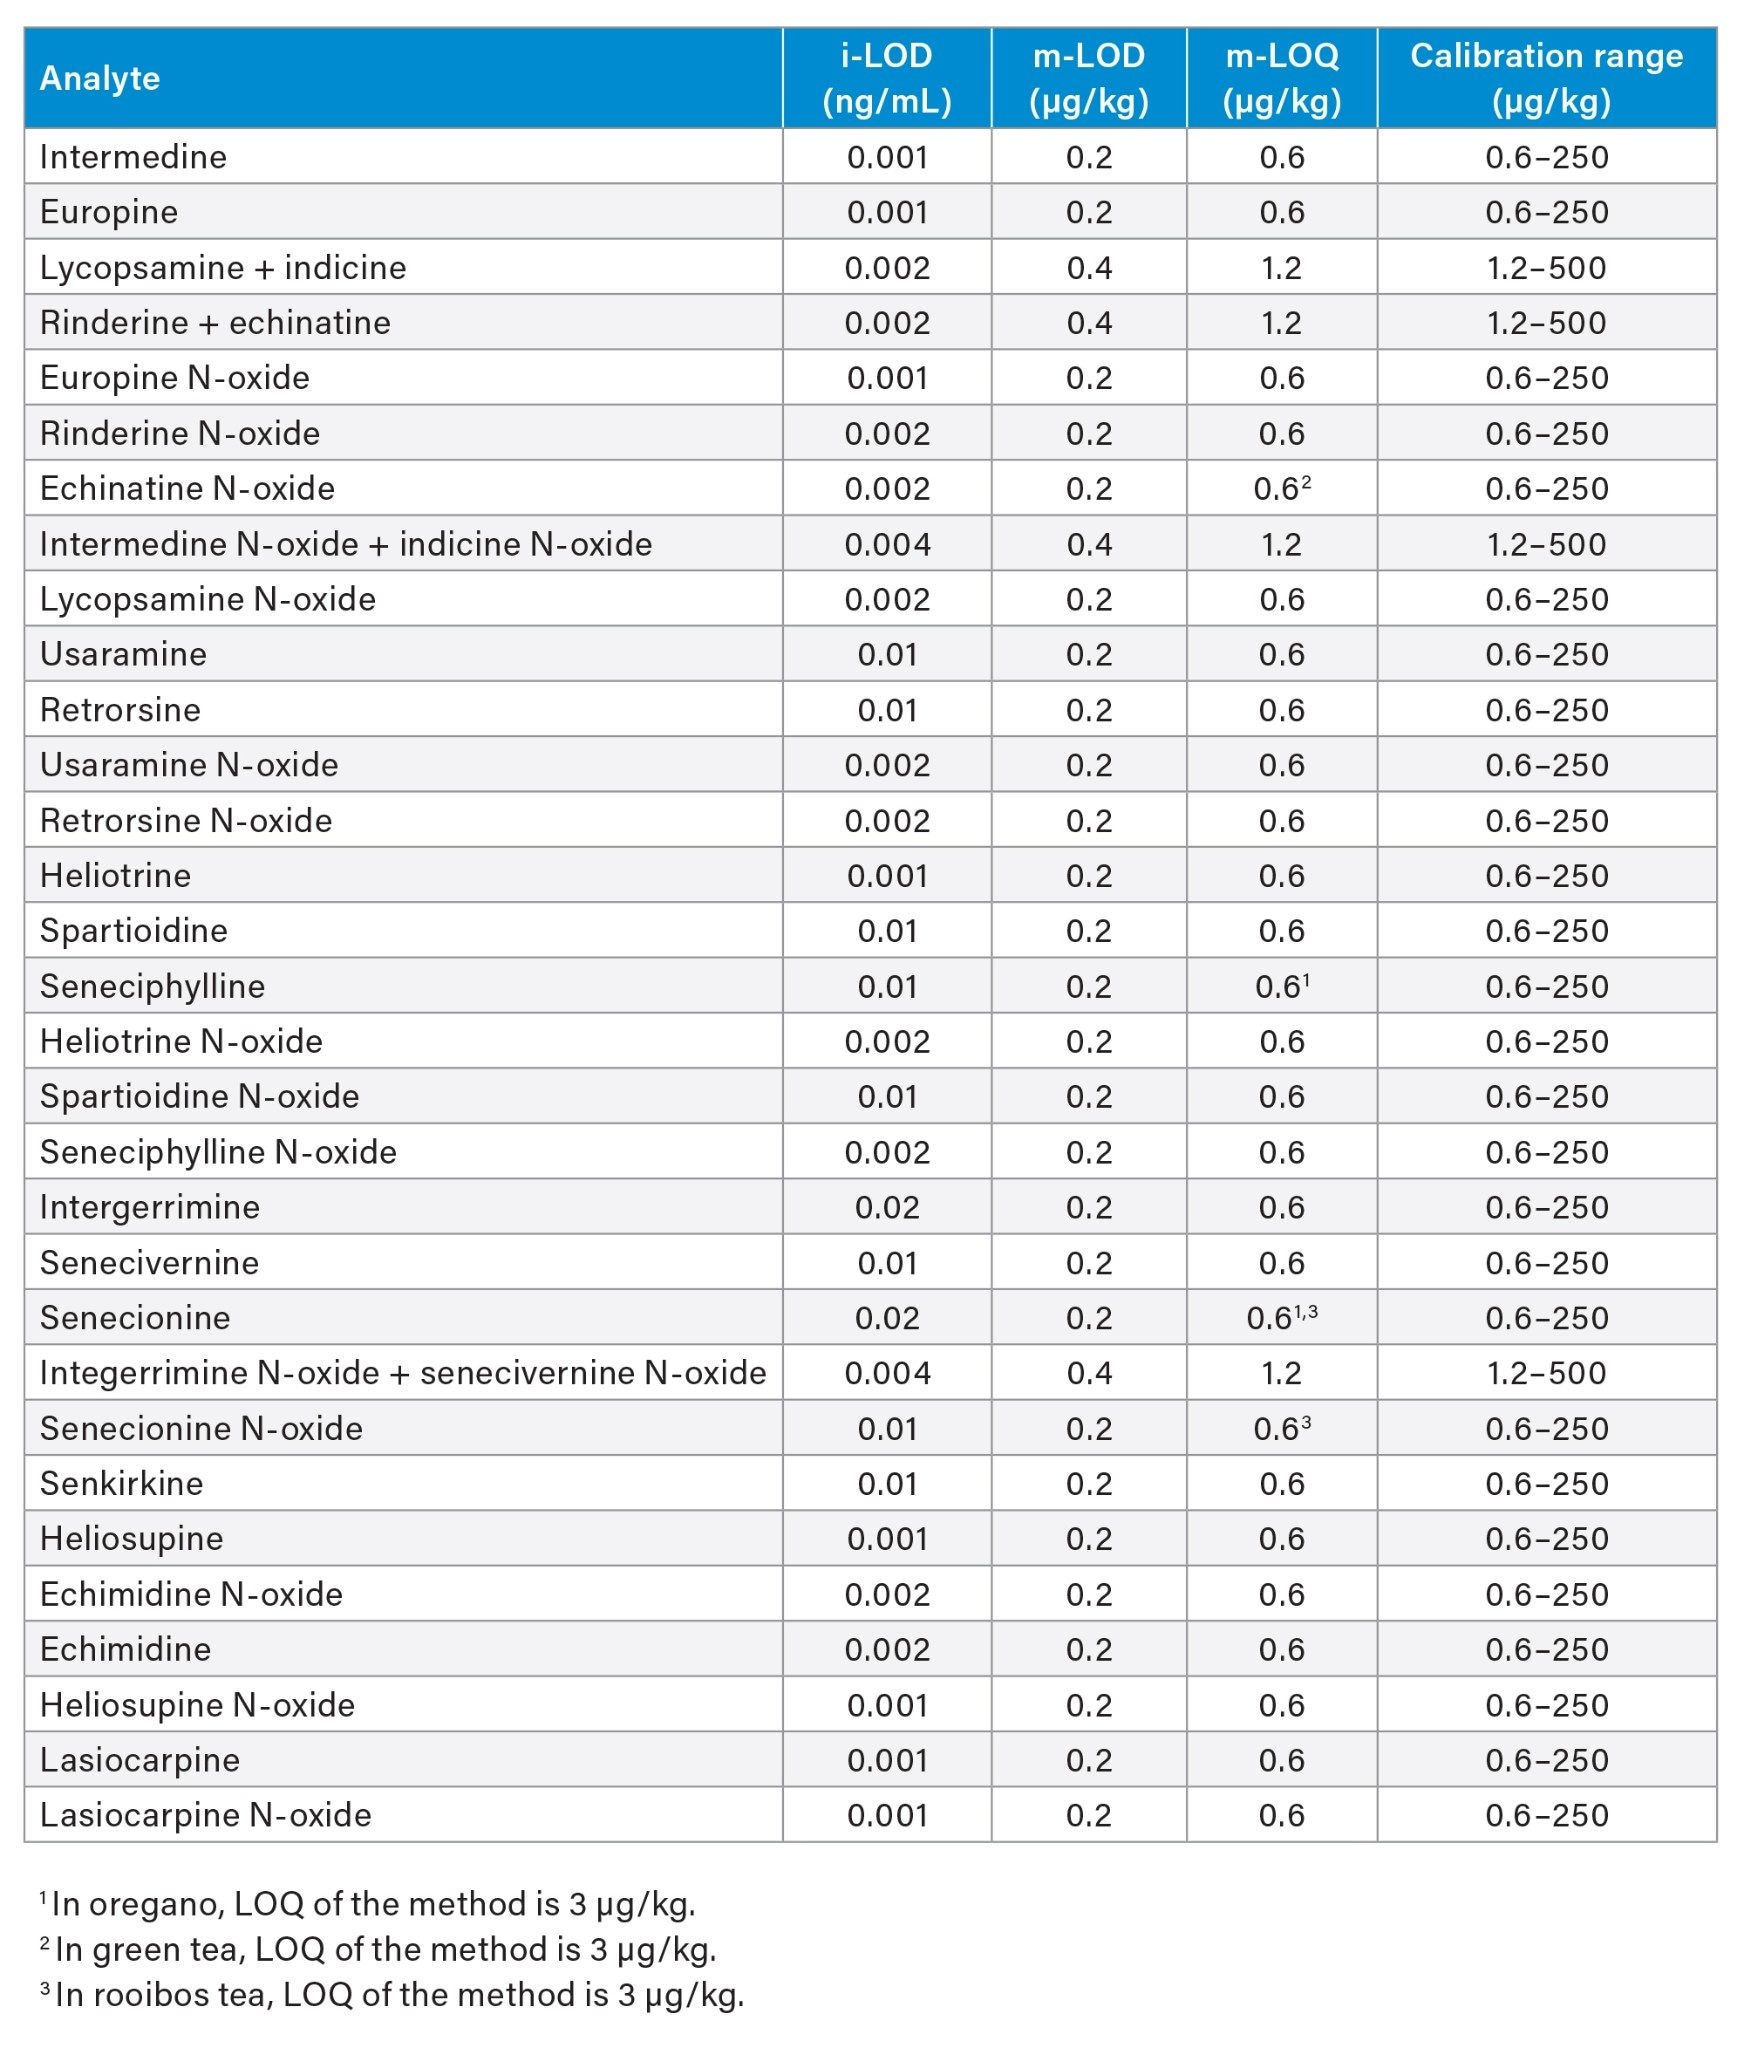
A quadratic fit and a weighting factor (1/x) was used to construct the matrix-matched calibration curves. The linear range of the method was 0.6–250 µg/kg for all compounds across the different sample types, with the exceptions reported in Table 3. Coefficients of determination of the calibration curves (R2) were >0.9900, and residuals were within ±20% for all compounds. The instrument limit of detection (i-LOD)14 was calculated on solvent standards (signal-to-noise ratio ≥3 at the LOD level) and ranged between 0.001 and 0.02 ng/mL for individual PAs (equivalent to 5–100 fg on column). The method limits of quantification (m-LOQ) were adopted as the lowest level of the calibration range, provided that it presented a signal-to-noise ratio ≥10. The m-LOQ of coeluting isomers (expressed as a sum) was 1.2 µg/kg, while for the individual PAs m-LOQ was 0.6 µg/kg. Table 3 shows i-LOD as well as m-LOD, m-LOQ, and linear range in green tea, chamomile tea, rooibos tea, oregano, cumin seeds, and honey. The linear range of the method allowed for the determination of pyrrolizidine alkaloids at typical levels found by regulatory testing for the food commodities tested. The ion ratios of all tested samples were within ±30% of the average ion ratios calculated on the calibration standards from the same sequence.
Trueness And Repeatability
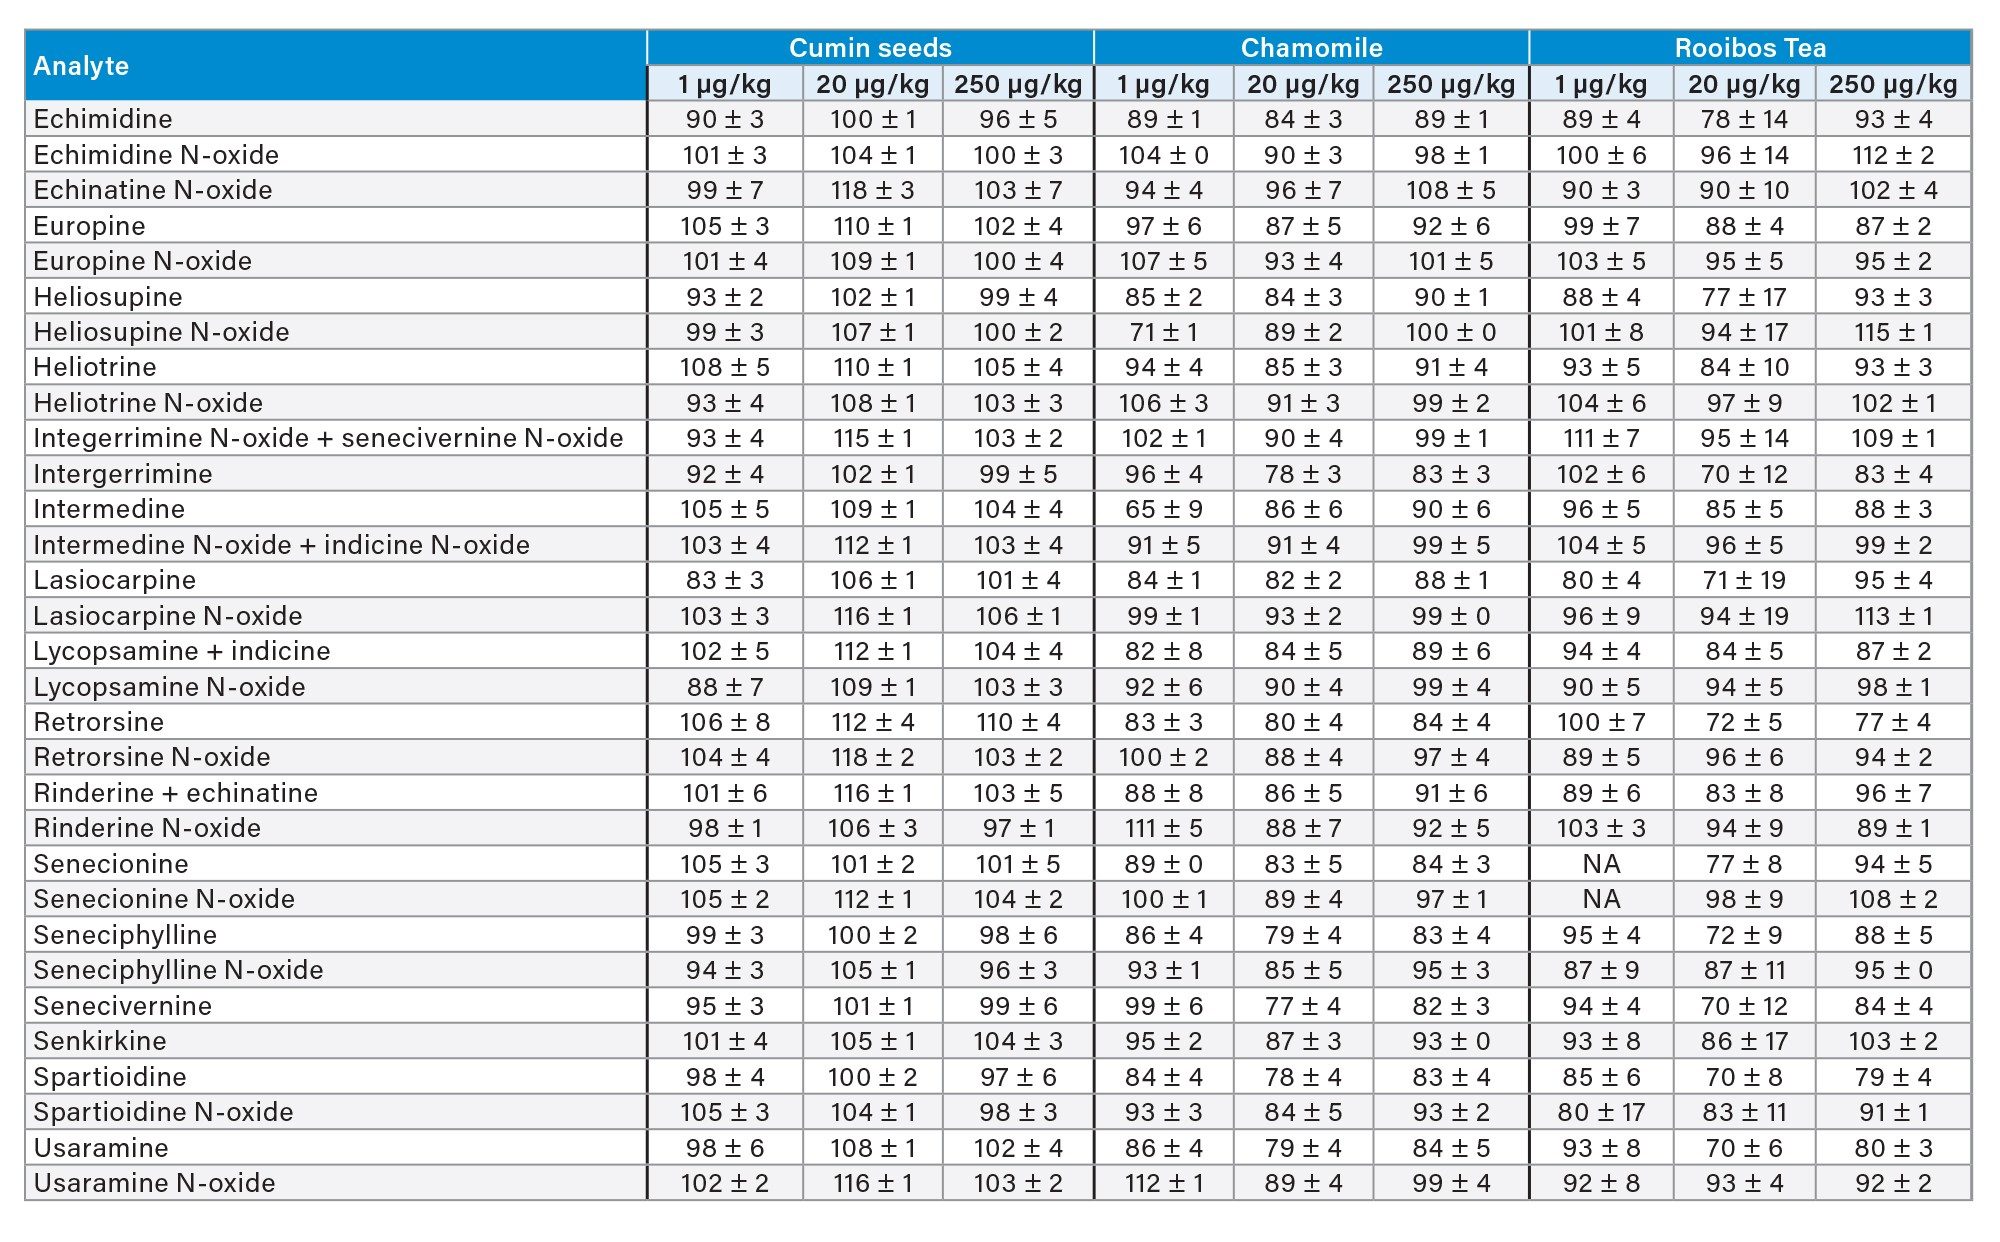
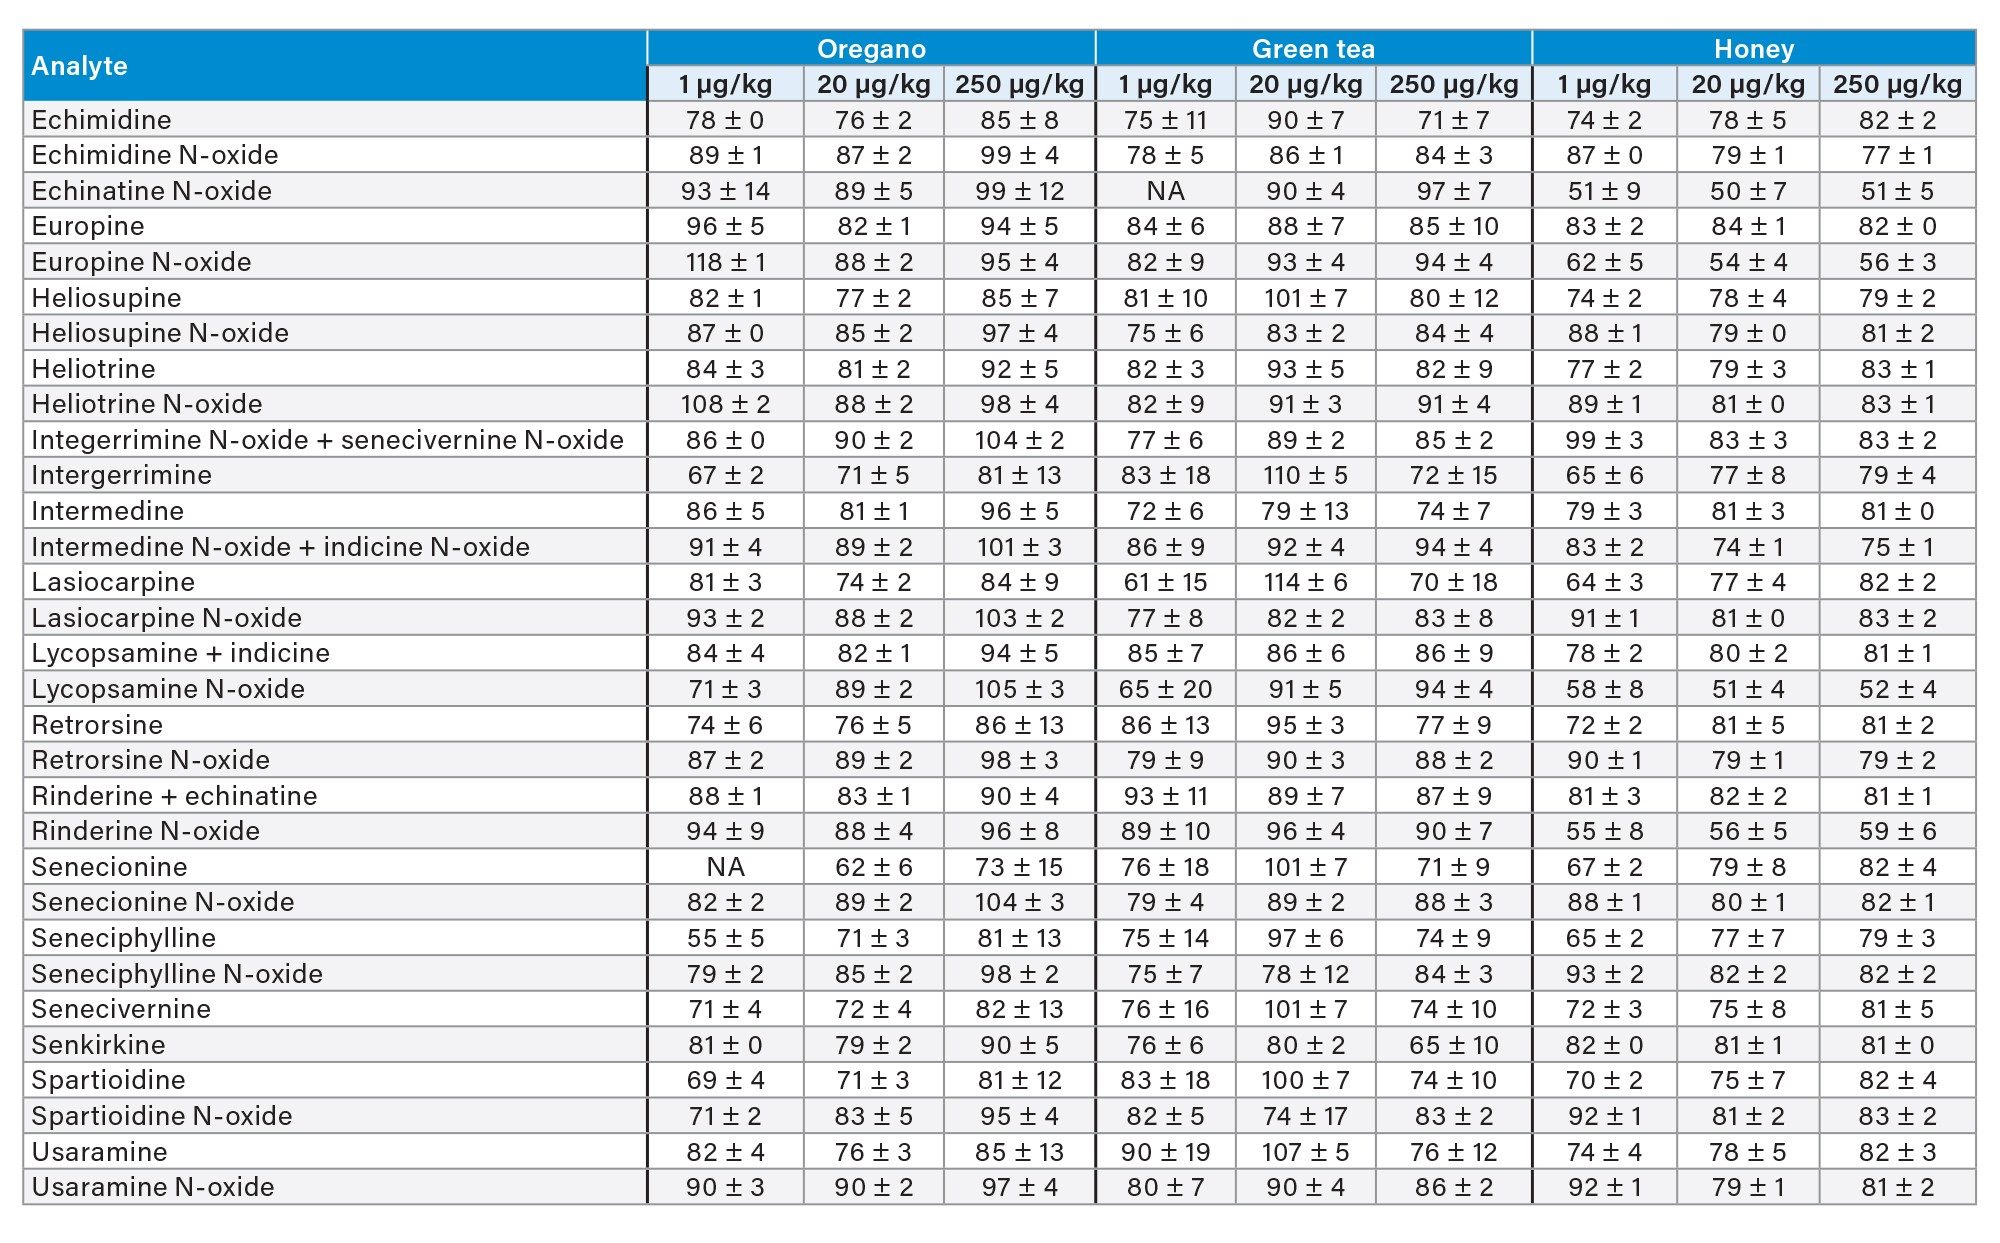
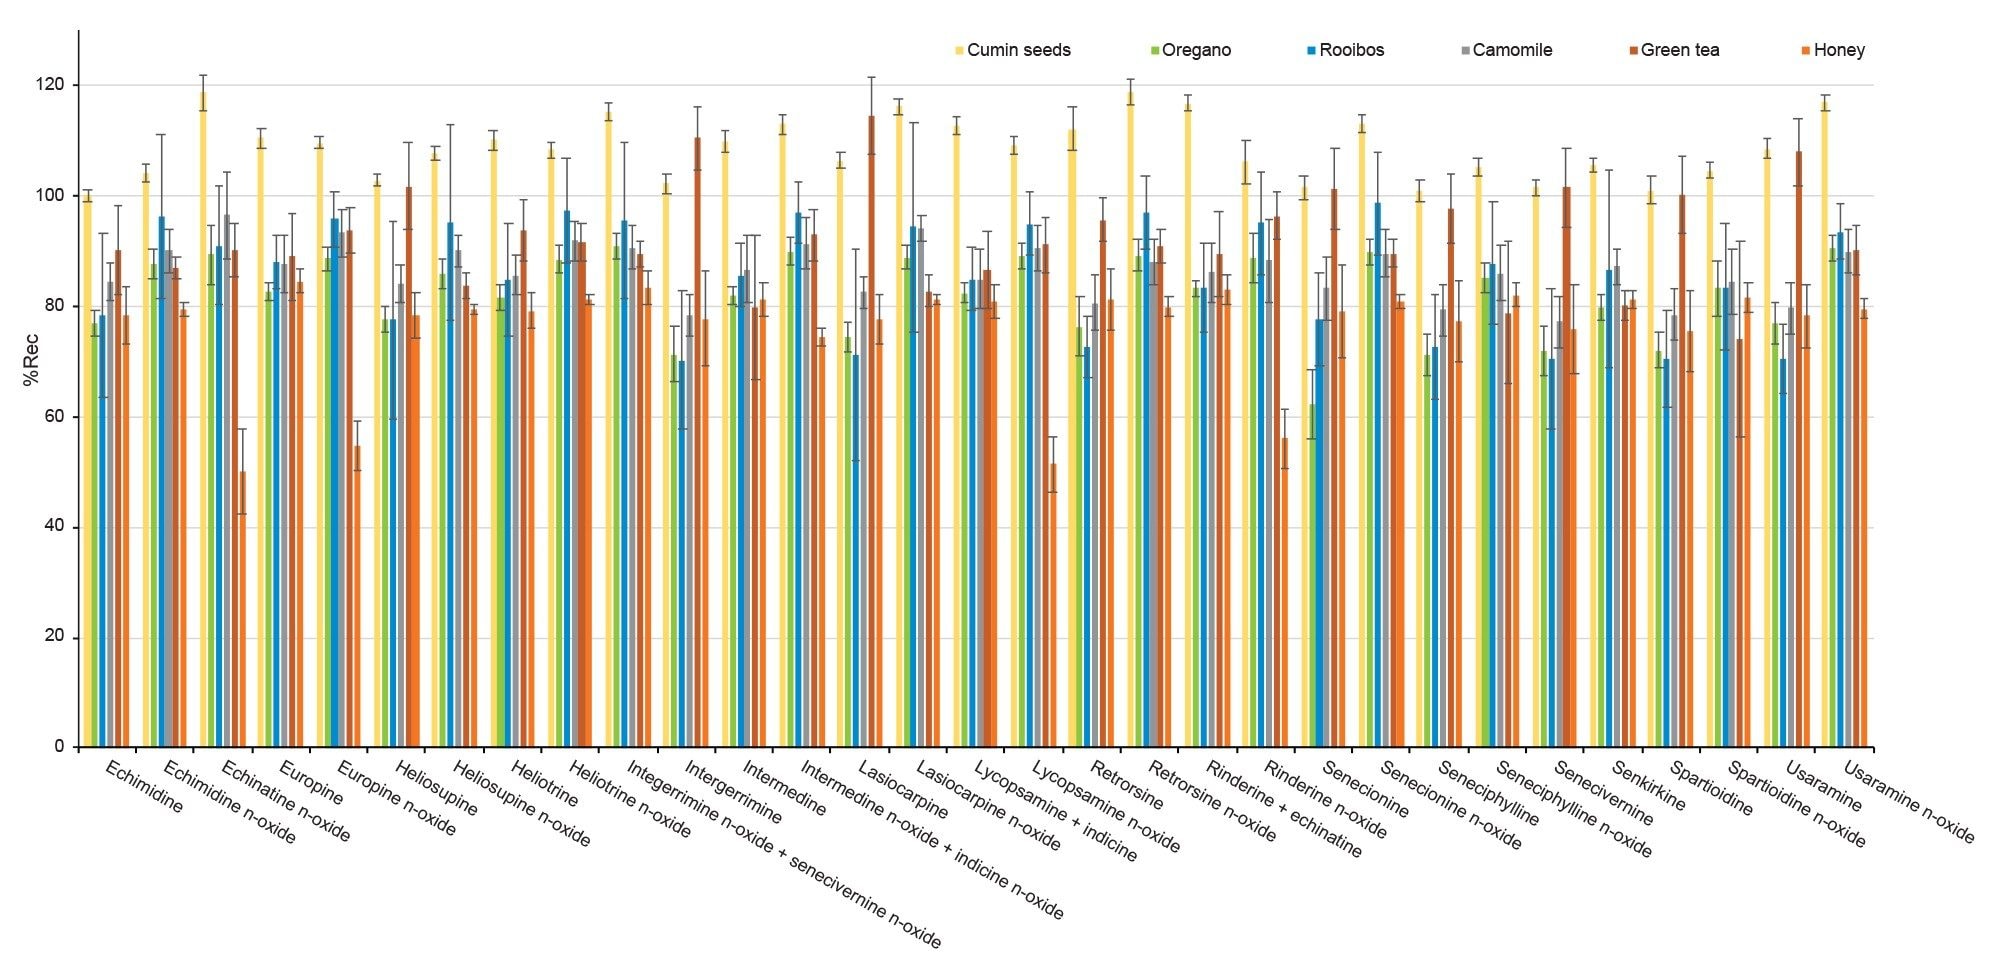
Trueness was assessed by recovery experiments which involved spiking a blank sample at three concentration levels. When considering the whole panel of PAs together, mean percentage recovery across all spike levels was 85 ± 10% for green tea, 91 ± 8% for chamomile tea, 92 ± 10% for rooibos tea, 87 ± 10% for oregano, 103 ± 6% for cumin seeds, and 77 ± 10% for honey. Recoveries were above 62% for all PAs in plant-based sample, while for echinatine N-oxide, europine N-oxide, lycopsamine N-oxide, and rinderine N-oxide in honey recoveries were between 50 and 60%. Nevertheless, since RSD% under repeatability conditions for all compounds were below 10% across all spiking levels, it would be possible to apply a recovery correction factor as precision is not compromised. Alternatively, in the case of honey, procedural calibration can be used to compensate for recovery losses. Good repeatability was achieved, with RSDr% mostly below 10% and not exceeding 20% in all cases. Recoveries are reported in Table 4 and in Figure 5.
Impact Of Clean-up And Matrix Effects
In most cases, for plant-based samples such as herbs and spices, a certain degree of clean-up post extraction is necessary due to the presence of high concentrations of unwanted material. In the present work, the Oasis MCX SPE has been used for eliminating a portion of the matrix co-extractives that can compromise method performance and can contaminate the system. The SPE protocol adopted here is based on a typical load-wash-elute approach, making use of the cation-exchange mechanism for protonated basic compounds (i.e. alkaloids) under acidic conditions. After the washing steps, elution with a basic solvent is essential to selectively recover all PAs from the cartridge.
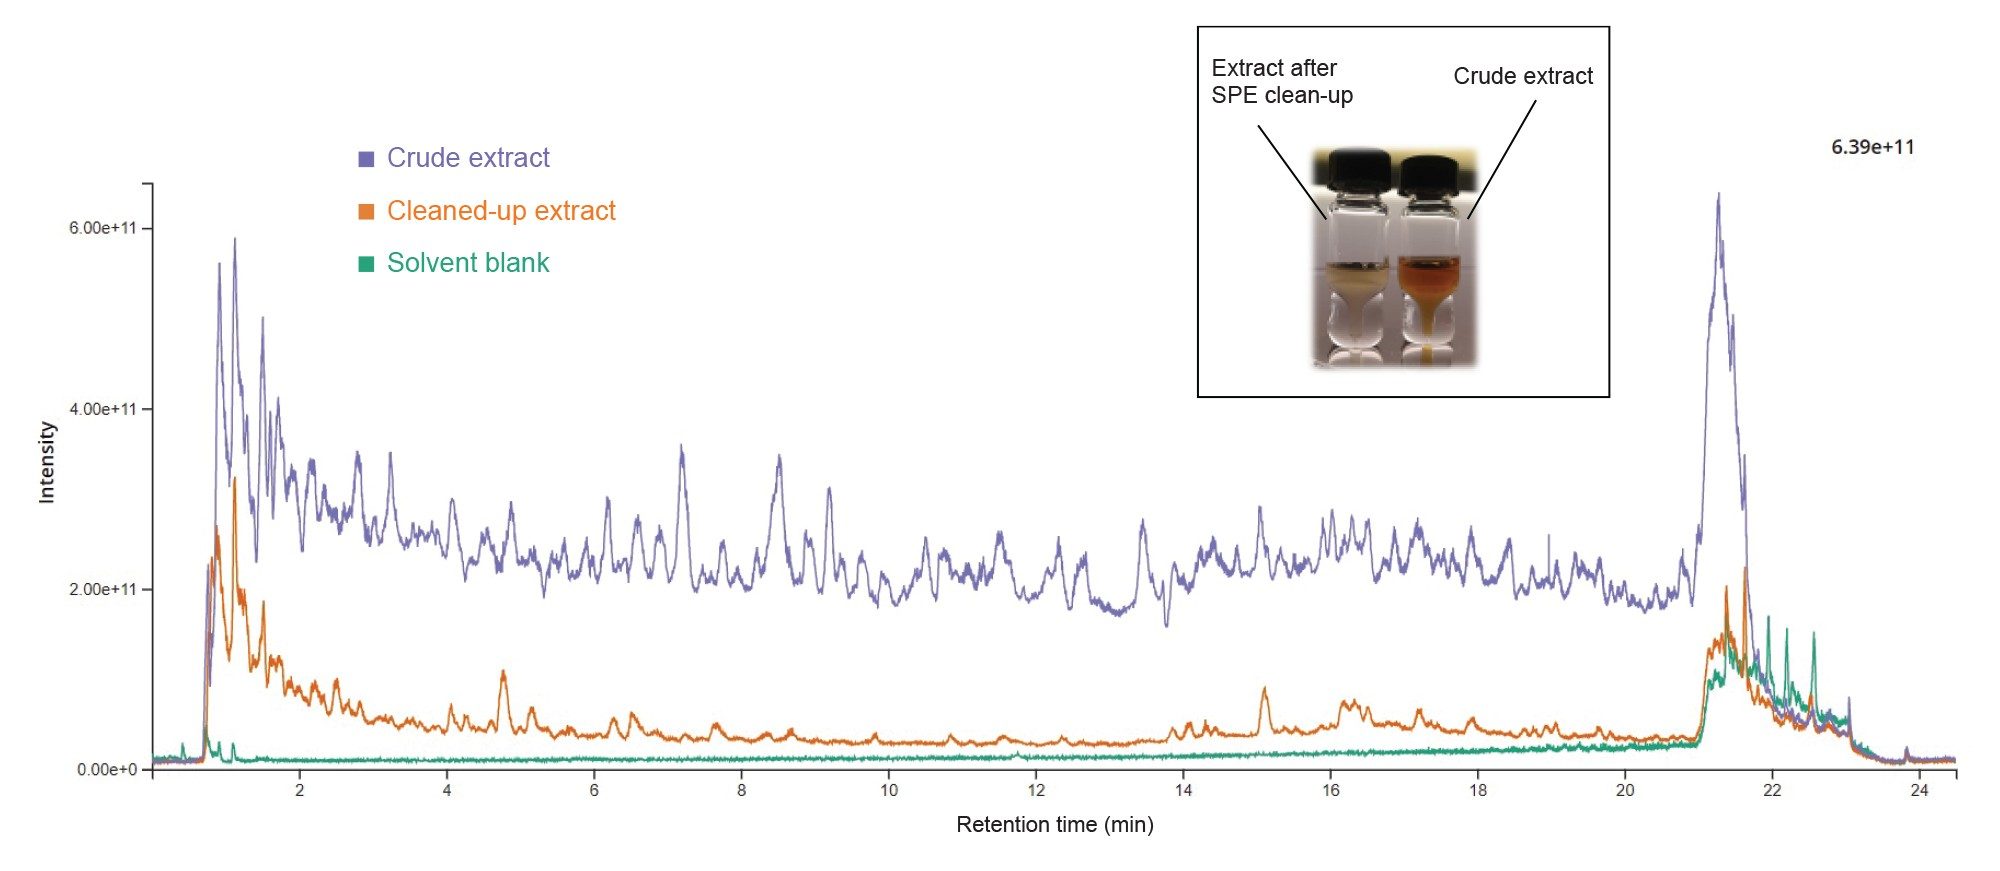
To illustrate the benefits of the SPE clean-up, we acquired chromatograms of a tea sample spiked with 35 PAs, extracted with and without applying the SPE clean-up prior to concentration and reconstitution. For this study, RADAR was used, an acquisition mode that acquires both MRM and full scan MS simultaneously. Switching between the two modes occurs in only 5 ms, ensuring that the duty cycle time is kept to a minimum while maximizing data points across the peak. In Figure 6 a crude extract full scan chromatogram is overlayed with a cleaned-up full scan chromatogram. It is evident the drastic decrease in signal for the total ion current (TIC) of the purified extract compared to the crude extract. This has the impact of significantly reducing the amount of matrix co-extractives being introduced into the LC-MS/MS, reducing the potential for isobaric interference, and reducing contamination of the system.
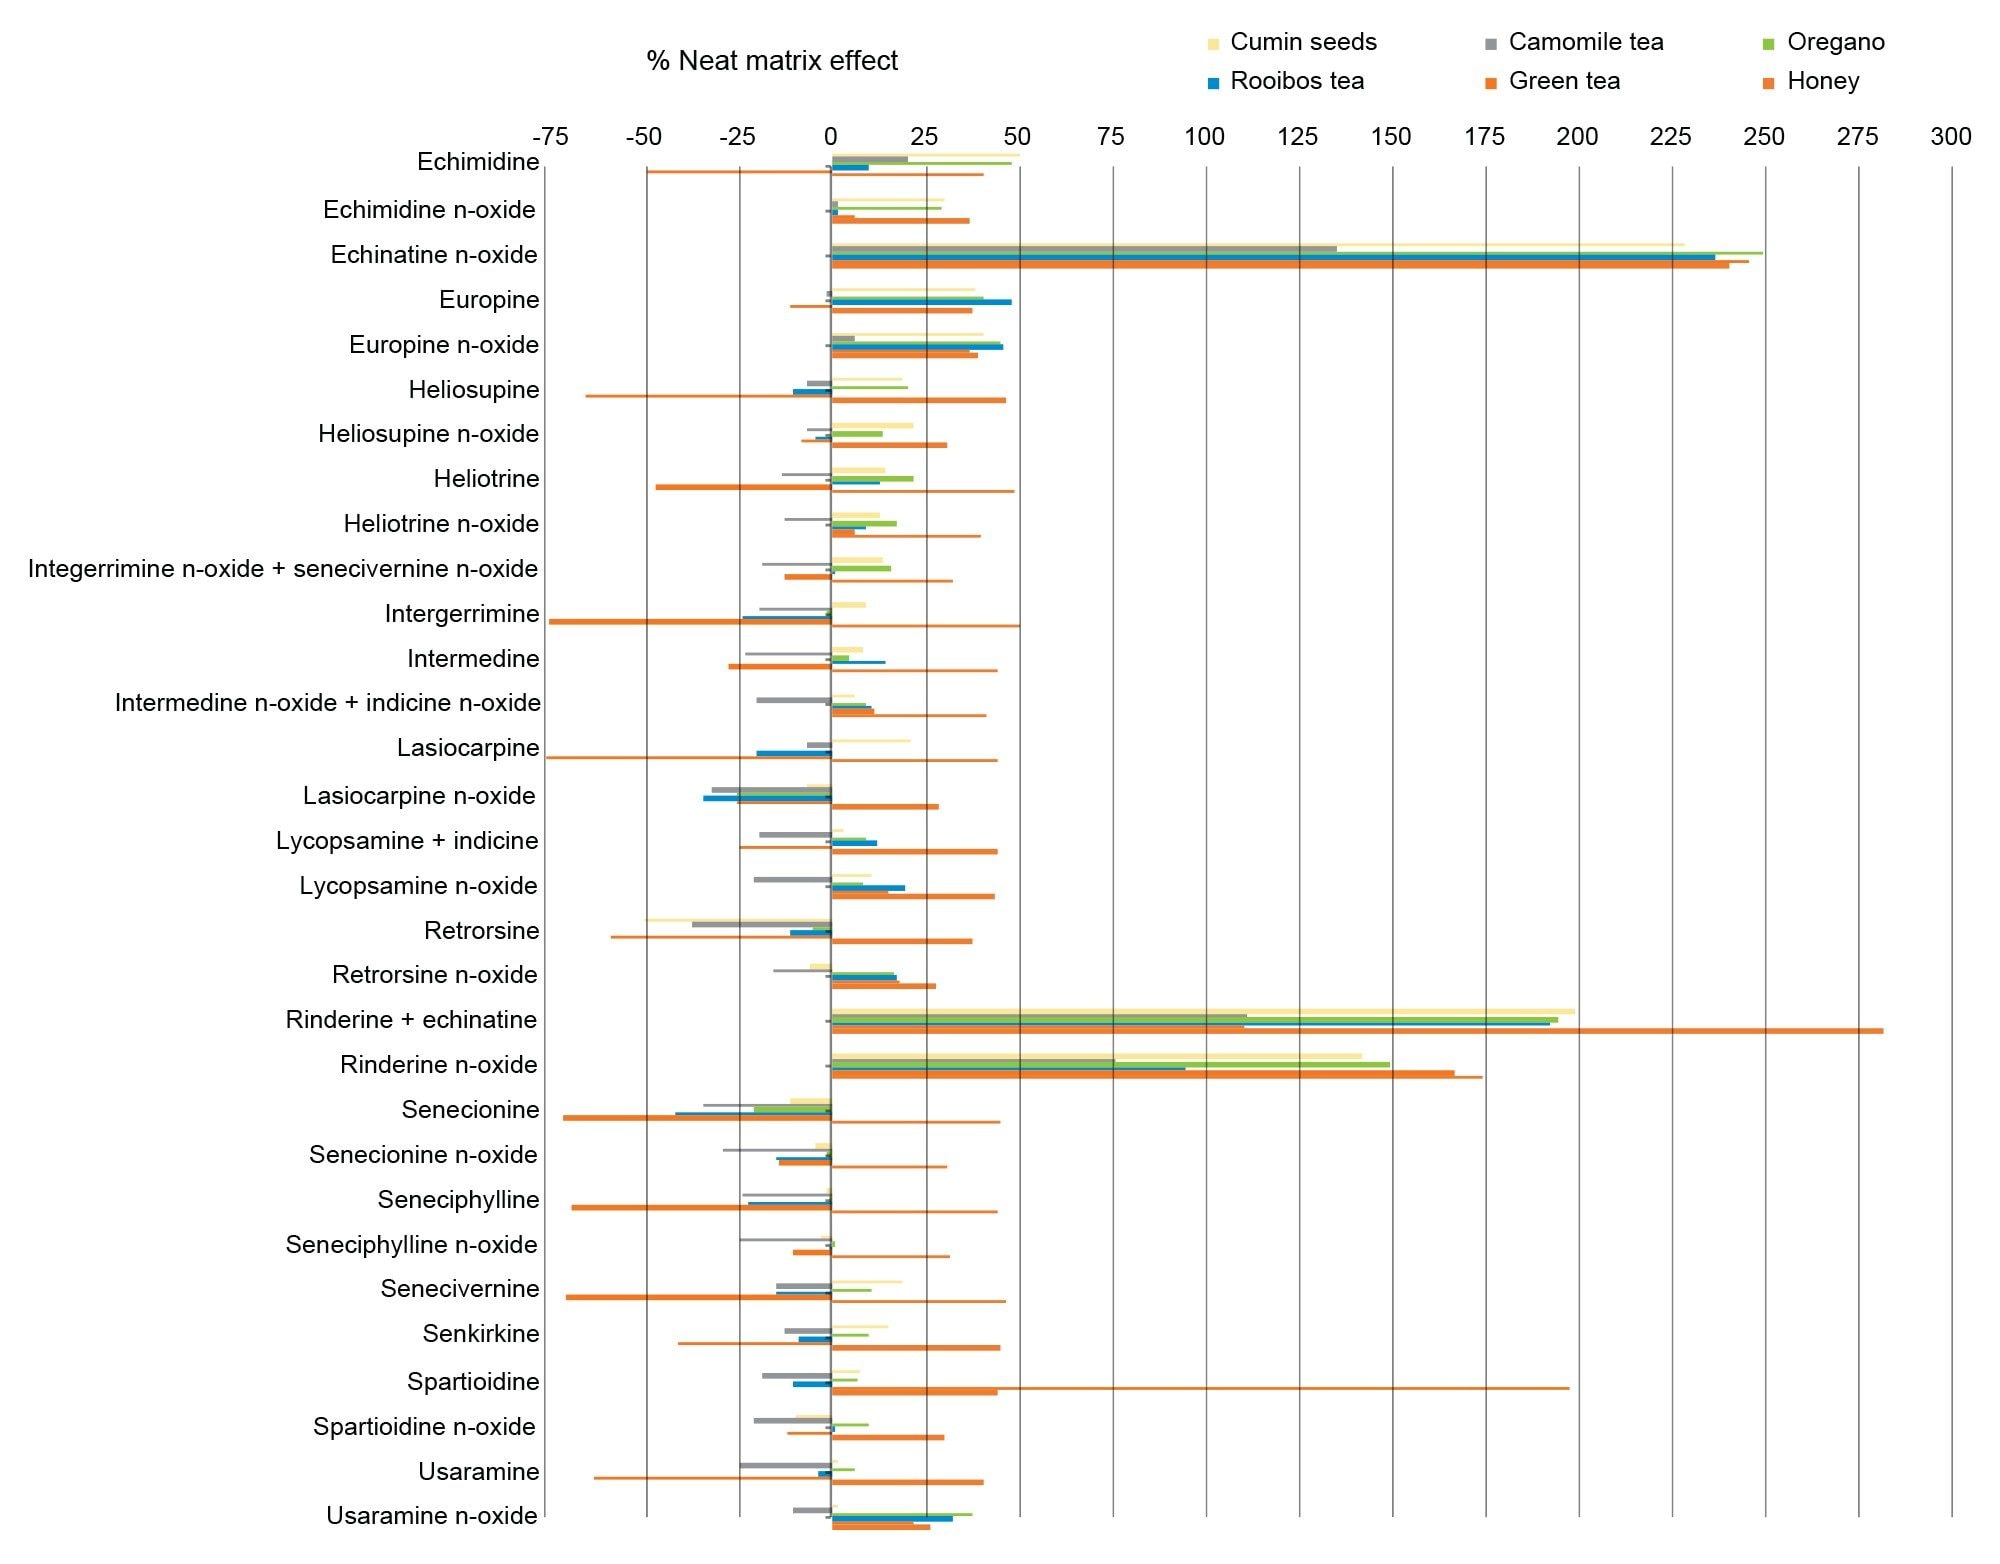
The accurate quantitation of PAs in complex matrices can be affected by matrix effects in ESI causing signal suppression or signal enhancement. Differences in the degree of matrix effects can be expected between different commodities such as honey and tea, as well as between individual samples of the same type.
Herein the neat matrix effect was calculated for each cleaned-up extract as:
%ME = (bM / bS -1) * 100
Where bM and bS are the slope of the matrix-matched and solvent calibration curves, respectively. Neat matrix effects ranged between -76 to +282% (see Figure 7). Negative values represent signal suppression while positive values indicate signal enhancement caused by the matrix. This demonstrates the need to used matrix-matched calibration, despite the positive contribution of the SPE clean-up.
Conclusion
A suitable UPLC-MS/MS method was developed and validated for the quantitative determination of all 35 pyrrolizidine alkaloids in six matrices, across a range of plant-based food commodities and honey.
The listing of multiple specific isomers within this regulation makes separation within a complete method very challenging under conventional chromatographic conditions. We achieved baseline separation for 27 of the 35 analytes, whilst four pairs of coeluting isomers were quantified as a sum – namely Lycopsamine + Indicine, Rinderine + Echinatine, Intermedine N-oxide + Indicine N-oxide, and Integerrimine N-oxide + Senecivernine N-oxide.
The optimized sample preparation procedure using Oasis MCX SPE clean-up was found to be very effective in reducing the interferences which can coelute with PAs.
The method performance was established by assessing trueness, repeatability, linearity, and limits of detection and quantification. LOD/LOQ across all matrices investigated were found to be significantly below the maximum limits set by the EU Regulation, allowing the method to be employed for testing of food intended for infants and young children, where maximum levels are given at 75 µg/kg for the sum of PAs.
References
- The Plant List, Version 1.1, Released September 2013 (2013). http://www.theplantlist.org.
- Schrenk D., Gao L., Lin G., Mahony C., Mulder P.J. P., Peijnenburg A., Pfuhler S., Rietjens M.C.M. I., Rutz L., Steinhoff B., These A. Pyrrolizidine Alkaloids in Food and Phytomedicine: Occurrence, Exposure, Toxicity, Mechanisms, and Risk Assessment - A Review. Food and Chemical Toxicology 136 (2020) 111107. https://doi.org/10.1016/j.fct.2019.111107.
- EFSA Panel on Contaminants in the Food Chain (Contam); Scientific Opinion on Pyrrolizidine Alkaloids in Food and Feed. EFSA Journal 2011; 9(11):2406. [134 pp.] https://doi.org/10.2903/j.efsa.
- EFSA Panel on Contaminants in the Food Chain (CONTAM); Statement on the Risks for Human Health Related to the Presence of Pyrrolizidine Alkaloids in Honey, Tea, Herbal Infusions and Food Supplements. EFSA Journal 2017; 15(7):4908. [34 pp.] https://doi.org/10.2903/j.efsa. 2017.4908.
- Commission Regulation (EU) 2020/2040 of 11 December 2020 Amending Regulation (EC) No 1881/2006 as Regards Maximum Levels of Pyrrolizidine Alkaloids in Certain Foodstuffs.
- Determination of Pyrrolizidine Alkaloids (PAs) In Plant Material by SPE-LC-MS/MS. BfR-PAs-Tea-2.0/2014. https://www.bfr.bund.de/cm/349/determination-of-pyrrolizidine-alkaloids-pa-in-plant-material.pdf
- Determination of Pyrrolizidine Alkaloids (PAs) In Honey by SPE-LC-MS/MS. BfR-PAs-Honey-1.0/2013. https://www.bfr.bund.de/cm/349/determination-of-pyrrolizidine-alkaloids-pa-in-honey.pdf
- Determination of Pyrrolizidine Alkaloids in Plant-Based Food and Feed Materials, Including (Herbal) Teas, Herbal Food Supplements, Fodder and Feedstuffs by LC-MS/MS. EURL-MP-method_002 (v. 3 – 2019).
- RADAR – Understanding Sample Complexity, Improving Quantitative Data Quality. White Paper, Waters Corporation. 2014. https://www.waters.com/nextgen/global/library/library-details.html?documentid=720005033.
- Kwon Y., Koo Y. and Jeong Y. Determination of Pyrrolizidine Alkaloids in Teas Using Liquid Chromatography–Tandem Mass Spectrometry Combined with Rapid-Easy Extraction. Foods (2021), 10, 2250. https://doi.org/10.3390/foods10102250.
- Jeong S. H., Choi E. Y., Kim J., Lee C., Kang J., Cho S., Ko K.Y. LC-ESI-MS/MS Simultaneous Analysis Method Coupled with Cation-Exchange Solid-Phase Extraction for Determination of Pyrrolizidine Alkaloids on Five Kinds of Herbal Medicines. J AOAC Int. (2021), Dec 11;104(6):1514–1525. https://doi.org/10.1093/jaoacint/qsab098.
- Kowalczyk E. and Kwiatek K. Pyrrolizidine alkaloids in honey: Determination With Liquid Chromatography-Mass Spectrometry Method. Journal of Veterinary Research (2018). 62(2), 173–181. https://doi.org/10.2478/jvetres-2018–0027.
- Standard Recommendation S.R. CEN/TR 16059:2010. Food Analysis - Performance Criteria for Single Laboratory Validated Methods of Analysis for the Determination of Mycotoxins. (2010) ICS 07.100.30. European Committee for Standardization.
- Magnusson B. and Örnemark U. (eds.) Eurachem Guide: The Fitness for Purpose of Analytical Methods- A Laboratory Guide to Method Validation and Related Topics, (2nd ed. 2014). ISBN 978–91–87461–59–0.
720007624, May 2022