Using the Waters ACQUITY RDa Detector Coupled to Multivariate Analysis (MVA) to Explore Chemical Fingerprints for Food Profiling - How to Tell Your Oat from Your Barley Flour
Abstract
This application note evaluates the RDa Detector as a compact routine accurate mass measurement tool for the investigation of chemical profiles of processed foods with the example of cereal flour samples (n=49) of different species. Data acquisition and processing with subsequent multivariate analysis was performed on a single platform. The principal component analysis (PCA) resulted in an unsupervised separation between groups according to species and subgrouping according to processing and growing conditions. The technical variance of the system is low with quality control (QC) samples grouping closely together which lays the foundation for general metabolomics approaches.
The system supports omics-focused investigations within the food and beverage manufacturing sector that wishes to understand differences in production processes, storage conditions and batch variations.
Benefits
The ACQUITY RDa Detector System offers increased accessibility to liquid chromatography (LC)-high resolution mass spectrometry (HRMS) time-of-flight (Tof) analysis and data interpretation for food integrity. Streamlined data acquisition and processing on a fit-for-purpose high-resolution platform are supporting a user-modifiable data review.
Introduction
Food manufacturers rely on their suppliers to provide authentic and safe ingredients of uniform quality in order to produce finished products to a consistent standard demanded by their customers. Raw ingredients may be sourced as partially processed, for example, milled cereal grains, ground herbs and spices. It may be difficult, or even impossible, to conduct satisfactory visual quality inspections so technology is often relied on to ensure consistent batch quality.
Any alteration to a foodstuff, either unintentional or deliberate, such as economically motivated fraud, may pose a potential safety risk to the consumer. Consumers might be intolerant or have allergies towards certain types of ingredients. The food industry is required to label products containing the declared allergens. At present, in the European Union, 14 food substances are required to be declared as allergens by food law including cereals containing gluten (such as barley and rye).1 A food safety incident was reported in 2015 by the U.S. Food and Drug Administration relating to the detection of peanut protein allergen in ground cumin spice as a result of the addition of peanut husk as a bulking agent. Peanut proteins can cause severe, or life-threatening allergic reactions in sensitive individuals who come into contact with, or consume foods containing these allergenic proteins.
Dried food commodities such as herbs, spices, teas and grain flours are often targets of ‘food fraud’ and various forms of food adulteration. Be it the addition of bulking materials such as wood dust or the substitution of a higher value ingredient with a lower cost alternative in order to increase profit margins.
LC-HRMS approaches are widely applied in food authenticity testing together with foodomics and multivariate analysis. Some examples include the adulteration of oregano,2 the investigation of polyphenols in cabbage,3 green tea component analysis,4,5 and the investigation of geographic origins of red wine.6
In this application note, we focus on the speciation of cereal grain flours via interrogation of the chemical fingerprints generated using the ACQUITY RDa Detector coupled to an ACQUITY UPLC I-CLASS Binary LC, an easy-to-use, compact LC-time-of-flight mass analyzer with integrated data processing in UNIFI. Streamlined UNIFI workflows can provide accurate mass measurements for the screening of food commodities for routine supply chain control in food manufacturing.
Experimental
Reference samples were obtained from a collaborator and consisted of different types of ground grains including wheat, durum wheat, oat, barley, and rye. The grain flour samples (n=49) were prepared according to a generic sample extraction method and analysed in triplicate using the ACQUITY RDa Detector. A QC pool of all sample extracts was generated, to evaluate the technical repeatability of the assay. The system is controlled by UNIFI Software which facilitates the operation by automating the setup and calibration routines. The number of injections was approximately 300, including blanks and the data acquisition ran for approximately three days continuously.
Extraction Method
The sample extracts were prepared accordingly to an adapted protocol for natural toxin multi-analyte analysis.7 10 mL acetonitrile/water (84/16, v/v) were added to 2.5 g of sample and mixed by shaking. The sample mixture was left to stand for one hour at room temperature. The extraction tube was centrifuged (2000 rcf, 10 minutes) and a 0.5 mL aliquot of the resulting supernatant was removed and centrifuged for a second time (15,000 rcf, 5 minutes). A 0.25 mL aliquot of the supernatant was diluted with an equal volume of water containing 1% acetic acid. The mixture was centrifuged again (15,000 rcf, 5 minutes) and then transferred to an autosampler vial and analyzed on the ACQUITY RDa Detector.
Instrument settings
The optimised instrument conditions are given in Table 1-3.
Table 1. Ultra-performance liquid chromatography separation method for the analysis of cereal samples.
|
LC system: |
ACQUITY UPLC I-Class PLUS |
|
Column: |
ACQUITY UPLC HSS T3 2.1 x 100 mm, 1.8 µm (p/n: 186003539) |
|
Mobile phase A: |
10 mM ammonium formate in water with 0.3% formic acid |
|
Mobile phase B: |
10 mM ammonium formate in methanol with 0.3% formic acid |
|
Column temp.: |
45 °C |
|
Injection volume: |
5 µL |
Table 2. Mass spectrometry settings of the ACQUITY RDa Detector, equipped with a dedicated electrospray ionization source.
|
MS detector: |
ACQUITY RDa Detector |
|
Mode: |
Full scan with fragmentation |
|
Mass range: |
Low (50–2000 m/z) |
|
Polarity: |
Positive ion |
|
Scan rate: |
10 Hz |
|
Cone voltage: |
30 V |
|
Fragmentation cone voltage ramping: |
60–120 V |
|
Capillary voltage: |
1.5 kV |
|
Desolvation temp.: |
550 °C |
The data was acquired and processed using UNIFI on waters_connect (Version 1.2.0) with EZinfo (Version 3.0.3, Umetrics) performing the peak picking in UNIFI and the multivariate analysis in EZinfo.
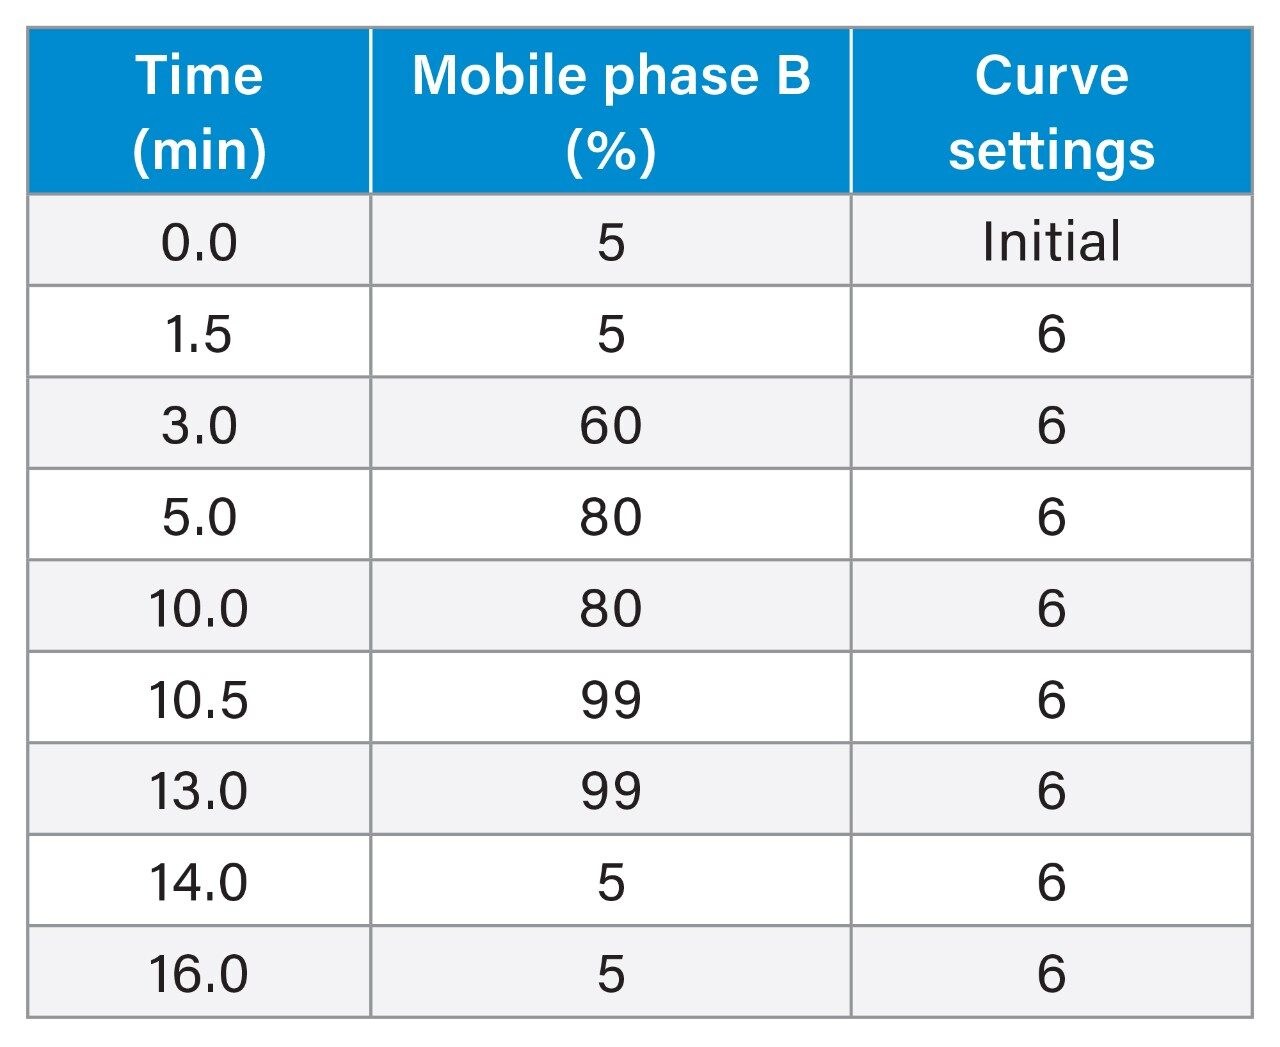 Table 3. Gradient for the separation of cereal samples on ACQUITY UPLC I-Class PLUS with a flow rate of 0.5 mL/minute.
The RDa instrument uses integrated SmartMS Technology which automatically completes the detector setup, auto-tune and mass calibration routines using manufactured ready-to-use solution bottles placed into the appropriate position in the on-board fluidics unit at the front of the mass spectrometer. Following the automated set-up and health check routine the RDa System informs the analyst when it is ready for operation or if any maintenance is required (Figure 1).
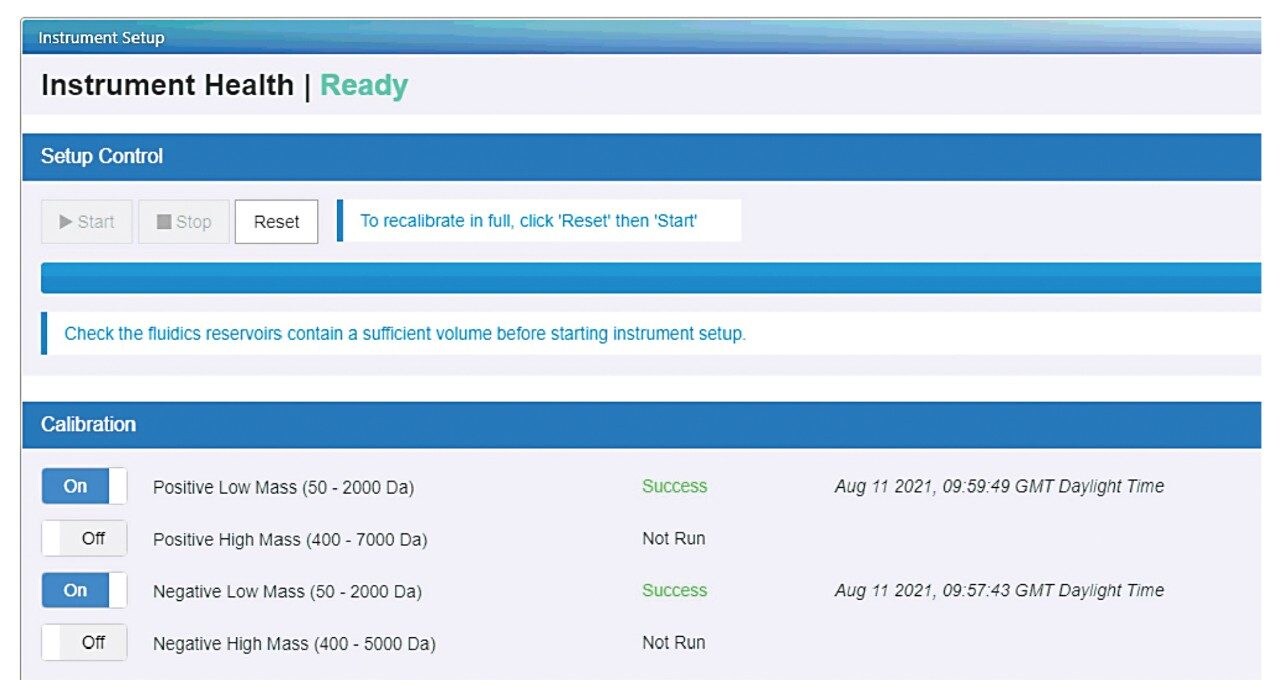 Figure 1. Easy-to-use instrument health display for users as part of SmartMS technology to configure calibration routines and start instrument setup.
Data acquisition and processing is simplified via the use of pre-defined UNIFI workflows available for targeted and non-targeted screening, marker selection, and multivariate analysis.
Experimental Design
The workflow is illustrated in Figure 2. The samples were initially screened for the presence of natural toxins at, or above the EU regulatory limits using a custom-made UNIFI screening library constructed from experimentally derived data. As the natural toxins defined in this library were not detected at any significant levels, the investigation was focused on the characterization of the differences between the cereal grains and any potential markers of species, or other attributes such as harvest time or growing conditions. For this purpose, the UNIFI Multivariate Analysis (MVA) workflow was utilised. As part of the UNIFI processing routine, the profile data was normalized to the total ion chromatogram (TIC) to account for any intensity variations over the course of the analysis. The UNIFI data was exported to EZinfo and scaled according to the Pareto distribution prior to subsequent statistical and multivariate analysis.
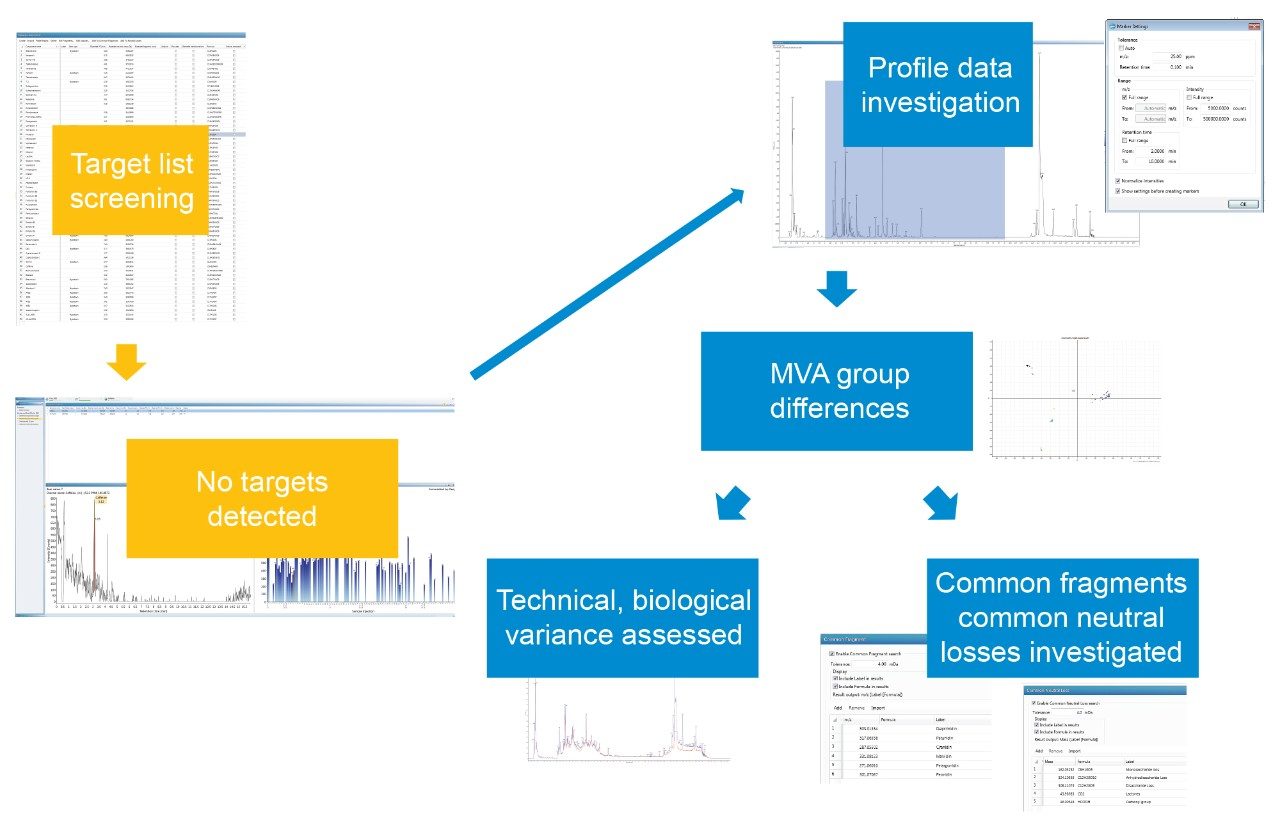 Figure 2. Workflow on the ACQUITY RDa Detector with UNIFI application and EZinfo.
Results and Discussion
1. Cereal grain chemical fingerprints generated using the RDa
Figure 3 shows an overlay of chromatograms of QC samples of injection 15 and injection 167 illustrating low technical variance over the course of the three days the cereal samples were run. In -omics studies low technical variance and measurement repeatability are crucial to conduct analyses and enable identification of markers responsible for group separation. Experimental observations showed the system needs about five injections to equilibrate for consistent results. The later injection (red) shows less matrix eluting in the late stage of the chromatography than shown in earlier experiments, which is a result of decreased background with increased number of samples run and is not unusual.
 Figure 3. TIC overlay of two injections of the QC pool sample at injection 15 (blue) and injection 167 (red).
The region of interest that was selected for marker generation (blue square, Figure 3) excludes the early column equilibration and later washing steps. With the choice of column and gradient the cereal metabolites such as primary and secondary plant metabolites with lipophilic components like aromatic rings are to be expected to elute in the selected retention time region. Polar components of the grains were unlikely to be retained but could have been analysed with a different choice of chromatography such as HILIC methods.
As the sample preparation for this analysis was kept generic, excluding additional purification steps to avoid losing characteristic markers, the resulting matrix is complex which can pose challenges to LC-MS type analyses. However, the overall resolving power of the system is enhanced by the utilisation of UPLC separation compared to HPLC coupled to HRMS. The ACQUITY RDa Detector helps users to overcome typical matrix challenges and enables better chromatographic peak separation and accurate mass information resulting in higher peak capacity per run and high reproducibility to give confidence in -omics based data investigation.
2. Marker selection process
Following peak detection and marker generation in UNIFI, data can be automatically transferred to EZinfo for principal component analysis (PCA) model creation. The number of selected markers was restricted to eliminate unspecific compounds from equilibration/washing steps as well as compounds with low signal intensity (retention time 2-10 minutes and intensity count 5,000-500,000 while the mass range was kept at full range m/z 50-2000). Adjustment of marker settings excluding low abundance compounds as well as early and late eluting compounds resulted in a clearer group separation compared to when all eluting compounds in the sample were considered for PCA. This targeted -omics approach requires a certain amount of a priori knowledge of the chemical profile in the food sample and will deliberately bias the model but enables the user to spot the regions of difference and similarity more efficiently. Overall, this workflow allows novice users to take first steps in -omics approaches while being guided to generate meaningful results.
3. Unsupervised PCA models for species level identification [EZinfo]
The PCA resulted in an unsupervised separation between groups according to species. Beside the clear species-level discrimination of the samples, intragroup separation could also be observed depending on processing method, harvest time and farming as seen for wheat and oat samples in Figure 4. With this small sample size, differentiation of organic oats from conventional oats and oat feed was for example visible. To investigate and identify markers further, e. g. for organic farming, a bigger sample size would be required to validate these findings. Replicate injections of the QC pool sample were included at intervals throughout the course of the acquisition to characterise the technical variance of the analysis. The QC pool injections were found to cluster in very close proximity, indicating the technical variance of the overall system is low, highlighting the robustness of the system.
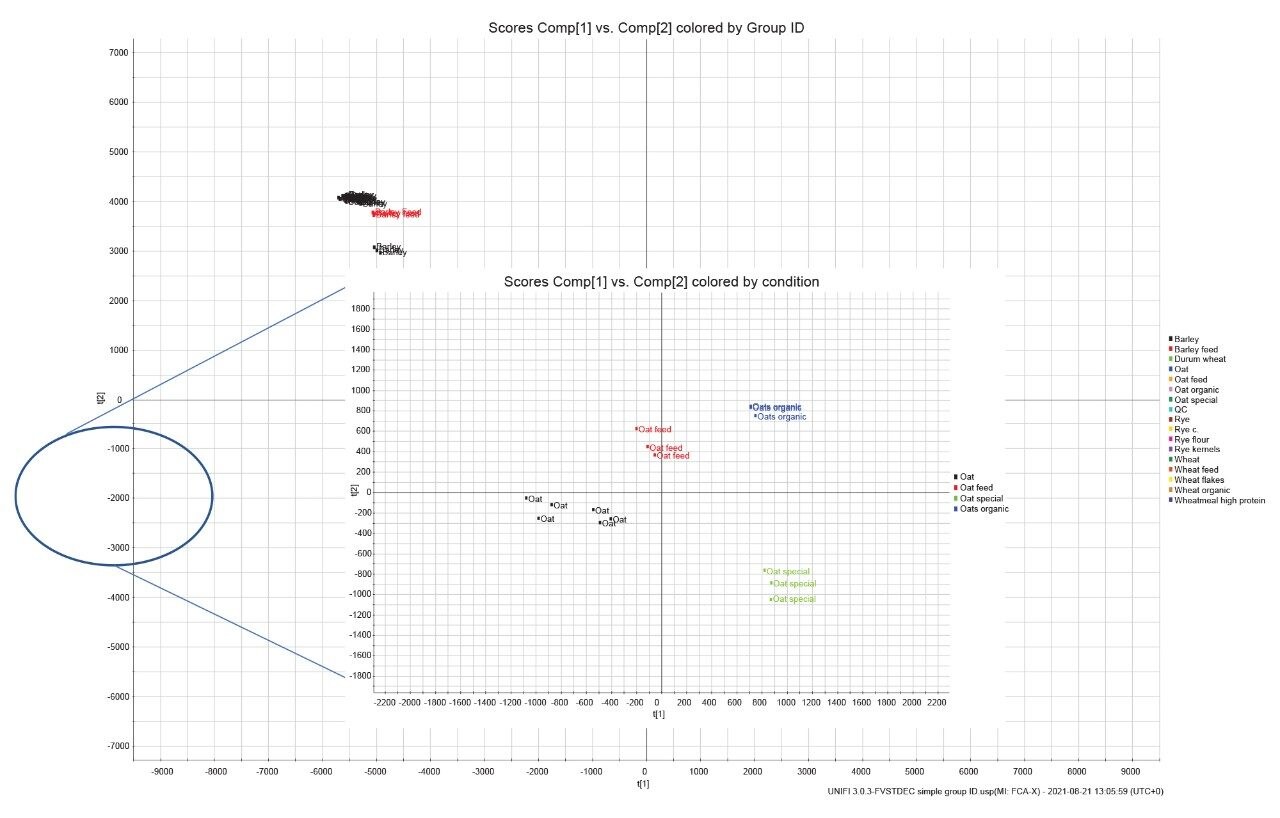 Figure 4. PCA scores plot in EZinfo of cereal samples and separate model with only oat samples (all samples injected in triplicate).
A further investigation of the same data is shown in Figure 5. High mass features seem to correlate with sample information provided about different groups like high and low protein content. Unique features in part C are picked out. This workflow enables users to focus on markers that are interesting. Markers can be traced from A to B to C, and the chosen marker can then be taken back into UNIFI and used as a candidate marker to screen the sample set or be used to screen similar sample sets.
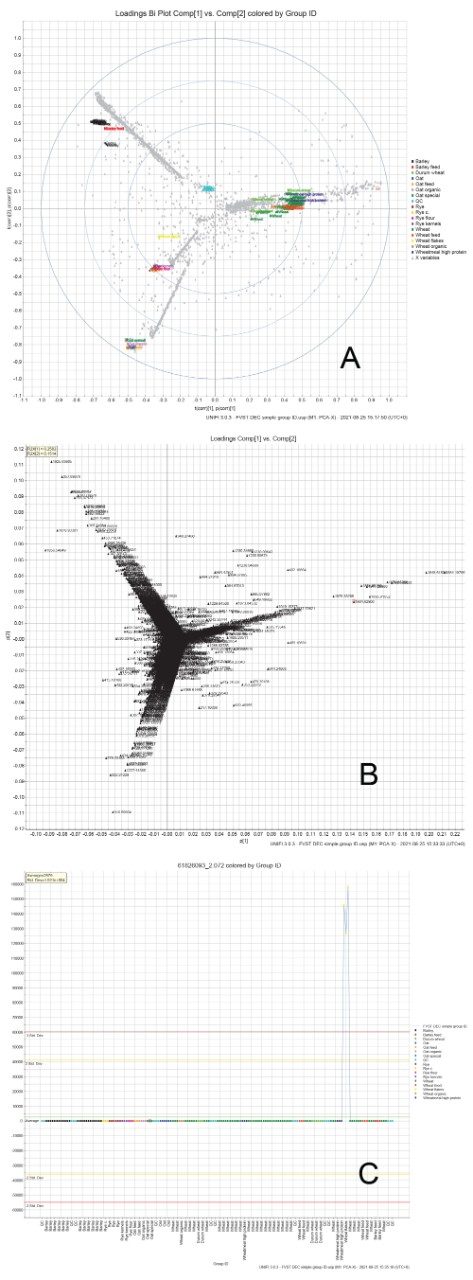 Figure 5. A: Loadings biplot, B: Loadings plot showing m/z which correlate with the groupings, C: Variable trend showing abundant ions according to the groups.
For food integrity testing, LC-MS profile data analysis is powerful for pattern recognition and the identification of changes in those patterns. It may not always be necessary to identify chemical markers by chemical structure in terms of assigning a compound name. When patterns are reproduceable and not subject to instrument variance, finding that there are differences from batch to batch is often sufficient knowledge for food manufacturers to evaluate production processes or ingredient batches. The isolation of markers of differentiation and the assignment of an accurate mass can also be used to gain insight into biological variance resulting from seasonal variations, cultivars, varieties or climatic conditions.
With accurate mass and fragment information from cone voltage fragmentation further marker investigation can be performed in UNIFI by processing for common neutral losses or common fragments to give analysts information about compound classes responsible for group separation like e.g. glucosides. Figure 6 shows the results of such advanced processing options as an example, resulting in losses of monosaccharides which would be expected in flour samples with high carbohydrate content in combination with the applied sample extraction procedure.
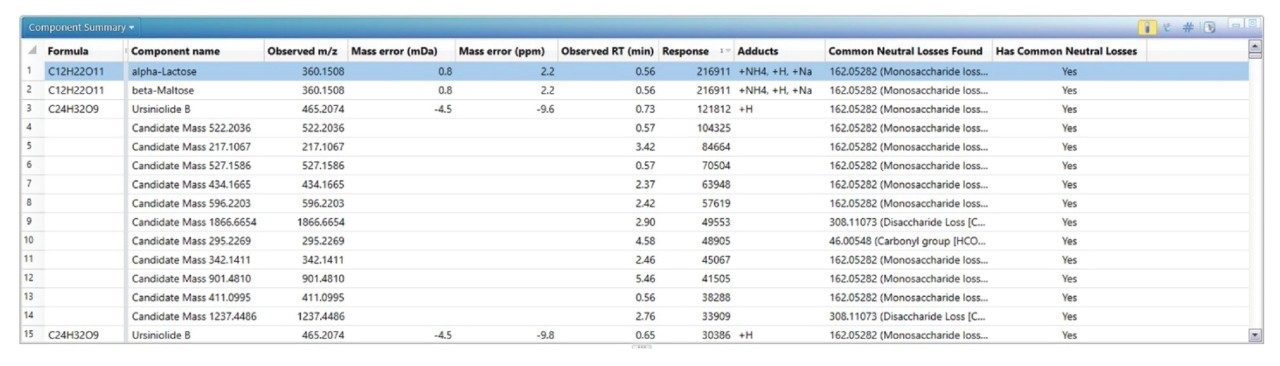 Figure 6. Component summary table of the UNIFI processing function for ‘Common Neutral Loss’.
4. Candidate marker selection and reproducibility
The combination of the untargeted acquisition mode and the multivariate statistical analysis has allowed for the selection of a group of candidate markers indicative of the species and type of grain in this example. Whilst chemical elucidation of the identity of candidate markers is not always a critical requirement for food QC analysis it is essential that the instrument platform is capable of reliably detecting the marker compounds with an acceptable level of precision (%RSD) across all injections during extended analysis periods. Figure 7 shows (a) the technical reproducibility (variation over four days) of the instrument monitoring the response of the standard reference compound imazalil and (b) the measured mass accuracy for imazalil over the same time period.
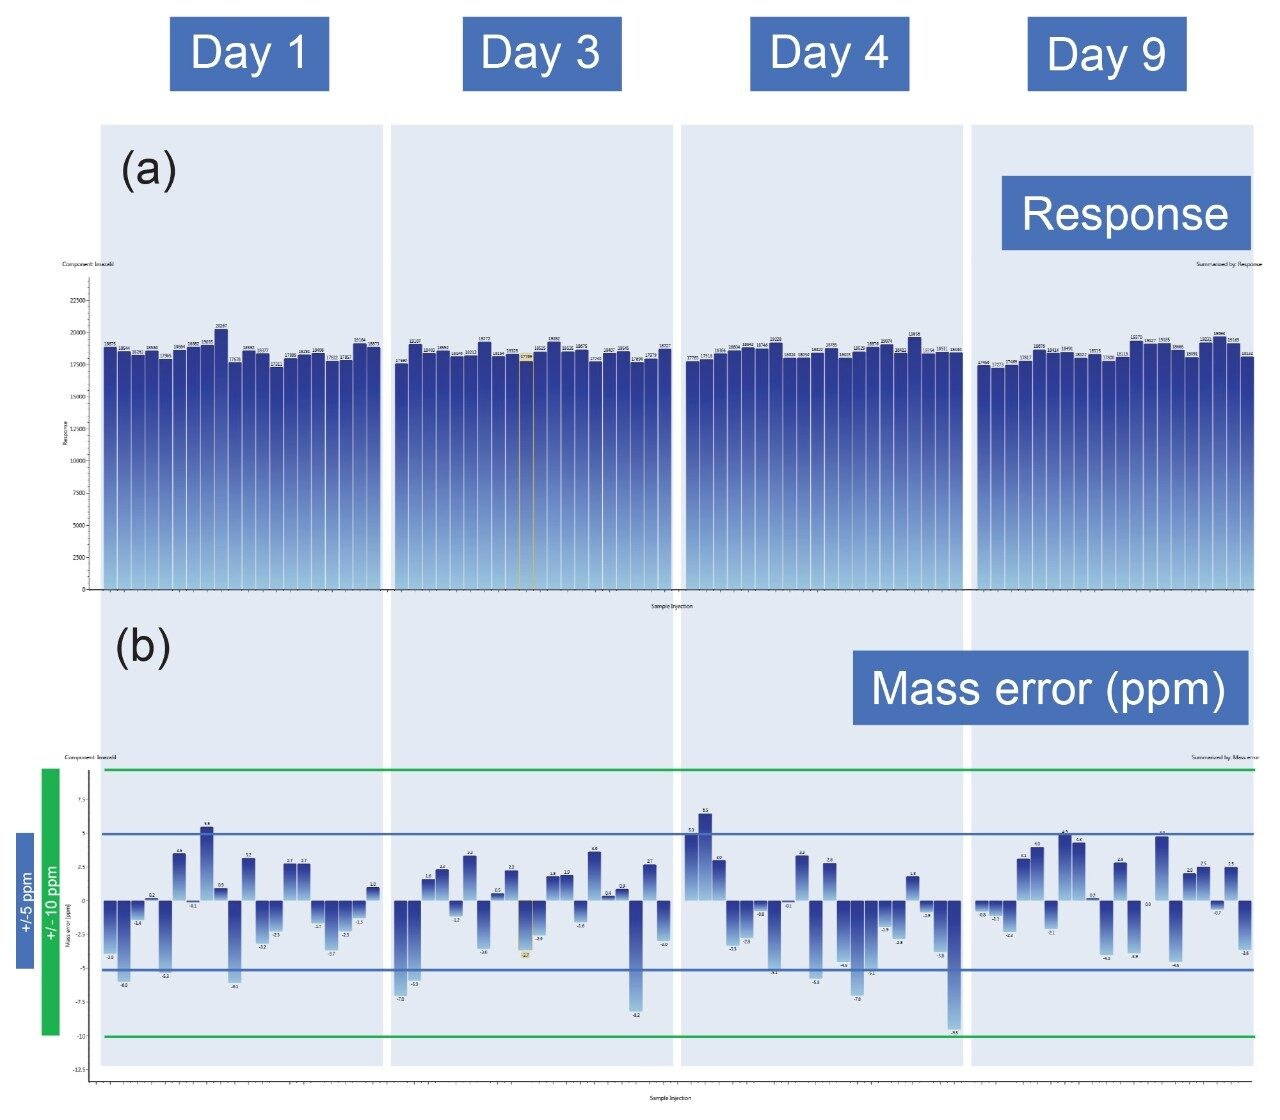 Figure 7. Response (a) and mass error illustration (b) of imazalil from a standard mixture (20 injections) on four different days modified from UNIFI (mass error areas of +/- 5 and +/- 10 ppm are marked with lines).
The results of the investigation of reproducibility are shown in Figure 7 and Table 4. On four different days spaced out over nine days, 20 injections were made from a freshly prepared standard, each time from the same frozen mix of food relevant compounds such as pesticides and mycotoxins, and responses and mass error values were evaluated. The mass errors and responses were converted to absolute values before calculating the standard deviation and average. The average mass error was 3.1 ppm with an RMS of 3.6 ppm and the majority of the results ranged in the area of +/-5 ppm which provides sufficient precision to investigate marker changes with multivariate analysis.
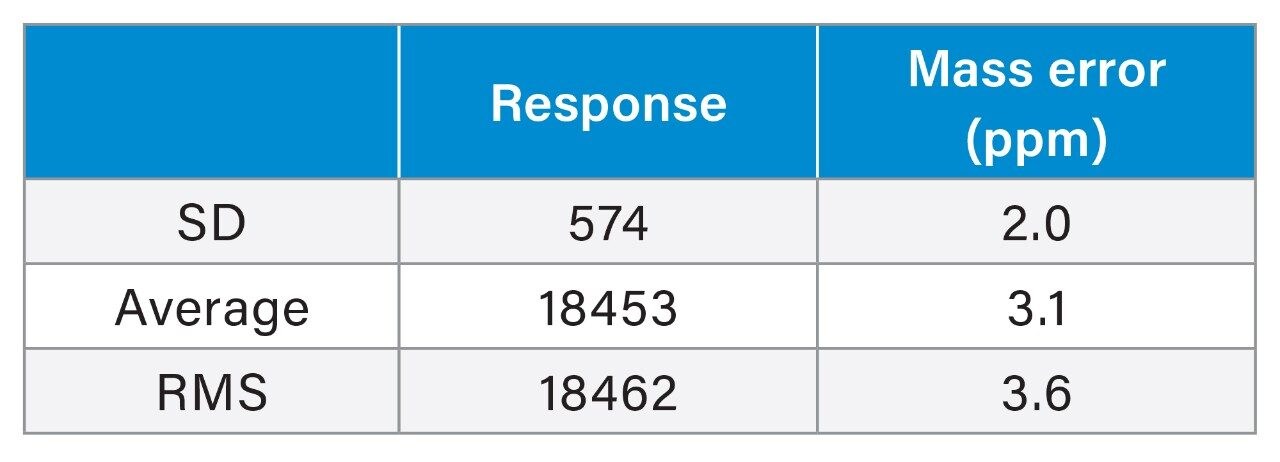 Table 4. Summary of robustness investigation for the compound imazalil as a performance example for the ACQUITY RDa Detector.
Conclusion
- The ACQUITY RDa Detector with the UNIFI application on waters_connect provides an integrated platform for data acquisition and processing supporting novice users taking first steps in metabolomic workflows.
- Cereal data was analyzed as a proof-of-principle and identification on species level as well as subgroups separation of different harvest times and growing conditions was achieved.
- Cone voltage fragmentation enables investigation of known common losses or other fragments to gather more information on unique marker compound classes.
- The multivariate statistical analysis functionality available in UNIFI/EZinfo has been employed to identify candidate markers of cereal species and type. UNIFI functionality allows the analyst to monitor both the biological and technical variability associated with the candidate marker selection.
- Robustness of the system lays the foundation for general metabolomics approaches.
- Within the food and beverage manufacturing sector, multivariate analysis is also deployed to investigate differences in production regimes, storage conditions and batch variations. The ACQUITY RDa Detector and the build in software packages fully support these omics-focused investigations.
Acknowledgements
The authors would like to thank Nicolai Zederkopff Ballin and Søren Johannesen from The Danish Veterinary and Food Administration for the supportive collaboration and discussions over the course of the project.
References
- Allergen Guidance for Food Businesses Food Standards Agency. [cited 2021 Aug 17] Available from: https://www.food.gov.uk/business-guidance/allergen-guidance-for-food-businesses .
- Black C et al. A Comprehensive Strategy to Detect the Fraudulent Adulteration of Herbs: The Oregano Approach. Food Chem. 2016 Nov 1;210:551–7.
- Gonzales G et al. Liquid Chromatography-Mass Spectrometry Coupled With Multivariate Analysis for the Characterization and Discrimination of Extractable and Nonextractable Polyphenols and Glucosinolates From Red Cabbage and Brussels Sprout Waste Streams. J Chromatogr A. 2015 Jul 10;1402:60–70.
- Reid L et al. Green Tea Screening Using the ACQUITY RDa Detector. Waters Application Note, 720007226, April 2021.
- Wang H et al. Untargeted Metabolomics Coupled With Chemometrics Approach for Xinyang Maojian Green Tea With Cultivar, Elevation and Processing Variations. Food Chem. 2021 Aug 1;352:129359.
- Arapitsas P et al. Use of Untargeted Liquid Chromatography-Mass Spectrometry Metabolome To Discriminate Italian Monovarietal Red Wines, Produced in Their Different Terroirs. J Agric Food Chem. 2020 Apr 20;68(47):13353–66.
- Mol H et al. Toward a Generic Extraction Method for Simultaneous Determination of Pesticides, Mycotoxins, Plant Toxins, and Veterinary Drugs in Feed and Food Matrixes. Anal Chem [Internet]. 2008 Dec 1;80(24):9450–9.
720007454, January 2022