Method Development of Proteolysis Targeting Chimera (PROTAC) Compound ARV-825 Forced Degradation Sample Using the Systematic Screening Protocol
Abstract
Forced degradation studies are one way to determine how a chemical compound can break down over time. Typically, a forced degradation study is a precursor to more rigorous stability testing which includes shelf-life testing. Forced degradation studies are therefore critical aspects of new drug development, especially in the later stages before release of the compound for wide-spread use. As with most studies like this, the use of liquid chromatography mass spectrometry (LC-MS) is vital as it can provide not only sufficient separation of the peaks but also allows for identification by mass, which is more accurate and reliable than identification by UV absorption only.
The work shown examines the forced degradation of a Proteolysis Targeting Chimera (PROTAC) molecule, ARV-825, which readily degrades BRD4 proteins limiting cancer growth. Some studies have shown its utility for treating thyroid carcinoma, acute lymphoblastic leukemia, and neuroblastoma.1–3 This compound, along with other PROTAC drugs, degrades target proteins instead of inhibiting them. This increases not only their efficacy but also their sensitivity. While inhibitors have shown to be effective in a variety of situations, it is becoming more, and more clear that PROTACs have the potential to become a more suitable option moving forward as they allow more targeted, and effective treatment.4
Benefits
- Fast method development using the systematic screening protocol
- Baseline resolution of all detected degradants and ARV-825 main peak
- Improved peak area reproducibility using MaxPeak™ Premier Columns compared to standard column hardware
Introduction
A new class of compounds, PROTACs were introduced in 2001 by Sakamoto et al.5–6 These compounds are heterobifunctional molecules which contain two active sites or domains linked together, such as polyethylene glycol. They work by binding to and degrading certain proteins, with the activity being driven by one or both of the active sites of the molecule. This allows the PROTAC to not only prevent that protein from being expressed, but also allows the chemist to selectively target different types of proteins by modifying the PROTAC molecule. For instance, the PROTAC studied in this application note, ARV-825, is used to treat leukemia among other cancers by targeting BRD4 gene containing proteins.
While not a new compound class, PROTACs have been gaining more and more notoriety as potential treatments for cancer. While more work is still needed and is being done to determine the actual benefit of these compounds, eventually the first PROTACs will be approved for patient use. This means that understanding compound stability and potential degradants will be necessary. Prior to release, understanding the degradation of the compound and identifying its degradants is important to ensure that no degradant is harmful to patients. This assessment is usually done in two or three ways. First, there are pharmacokinetic studies which assess how the body reacts to the drug over the entire course of exposure. Part of this process includes monitoring for metabolites of the drug that have been broken down by bodily functions. This can prove problematic however, especially if no other testing is done as the body could break down the compound into something hazardous, harming the patient. The second way is stability studies, which include but is not limited to storing the compound in typical packaging, i.e. a vial, and allowing it to sit for an extended period of time to determine “shelf life”. This can take a considerable amount of time as the conditions are not typically accelerated. The last way to assess degradation of a compound is to do a forced degradation study using accelerated conditions like high temperature and exposure to certain catalysts. ICH guidelines and FDA requirements exist and can be followed for all forced degradation studies eliminating the potential ambiguity in the experimental design.
Forced degradation studies have been well documented as viable workflows for determining compound stability and assessing potential hazards from the degradants. Typically, the compound or formulation is exposed to a variety of test conditions, including but not limited to acidic hydrolysis, basic hydrolysis, dry heat, and UV light exposure. The conditions are such that degradation of the compound can occur rapidly, depending on the stability of the compound. Full degradation of the active pharmaceutical ingredient (API) is not recommended as it is important to achieve separation between the API and any degradants found. This is where method development processes and use of liquid chromatography-mass spectrometry (LC-MS) is beneficial. By designing an appropriate LC method, full separation of the API, and degradants can be achieved, allowing detection via UV or MS depending on the component. The use of MS for peak tracking is immensely helpful during method development especially when standards of the degradants are not readily available for injection.
Another technology that has become increasingly helpful for method development activities is MaxPeak High-Performance Surfaces (HPS) Column hardware. This hardware is specifically designed to eliminate any possible interaction between the metal of the column or LC system and the compounds being analyzed. This is achieved by bonding a hybrid organic-inorganic layer to the surface of the metal hardware.7–8 MaxPeak Premier Columns, manufactured with MaxPeak HPS, have been shown to not only improve LC-MS sensitivity, but also improve LC method reproducibility by improving signal and eliminating the secondary interactions between metal surface and analytes.9–12 By using MaxPeak Premier Columns for method development activities, an analyst can reduce the risk in their analysis and know that the results are accurate and reliable the first time.
In this application note, a forced degradation study for the PROTAC ARV-825 was performed and a method for the resulting sample was developed. To streamline the method development process, the well-documented systematic screening protocol was used.13–16 This approach to method development uses a tiered screening system that eliminates the ambiguity of method development and allows for full traceability of the method development process. Combining this simplified approach to method development with MaxPeak Premier Columns, methods can be developed faster and more reliably, allowing methods to be implemented faster and freeing up time for more challenging tasks.
Experimental
Sample Description
A 1 mg/mL stock solution of orlistat was created using 71:29 acetonitrile:water. Forced degradation took place in three separate vials. For each vial, 1 mL of stock solution was added. For degradation, all samples were heated at 70 °C. For acid and base hydrolysis, 100 µL of 1 N HCl or 1 N NaOH was added. For thermal degradation, 100 µL of sample diluent was added. After allowing samples to sit at temperature for two hours, all three vials were combined to not only quench the acid and base degradation, but also to combine all degradants into a single sample. The sample was then analyzed, and degradants tracked by mass using the ACQUITY™ QDa Mass Detector.
LC Conditions
|
LC system: |
ACQUITY UPLC™ H-Class Plus System with Quaternary Solvent Manager (QSM) with optional solvent select valve, Sample Manager Flow Through Needle (SM-FTN), Column Manager, Two Column Manager Auxs, and QDa Mass Detector |
|
Detection: |
MS full scan (ESI+) SIRs of degradants and API used as indicated |
|
Columns: |
ACQUITY™ Premier BEH™ C18, 2.1 x 50 mm, 1.7 µm (p/n: 186009452) ACQUITY Premier CSH™ Phenyl-Hexyl, 2.1 x 50 mm, 1.7 µm (p/n: 186009474) ACQUITY Premier HSS PFP, 2.1 x 50 mm, 1.8 µm (p/n: 186010036) ACQUITY Premier HSS T3, 2.1 x 50 mm, 1.8 µm (p/n: 186009467) ACQUITY Premier BEH Shield RP18, 2.1 x 50 mm, 1.7 µm (p/n: 186009497) ACQUITY Premier BEH C18 AX, 2.1 x 50 mm, 1.7 µm (p/n: 186009366) ACQUITY UPLC HSS T3, 2.1 x 50 mm, 1.8 µm (p/n: 186003538) |
|
Column temperature: |
30 °C |
|
Sample temperature: |
10 °C |
|
Injection volume: |
1.0 µL |
|
Flow rate: |
0.50 mL/min |
|
Mobile phase A: |
Milli-Q Water |
|
Mobile phase B: |
Acetonitrile |
|
Mobile phase C: |
Methanol |
|
Mobile phase D1: |
2% Formic acid in water |
|
Mobile phase D6: |
200 mM Ammonium hydroxide in water |
|
Screening gradient conditions: |
Constant 5% Dx maintained throughout gradient. Linear gradient of 5–95% B/C in 6.86 minutes, hold for 1.14 minutes. Return to 5% B/C and hold for 2.3 minutes. Total run time: 10.30 minutes. |
Data Management
|
Chromatography software: |
Empower™ 3 Feature Release 4 |
Results and Discussion
Proteolysis Targeting Chimeras (PROTACs) are heterobifunctional molecules which act by degrading specific proteins. During manufacturing and design of these molecules specific proteins can be targeted based on their genetic makeup. For instance, some PROTACs are designed to work on BRD4 gene containing proteins, like the compound ARV-825 shown in Figure 1. As a part of design and development, apart from the typical efficacy testing, and pharmacokinetic studies, it is important to understand the stability of the compound in a non-biological system. This is critical for understanding shelf life, as well as monitoring degradation as a part of manufacturing. To assess stability, a forced degradation study is employed.
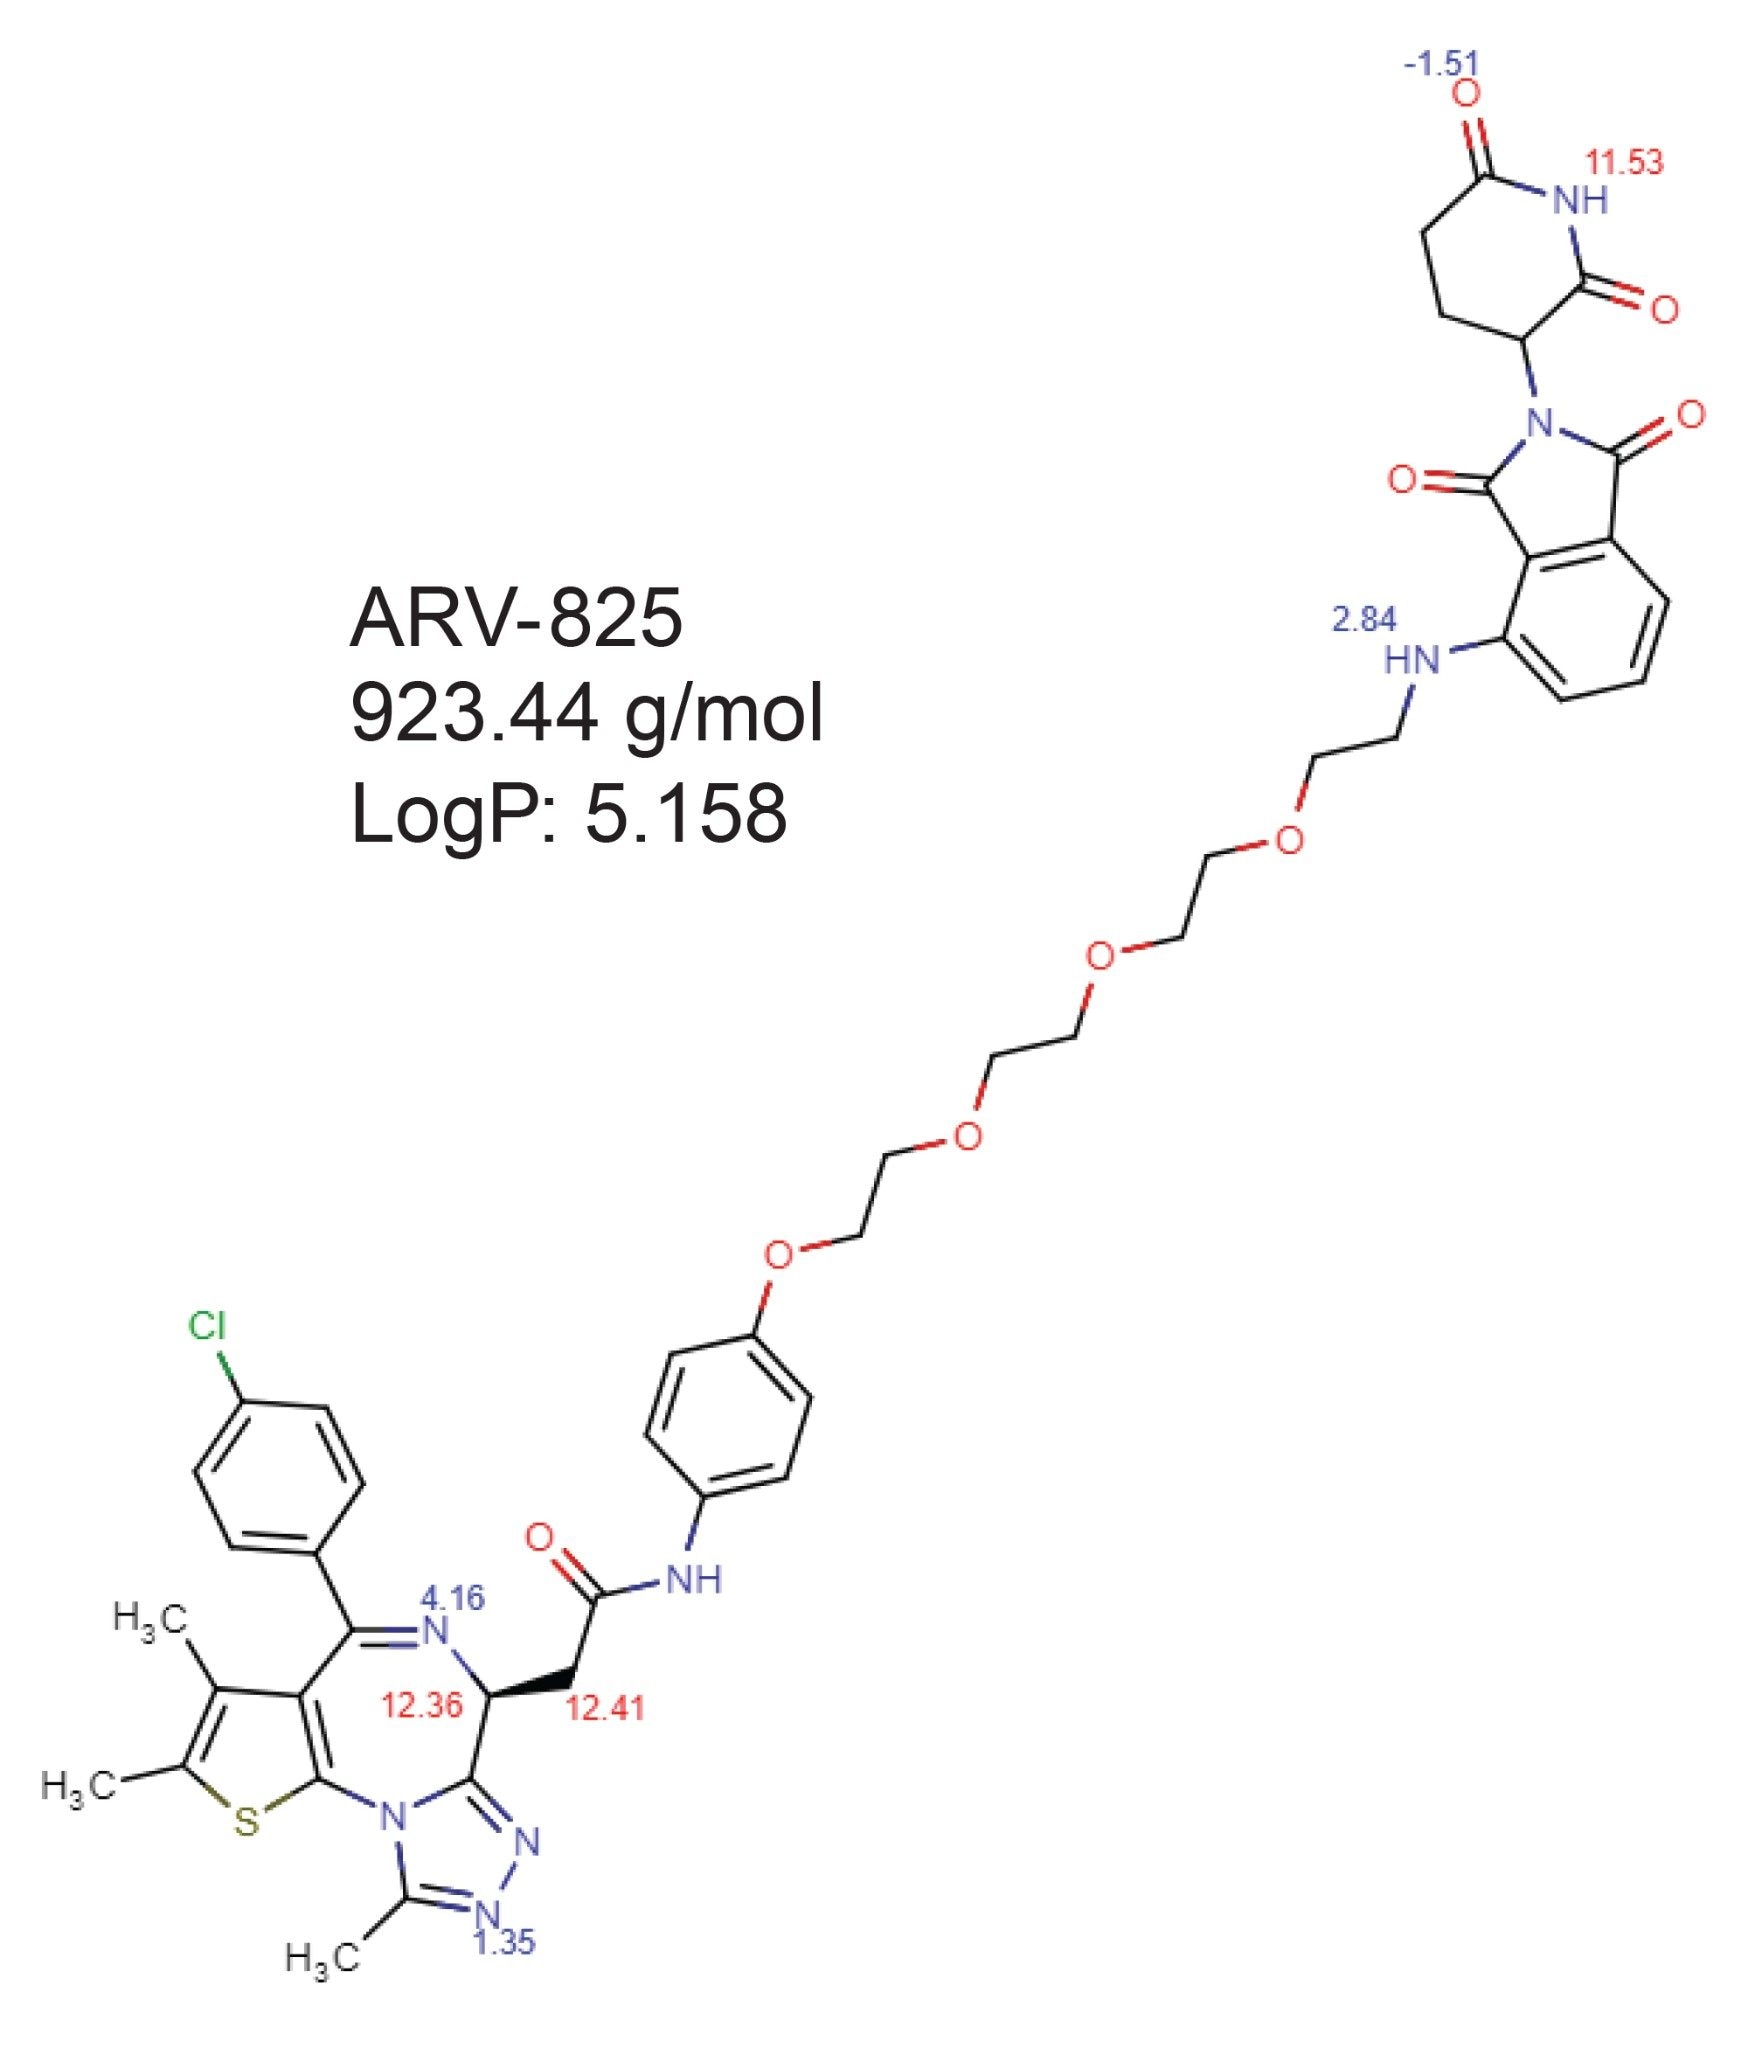 Figure 1. Chemical structure of ARV-825 including molecular mass and cLogP value.
ARV-825 contains a pomalidomide and a birabresib linked with polyethylene glycol. This compound has been shown to treat thyroid carcinoma, acute lymphoblastic leukemia, and neuroblastoma. Forced degradation of this compound was performed following typical guidance form literature sources.17 For this work, during initial screening of stressed conditions the testing was halted when the active pharmaceutical ingredient was degraded 20% from original as measured by peak area compared to a control stock solution. Initial screening of forced degradation samples is shown in Figure 2 and the conditions listed in the experimental section.
 Figure 2. Initial screening of forced degradation samples.
Initial results showed that acidic hydrolysis, base hydrolysis, thermal degradation, and peroxide degradation all produced new peaks and ~20% degradation of the API. Photolytic degradation did not produce any degradation over 24 hours at room temperature. For method development the acidic and basic hydrolysis samples, the thermal degradation sample, and peroxide degradation samples were combined into a single sample for analysis.
Utilizing the combined sample, the systematic screening protocol was used to develop a suitable method. The first step of the systematic screening protocol is to assess retention at high and low pH. For this step, UV analysis was used as peak identification and tracking was not needed. The objective of this step is to determine at what mobile phase pH the retention is best, which often tracks with pKa values of the compounds. For degradants with unknown chemical structures and properties, this step is critical to ensure good retention. Figure 3 shows the screening of the combined degraded sample at high pH using ammonium hydroxide additive, and low pH using formic acid additive.
 Figure 3. Step 1 of the systematic screening protocol: Assessing analyte retention with high and low pH additives using an ACQUITY Premier BEH C18 Column and acetonitrile strong solvent. ARV-825 (peak A) labelled.
Low pH shows better retention of the low-level degradants than high pH, while the main ARV-825 peak is relatively unaffected by pH change. This lack of retention change with the different pHs indicates that the charge state of the compound does not change at the pHs tested. However, since the degradants are more retained at low pH, formic acid additive is selected for further testing. It is important to determine which additive is needed for analysis as it informs column selections for the next step. At high pH for instance, some columns cannot be used due to the poor stability of the base particle at elevated pHs. Silica based particles are susceptible to base hydrolysis of the silica causing voiding of the packed bed as the silica particle dissolves. At low pH however, most silica columns are quite stable.
When choosing columns to test, apart from pH stability, it is important to choose a diverse panel of columns with a wide range of selectivities. The panel of columns chosen is also driven by instrument configuration or testing needs. For instance, if a system can accommodate four columns, then selecting four columns is prudent. However, for systems that can only hold one column, it is important to factor in the need to switch columns manually in the decision-making process. Manually switching out a column three to four times can drastically increase development time. In this example, an H-Class Plus System with six column positions was used. This allows maximum flexibility in method development. Additionally, this system uses the optional solvent select valve in the pump, allowing an analyst to load all needed solvents onto the system at the beginning of testing, eliminating the need to replace solvents and reprime.
Given the configuration of the system, six columns were chosen for screening. First the ACQUITY Premier BEH C18 Column was chosen. It was used previously during pH screening, as it is a very stable stationary phase that is used quite extensively to great success. The next column selected was the ACQUITY Premier CSH Phenyl-Hexyl Column. This column employs a Charged Surface Hybrid (CSH) particle which has similar properties to that of the BEH particle, but with a slight addition. The CSH particle is manufactured with a slight positive charge on the particle. This improves peak shape for bases when using low pH mobile phase additives like formic acid, while also providing potential ion exchange mechanisms. The bonded phenyl-hexyl ligand is unique in that it can retain compounds through typical reversed-phase mechanisms but also through π-π interactions with other aromatic compounds when methanol mobile phases are used. This makes the CSH Phenyl-Hexyl stationary phase a good option for method development panels. Next the High Strength Silica (HSS) PFP stationary phase was selected. Unlike the previous two columns, the HSS particle is pure silica which boasts higher silanol activity on the surface of the particle. This can drive increases in retention, especially when coupled with certain bonded ligands. The PFP ligand, a pentafluorophenyl compound, further drives selectivity. Like the phenyl-hexyl ligand, the PFP can retain analytes through π-π interactions but also other secondary interactions like hydrogen bonding. While these secondary interactions may not be dominant, they can still drive different retention for compounds depending on their properties.
The fourth column used was the ACQUITY Premier HSS T3 Column, which uses the highly retentive HSS particle and a mid-coverage C18 bonded ligand. This lower coverage ligand allows the column to be used with 100% aqueous mobile phases, improving retention for polar analytes. An ACQUITY Premier BEH Shield RP18 Column was selected as the fifth column as it uses the BEH particle with an embedded polar group ligand chemistry. This polar group, a carbamate, is embedded in a straight carbon chain ligand. This provides unique peak shape for basic analytes at low pH by limiting the interaction between the charged analytes and the silanols on the surface of the particle. Additionally, for some compounds, differences in retentivity and selectivity can be seen as well. Lastly, an ACQUITY Premier BEH C18 AX Column was used. Like the previous columns, the BEH particle is used here. However, this column uses a mid-coverage C18 ligand, and a proprietary anion exchange functional group to drive retention for acidic probes, specifically small polar acids. This final panel of six columns is well designed with maximum selectivities to find the best possible separation for the sample.
The systematic screening protocol’s next step is to screen the panel of columns selected above, using the pH additive selected in step 1, with either acetonitrile or methanol mobile phases. The objective of this step is to find the best combination of strong solvent and stationary phase to separate the analytes. While ideally, this step will produce a suitable method, optimization of the best conditions may be needed. Figure 4 shows the results of column screening with methanol mobile phases.
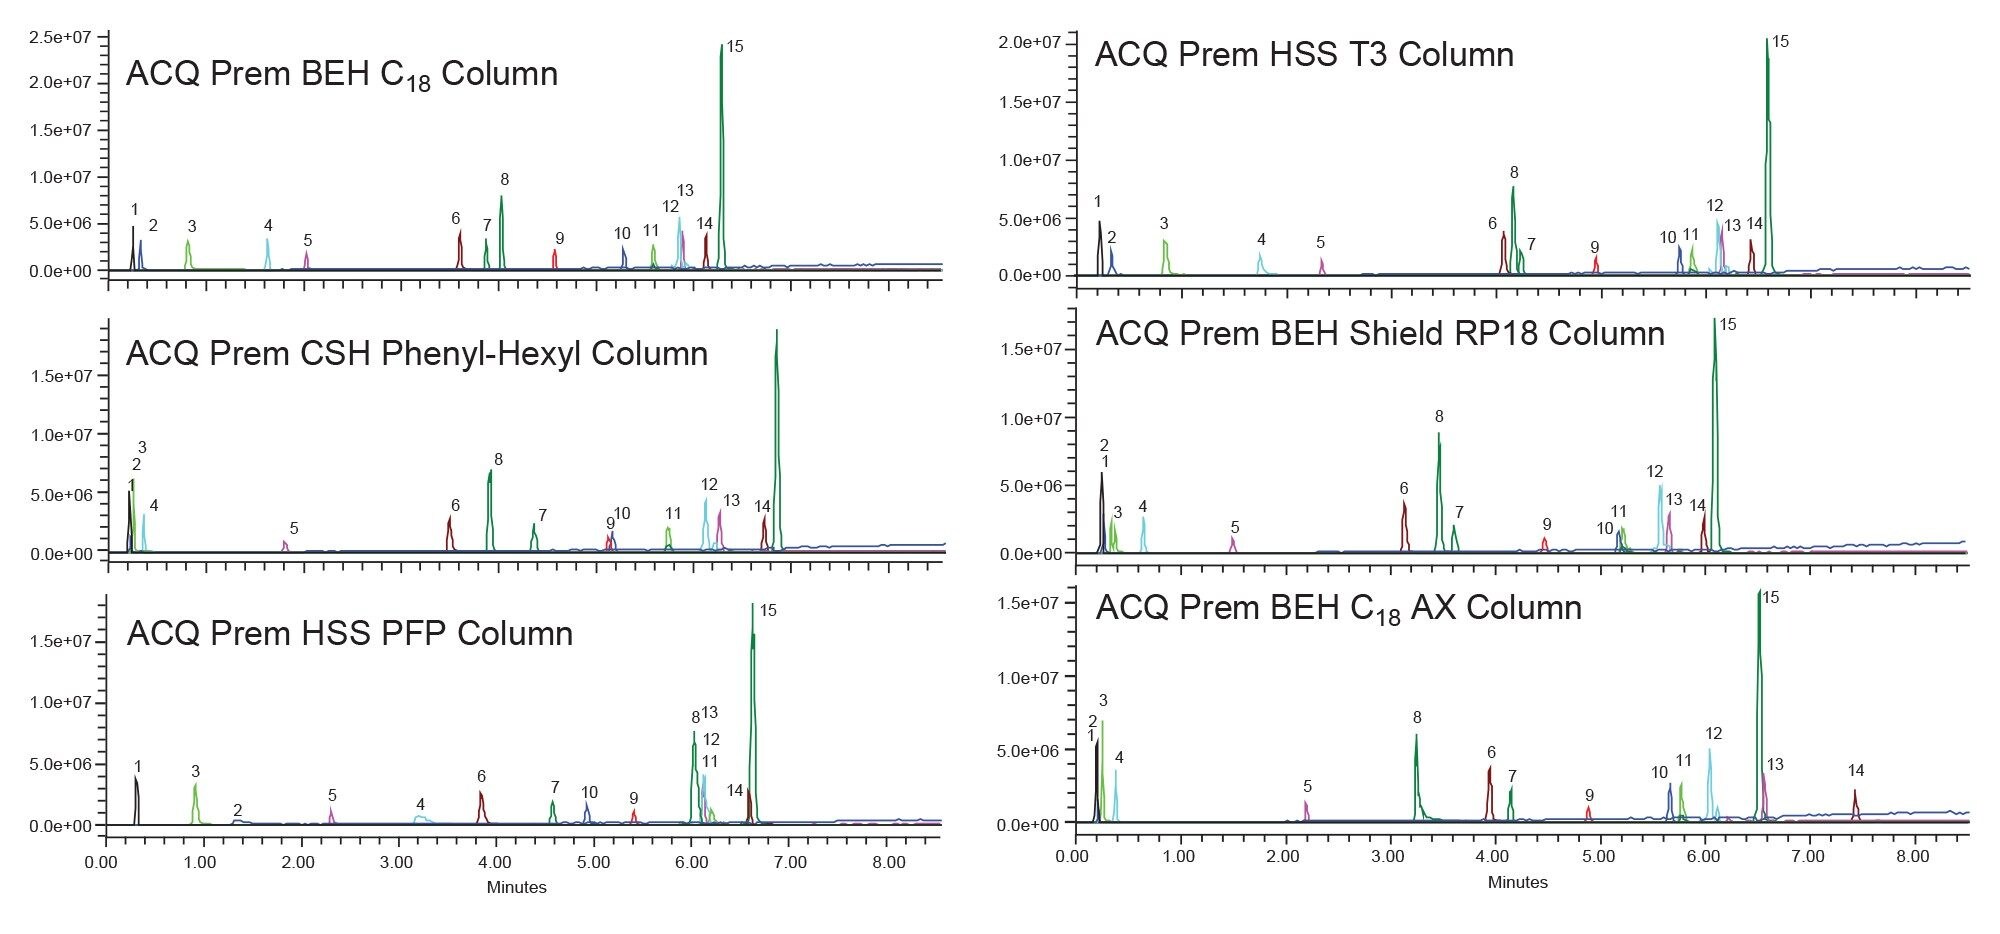 Figure 4. Column screening results using the six columns with formic acid modified methanol mobile phases. ACQUITY (ACQ) Premier (Prem) Column names abbreviated for design reasons. Peaks identified by mass using the ACQUITY QDa. 1) 226.9 m/z, 2) 102.0 m/z, 3) 100.0 m/z, 4) 155.1 m/z, 5) 115.9 m/z, 6) 171.9 m/z, 7) 450.1 m/z, 8) 639.2 m/z, 9) 583.1 m/z, 10) 225.2 m/z, 11) 428.1 m/z, 12) 624.1 m/z, 13) 682.1 m/z, 14) 829.2 m/z, 15) 923.3 m/z (ARV-825).
Using methanol mobile phases, the columns do provide differing selectivity for some compounds. For instance, on the ACQUITY Premier BEH C18 Column, components 12 and 13 co-elute, but these same compounds are resolved on the ACQUITY Premier CSH Phenyl-Hexyl Column. Component 4, which has a mass of 155.1 m/z shows the most difference in selectivity across the columns. It elutes around 1.5 minutes on the BEH C18 stationary phase, near the void when analyzed with the CSH Phenyl-Hexyl material and elutes after three minutes with poor peak shape when the HSS PFP stationary phase is used. Similarly, the HSS T3 material shows some peak tailing for this peak, while the BEH Shield material and BEH C18 AX material shows poor retention. From these results we can reasonably conclude that this analyte has some basic functionality, as the two HSS particles show poor peak shape, a common symptom of interaction between basic probes and the high silanol activity of the particle. Additionally, the CSH column showed the lowest retention, which can happen due to the repulsive effect that the positively charged base particle can have on basic probes. Screening multiple columns and analyzing the results can provide some real insights into the chemical properties of unknown compounds, as different analytes will interact with the stationary phases in different ways. For this sample, a suitable method is not found with methanol mobile phases. Figure 5 shows the same six columns using acetonitrile mobile phases.
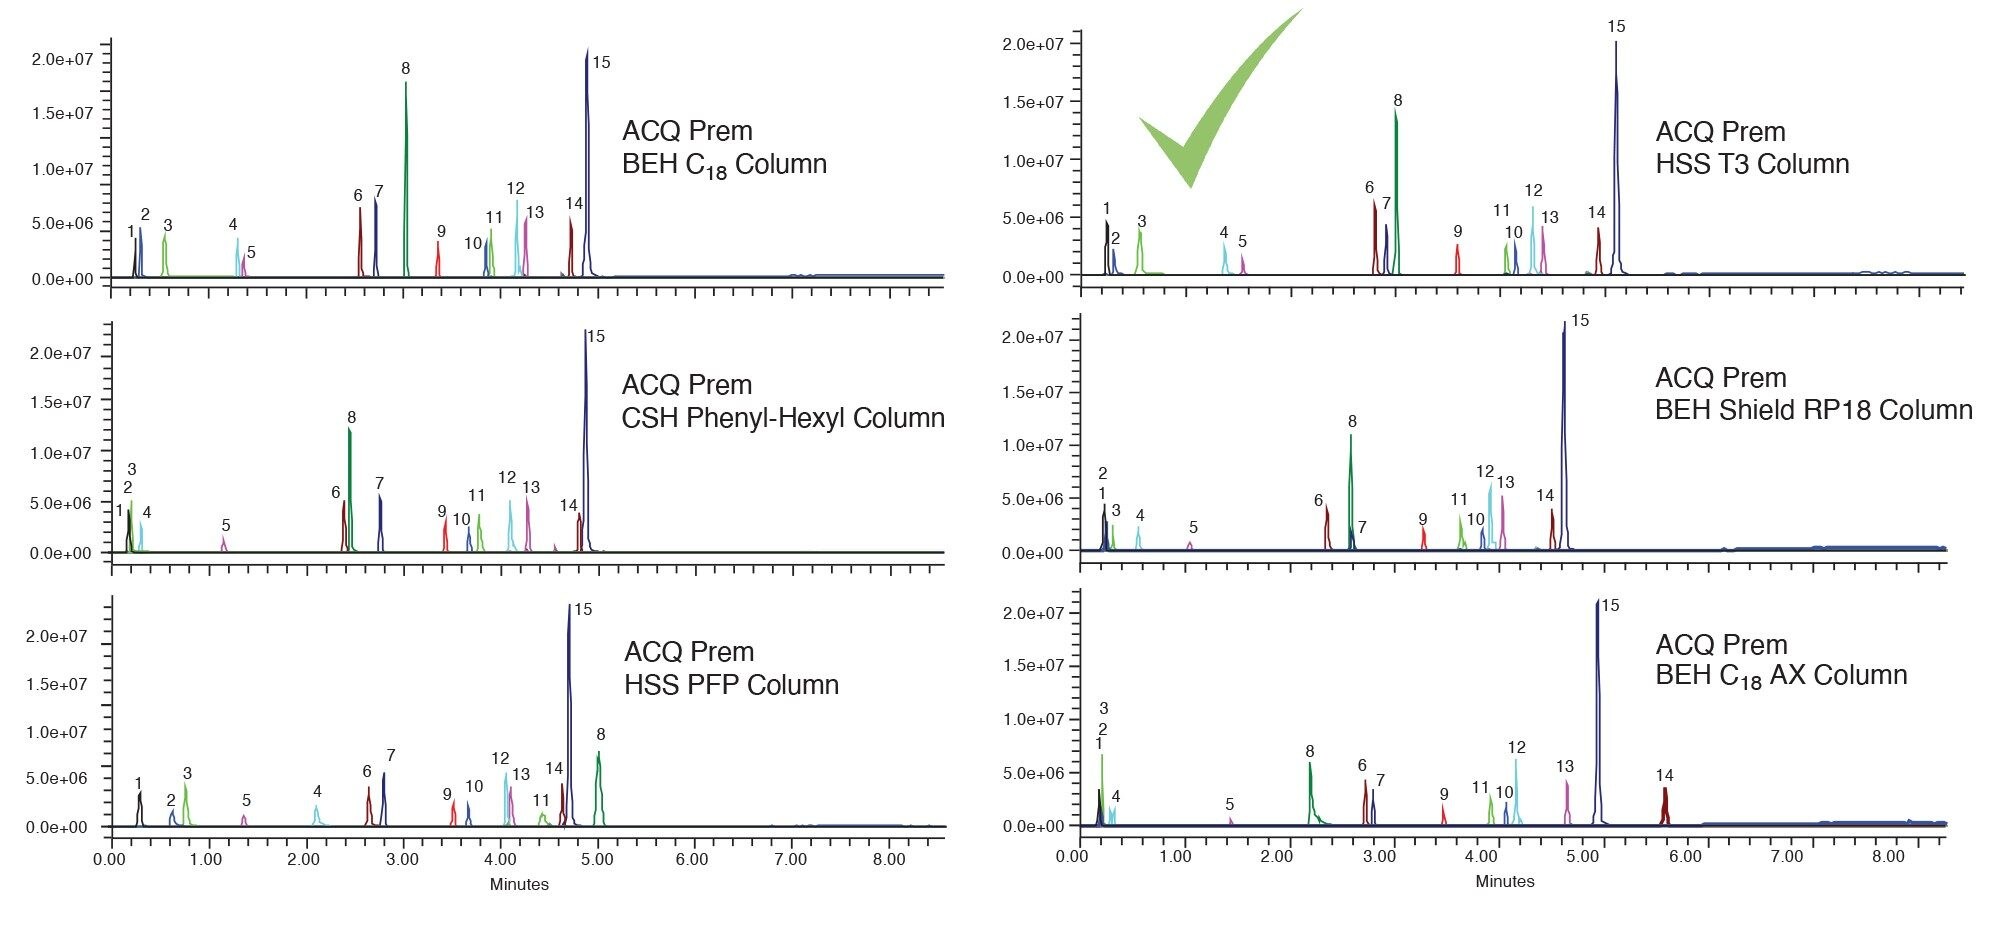 Figure 5. Column screening results using the six columns with formic acid modified acetonitrile mobile phases. ACQUITY (ACQ) Premier (Prem) Column names abbreviated for design reasons. Peaks identified by mass using the ACQUITY QDa. 1) 226.9 m/z, 2) 102.0 m/z, 3) 100.0 m/z, 4) 155.1 m/z, 5) 115.9 m/z, 6) 171.9 m/z, 7) 450.1 m/z, 8) 639.2 m/z, 9) 583.1 m/z, 10) 225.2 m/z, 11) 428.1 m/z, 12) 624.1 m/z, 13) 682.1 m/z, 14) 829.2 m/z, 15) 923.3 m/z (ARV-825).
Acetonitrile mobile phases show similar results as methanol. Several groups of co-eluting compounds can be seen across the columns, along with poor retention on some columns for components 1–4. The only material which shows good retention for the early eluting peaks, while also achieving good separation for the later eluting analytes is the ACQUITY Premier HSS T3 Column. While not perfect, this set of conditions was selected for further optimization. Figure 6 shows the selected conditions in a larger scale.
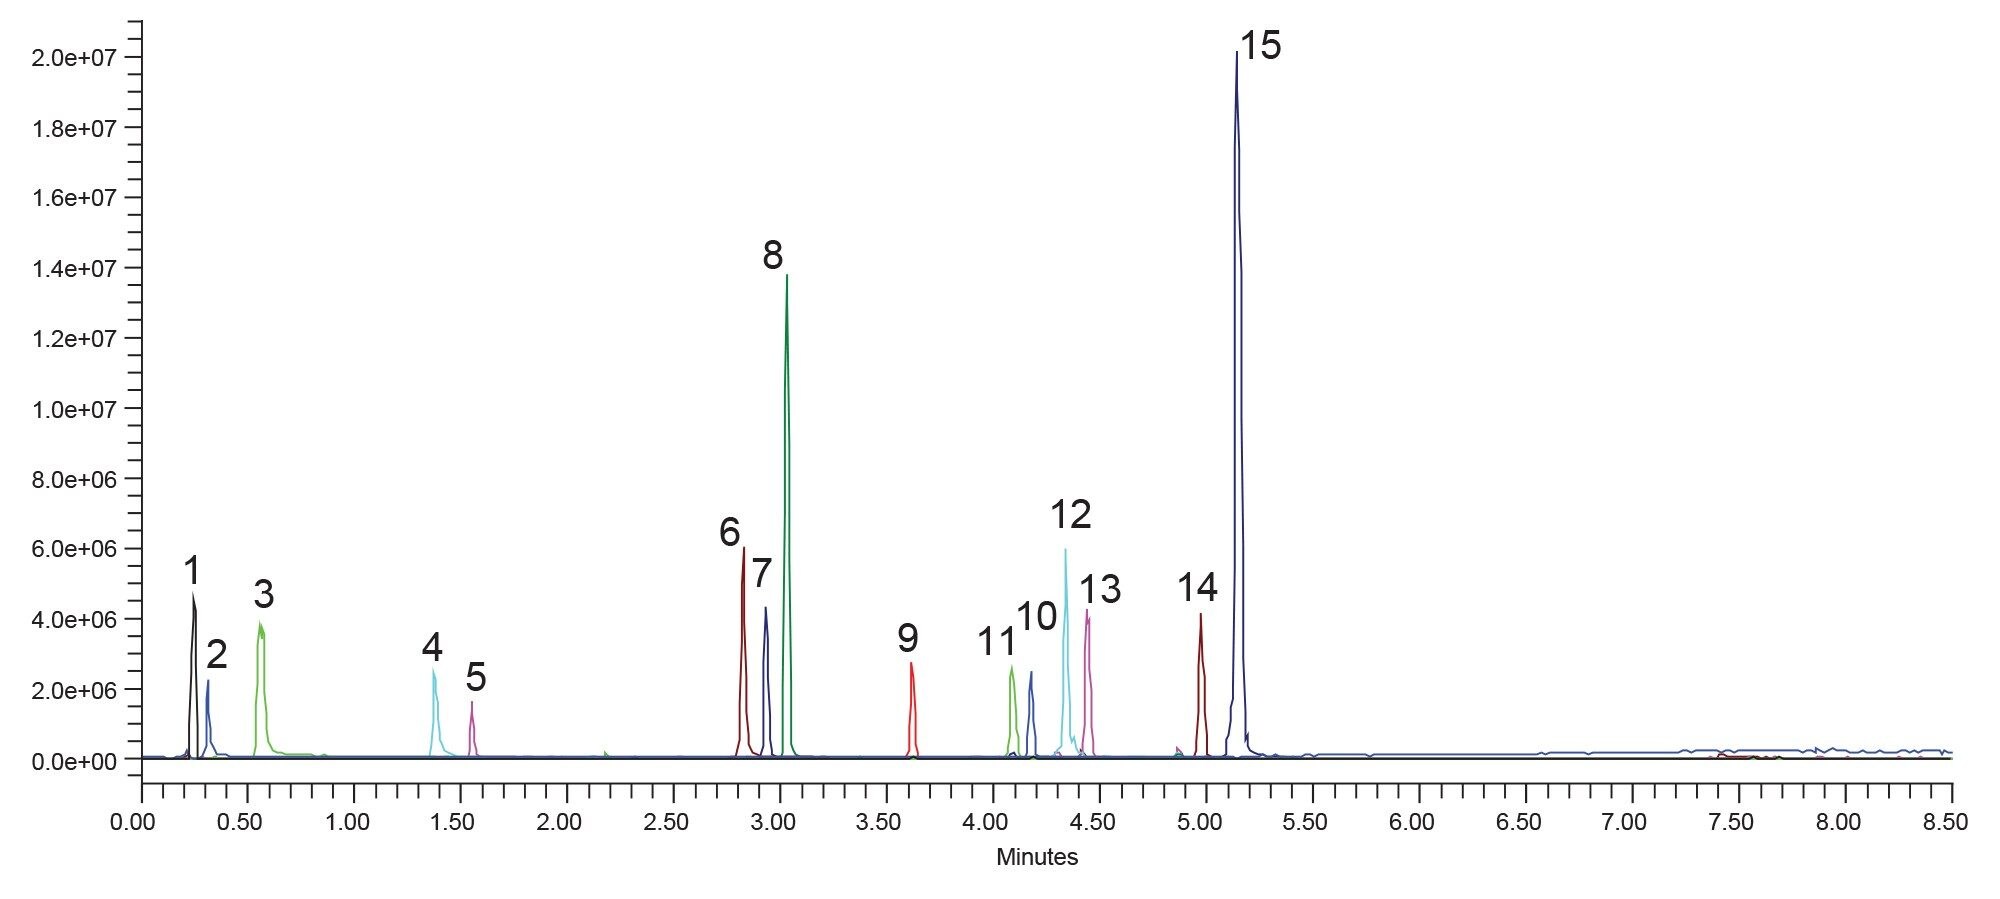 Figure 6. Separation of forced degradation sample using an ACQUITY Premier HSS T3 Column, with formic acid modified acetonitrile mobile phases. Peaks identified by mass using the ACQUITY QDa. 1) 226.9 m/z, 2) 102.0 m/z, 3) 100.0 m/z, 4) 155.1 m/z, 5) 115.9 m/z, 6) 171.9 m/z, 7) 450.1 m/z, 8) 639.2 m/z, 9) 583.1 m/z, 10) 225.2 m/z, 11) 428.1 m/z, 12) 624.1 m/z, 13) 682.1 m/z, 14) 829.2 m/z, 15) 923.3 m/z (ARV-825).
The optimization of this separation only requires improving the retention for components one and two which are eluting very early or in the void. This is not ideal as early eluting peaks are more susceptible to sample diluent effects and interference from undesired sample matrix. Improving retention while still achieving adequate separation of the later eluting compounds is the goal for optimization and was achieved by starting the gradient at 0% organic mobile phase and maintaining the same gradient slope as was used in the screening. This should increase the retention of the early eluting compounds, while keeping the other peaks well resolved. At the same time, the gradient endpoint can be adjusted to improve cycle time of the separation. By using the screening gradient and calculating the percent organic needed to elute the ARV-825 peak (15) the new endpoint of the gradient was determined to be 70% acetonitrile. Figure 7 shows the separation of the sample using both the original screening gradient and the optimized gradient.
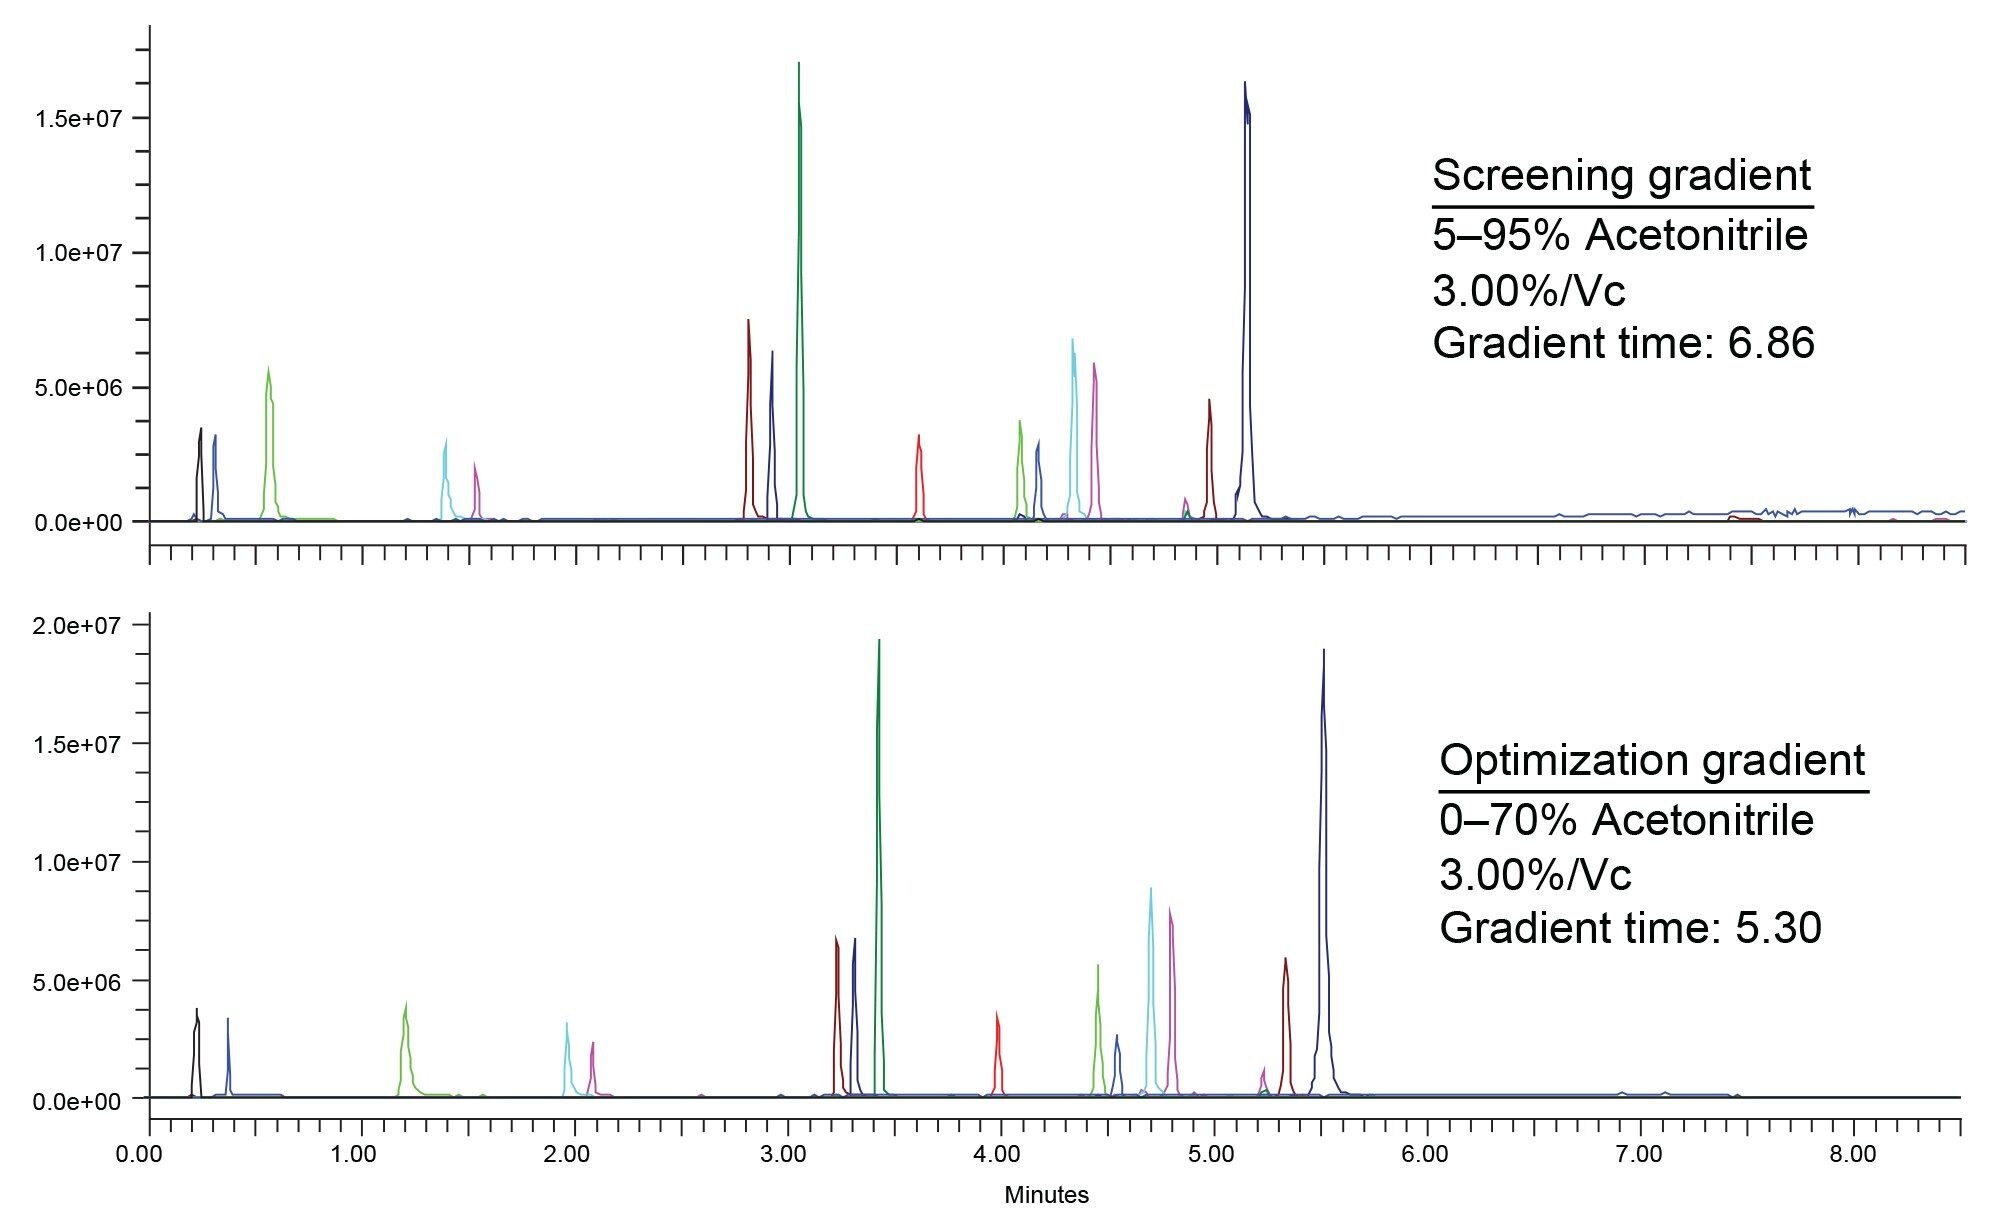 Figure 7. Separation of forced degradation sample using the initial screening gradient of 5–95% organic and the optimized method using 0–70% organic. Gradient times and gradient slope are shown. Peaks identified by mass using the ACQUITY QDa.
The new gradient was able to retain the early eluting compounds without sacrificing resolution of the later eluting compounds. Additionally, the gradient time was reduced from 6.86 minutes to 5.30 minutes, saving 1.56 minutes from the total run time. With these improvements realized, the method can now be moved into a QC environment or used for further work such as validation.
As mentioned earlier, MaxPeak Premier Columns were selected for this work because the characteristics of the degradants were unknown and therefore, we chose to reduce risk from metal/surface interactions. By mitigating that risk early in the process, we eliminated the need for re-work. However, to determine if MaxPeak Premier Columns were needed for this separation a comparison between a MaxPeak Premier Column and standard stainless-steel hardware column was performed. Both columns were packed with the same batch of stationary phase and have comparable efficiency as per the column QC paperwork. Figure 8 shows the comparison between the two columns used.
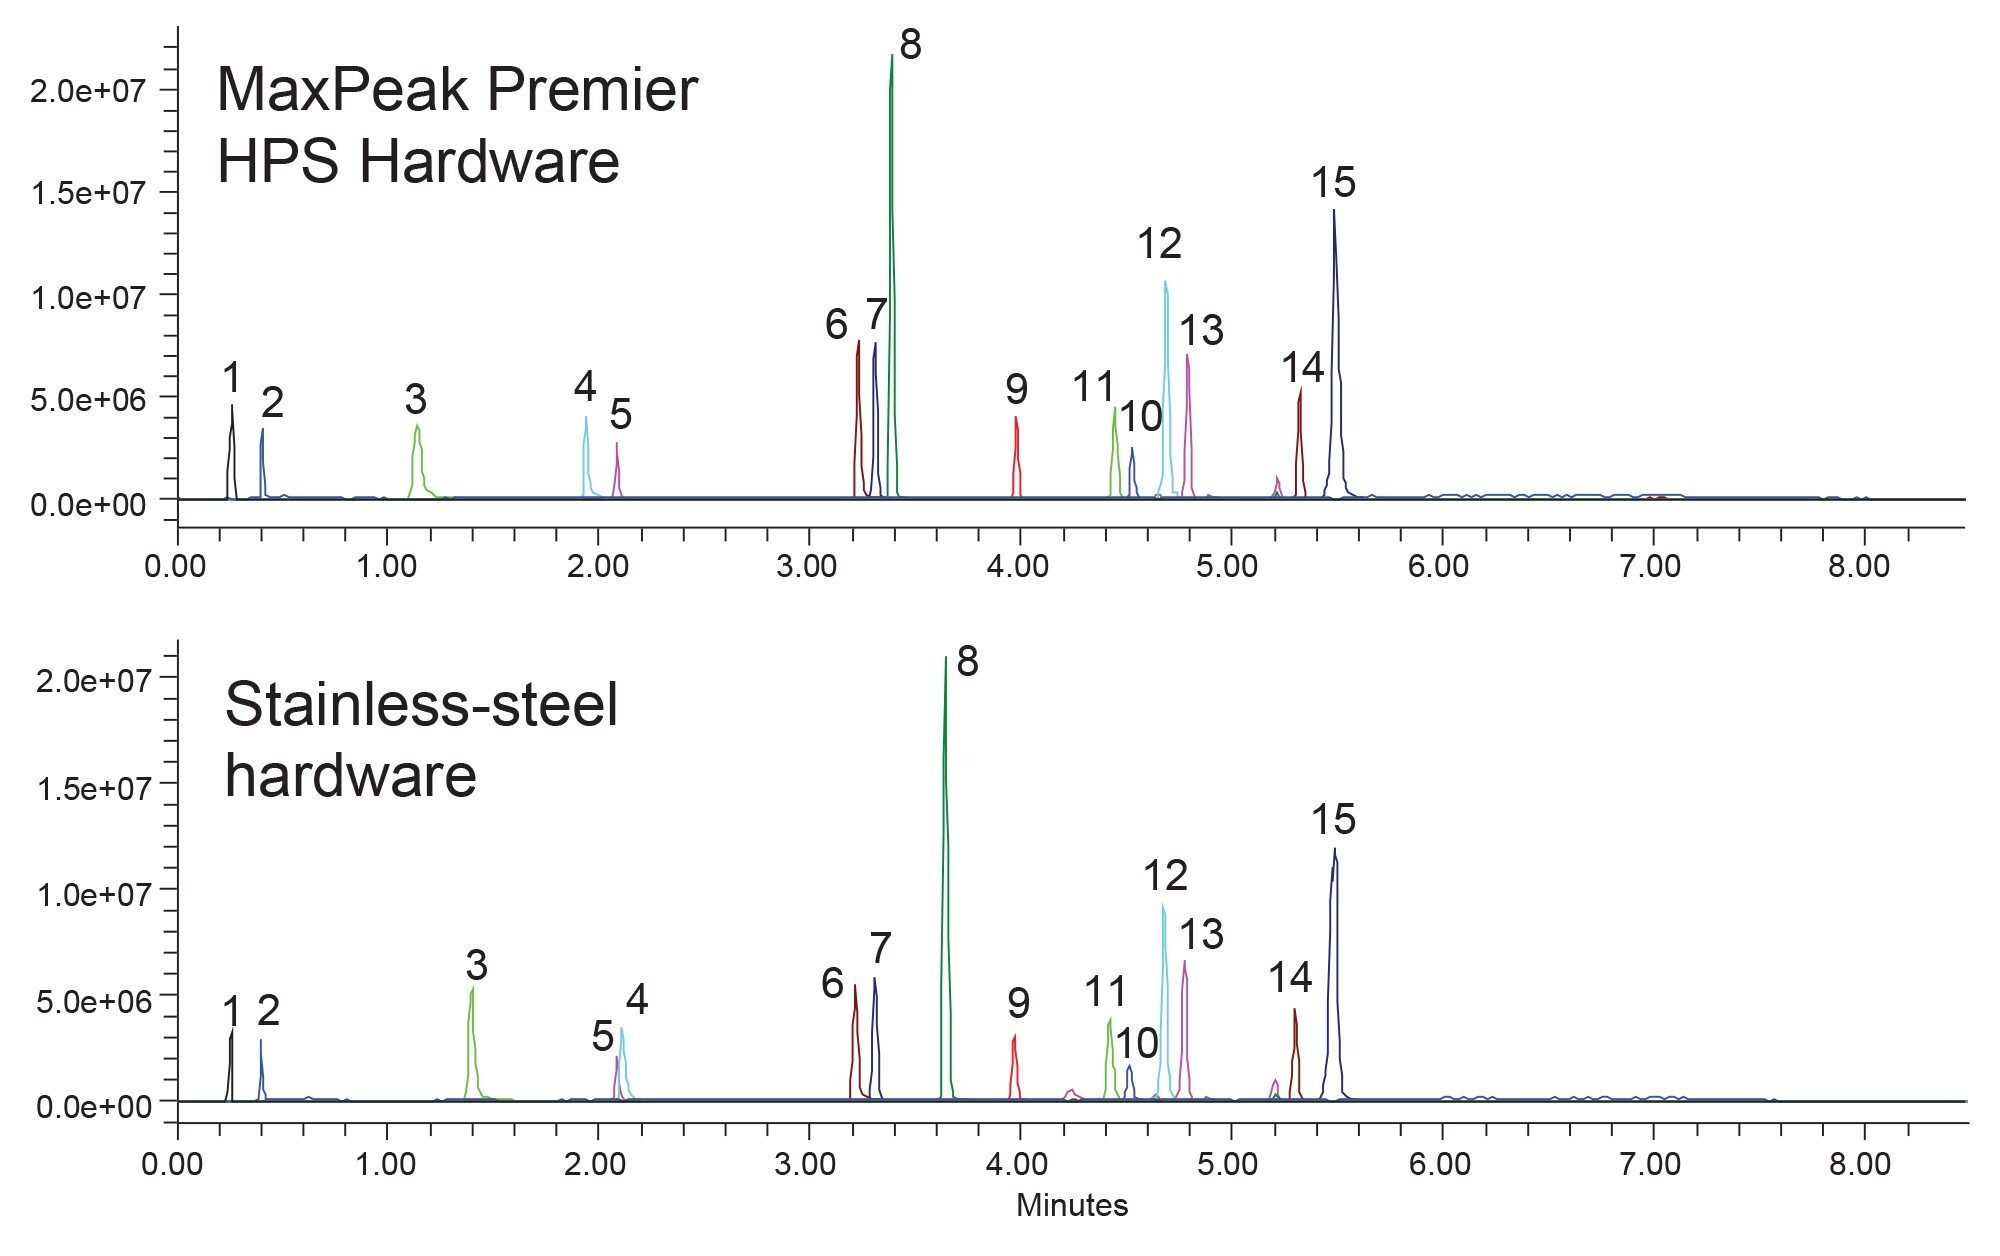 Figure 8. Separation of the test mixture using an ACQUITY Premier HSS T3 Column and an ACQUITY HSS T3 Column. Peaks identified by mass using the ACQUITY QDa. 1) 226.9 m/z, 2) 102.0 m/z, 3) 100.0 m/z, 4) 155.1 m/z, 5) 115.9 m/z, 6) 171.9 m/z, 7) 450.1 m/z, 8) 639.2 m/z, 9) 583.1 m/z, 10) 225.2 m/z, 11) 428.1 m/z, 12) 624.1 m/z, 13) 682.1 m/z, 14) 829.2 m/z, 15) 923.3 m/z (ARV-825).
For the most part, the two columns perform about the same. However, some major differences between the columns are present. Notably, using MaxPeak Premier HPS Hardware, components four and five are separated completely. However, using stainless-steel hardware the two components co-elute. This difference in selectivity can occur for some analytes depending on their properties and how they interact with the metal surfaces. In this case, component four is more retained when analyzed with stainless-steel hardware, indicating that some of its retention is determined by the interaction with the metal surface. Additionally, components six and seven are less retained with the stainless-steel column indicating that they are slightly repelled by the metal surface. Having these secondary interactions present in a separation can have a variety of detrimental effects. For instance, with repeated injections the metal surface can become passivated, leading to changes in retention over time. By using MaxPeak Premier Columns from the beginning, method development decisions are made solely on the interactions between analyte and stationary phase. If stainless-steel hardware columns were used, some of the results obtained would be different and variable, making method development considerably more challenging. This is a prime example of why reducing risk in method development is critical and MaxPeak Premier Columns are the standard of analysis if reducing risk is the desired outcome.
Conclusion
Forced degradation studies are critical to the development of new pharmaceutical compounds. The study provides not only critical information regarding the stability of the compounds but also the potential hazard of the degradants. Additionally, in the process of performing the study a stability indicating method is often created to monitor for the degradants, especially those which are found to be dangerous. Creating the stability indicating method requires the implementation of a method development process, such as the one shown in this application note.
Here, the systematic screening protocol coupled with MaxPeak Premier Columns was used to develop a new method for the forced degradation of the Proteolysis Targeting Chimera (PROTAC) ARV-825. ARV-825 is a heterobifunctional molecule compromised of a pomalidomide compound linked to a birabresib compound using a polyethylene glycol chain. Using MaxPeak Premier Columns, a method was realized in just over two days. Comparisons of MaxPeak High Performance Surface Hardware to standard stainless-steel hardware show differing selectivity and retentivity for some degradants. This was caused by the additional interactions between the analyte and the column hardware, leading to worse overall performance of the standard hardware column, even though both columns are packed with the same batch of stationary phase. MaxPeak Premier Columns eliminate those secondary interactions allowing more reliable and accurate method development, as retention is driven solely by the interaction between analyte and stationary phase. MaxPeak Premier Columns have become the standard of analysis for a variety of workflows for this reason.
References
- He L, Chen C, Gao G, Xu K, Ma Z. ARV-825-Induced BRD4 Protein Degradation as a Therapy for Thyroid Carcinoma. Aging (Albany NY). (2020) 4547–4557.
- Wu, S et al. BRD4 PROTAC Degrader ARV-825 Inhibits T-Cell Acute Lymphoblastic Leukemia by Targeting ‘Undruggable’ Myc-Pathway Genes. Cancer Cell Int. (2021), 21, 230.
- Li Z et al. PROTAC Bromodomain Inhibitor ARV-825 Displays Anti-Tumor Activity in Neuroblastoma by Repressing Expression of MYCN or C-Myc. Front. Oncol. (2020) 10.
- Sun X, Gao H, Yang Y, He M, Wu Y, Song Y, Tong Y, Rao Y. PROTACs: Great Opportunities for Academia and Industry. Signal Transduction and Targeted Therapy. (2019) 4, 64.
- Liu Z, Hu M, Yang Y, Du C, Zhou H, Liu C, Chen Y, Fan L, Ma H, Gong Y, Xie Y. An Overview of PROTACs: A Promising Drug Discovery Paradigm. Mol Biomed (2022) 3:46.
- Sakamoto KM, Kim KB, Kumagai A, Mercurio F, Crews CM, Deshaies RJ. PROTACs: Chimeric Molecules That Target Proteins to the SKP1–Cullin–F Box Complex for Ubiquitination and Degradation. Proc Natl Acad Sci. (2001) 8554–8559.
- Delano M, Walter TH, Lauber M, Gilar M, Jung MC, Nguyen JM, Boissel C, Patel A, Bates-Harrison A, Wyndham K. Using Hybrid Organic-Inorganic Surface Technology to Mitigate Analyte Interactions with Metal Surfaces in UHPLC. Anal. Chem. 93 (2021) 5773–5781.
- Walter TH, Alden BA, Belanger J, Berthelette K, Boissel C, DeLano M, Kizekai L, Nguyen JM, Shiner S. Modifying the Metal Surfaces in HPLC Systems and Columns to Prevent Analyte Adsorption and Other Deleterious Effects. LCGC Supplements (2022) 28–34.
- Smith K, Rainville P. Utilization of MaxPeak High Performance Surfaces and the Atlantis Premier BEH C18 AX Column to Increase Sensitivity of LC-MS Analysis. Waters Application Note, 720006745, 2020.
- Jung MC, Lauber MA. Demonstrating Improved Sensitivity and Dynamic Range with MaxPeak High Performance Surfaces (HPS) Technology: A Case Study on the Detection of Nucleotides. Waters Application Note, 720007053, 2020.
- Zabala G, Berthelette K, Gu W, Haynes K. Improved Reproducibility for Acetaminophen Assay USP Monograph Using MaxPeak Premier Columns after Modernization to 2.5 µm Particles. Waters Application Note, 720007938, 2023.
- Boissel C, Walter TH, Shiner S. ACQUITY Premier Solution Improves the UPLC-MS Analysis of Deferoxamine – an Iron Chelating Drug. Waters Application Note, 720007239, 2021.
- Maziarz M, McCarthy S, Wrona M. Improving Effectiveness in Method Development by Using a Systematic Screening Protocol. Waters Application Note. 720005026EN, 2014.
- Berthelette KD, Nguyen JM, Turner, J. Method Development of Ten Antibiotic Compounds Using a Systematic Screening Protocol on an ACQUITY ARC with UV and QDa Detection. Waters Application Note. 720007352EN, 2021.
- Berthelette KD, Turner JE, Walter TH, Haynes K. Using a Systematic Screening Protocol and MaxPeak HPS Technology to Develop a UHPLC Method for the Analysis of Deferoxamine and its Forced Degradation Products. Waters Application note, 720007834, 2022.
- Hong P, McConville P. A Complete Solution to Perform a Systematic Screening Protocol for LC Method Development. Wates White Paper, 720005268EN.
- Zelesky T, et al. Pharmaceutical Forced Degradation (Stress Testing) Endpoints: A Scientific Rationale and Industry Perspective. Journal of Pharmaceutical Sciences. (2023) 2948–2964.
720008328, April 2024