Single Cell Image Resolution with DESI XS Coupled to a Xevo G3 Mass Spectrometer
Abstract
Here we demonstrate with tissue sections and non-confluent cell cultures that DESI provides a solution for single cell mass spectrometry imaging analyses. Single cell image resolution is achieved with acquisition pixel sizes of 5 µm, utilizing a commercial DESI™ source with low flow DESI capability kit, on a Xevo™ G3 Mass Spectrometer. It is possible to interrogate individual cells deeply, viewing multiple pixels per cell. We also show that more than 50 lipids can be putatively identified from single PC-3 and THP-1 cells, with over 192 lipids detected in total. We also demonstrate that statistical analyses can be used to probe cellular heterogeneity.
Benefits
- A commercially available DESI set-up which allows high-resolution MS imaging acquisitions down to a pixel size of 5 µm, thus enabling the visualization and differentiation of individual cells
- Microscope mode within HDI v1.8 supports analyses with a non-destructive survey scan, followed by targeted re-acquisition at higher resolution, saving significant analysis time
- Signal strength and spectral clarity allow for numerous lipid identifications per single cell and support statistical analysis of cells looking for biological differentiation
Introduction
Desorption electrospray ionization (DESI) is an established imaging technique allowing the mass spectrometry imaging of surfaces with minimal sample preparation and without the requirement for application of matrices. This allows for histological staining, and/or alternate imaging techniques to be performed subsequently on the same tissue/culture area.
As with all imaging techniques there is a continual drive towards smaller pixel sizes resulting in a higher image resolution. Here we demonstrate how using a low flow DESI technique, on a commercially available DESI source setup, allows the visualization of single cells within tissue and within non-confluent cultures.
It has been recently discovered that morphologically and genetically identical cells are found to exhibit heterogeneity on transcriptomic, proteomic, metabolomic and lipidomic levels.1.2 As such, to investigate population heterogeneity, single cell analysis is becoming increasingly vital to provide solutions to previously unanswerable biological questions. Achieving single cell resolution within DESI imaging applications allows not only these biological variations to be visualized on a cell-by-cell basis, but it also potentially enables the investigation of individual cell-cell interactions.
Experimental
Cell Cultivation
The THP-1 cell line was established in a T25 flask, in RPMI-640 media containing 10 % fetal bovine serum (FBS), 1% non-essential amino acids, 1% sodium pyruvate, 1% glutamax and 1% kanamycin for 1 week to a confluency of 70%. The cells were then seeded into a Nunc™ Lab-Tek™ II Chamber slide™ system at a seeding density of 25,00 cells per well. THP-1 cells were stimulated to THP-1 macrophages with the addition of phorbol-12-myristate-13-acetate (PMA), (20 ng/ml). Cells were incubated at 37 °C, 5% CO2 in a LEEC Precision 190D incubator. On the third day of culture, oleic acid (100 µM) was added to the culture and incubated for a further day.
The PC-3 cell line was established in a T-25 flask containing F-12K medium supplemented with 10% FBS, and 1% kanamycin for 1 week to 70% confluency. Cells were then seeded into a Nunc Lab-Tek II Chamber slide system at a seeding density of 25,00 cells per well. Cells were incubated at 37 °C, 5% CO2 in a LEEC Precision 190D incubator. On the third day of culture, oleic acid (100 µM) was added to the culture and incubated for a further day.
Sample Preparation
The cells were washed with pre-warmed (37 °C) DPBS to remove residual media and fixed by adding PFA (4%) for 20 minutes at room temperature. The cells were then washed twice using DPBS and the chambers were removed prior to storage at – 80 °C.
A murine brain was sectioned at 18 µm onto a glass microscope slide.
Mass Spectrometry
The slides were analyzed (with no further treatment) on a Xevo G3 QTof MS coupled to a DESI XS source, equipped with a high-performance sprayer and heated transfer line. The system was also fitted with a low flow DESI capability kit (p/n: 186011378) coupled to an ACQUITY™ M-Class BSM solvent delivery system.
Optimization of nano-flow DESI imaging requires the adjustment from conventional flow DESI please refer to the Waters application note: Pushing the Boundaries of DESI Imaging with High Spatial Resolution for details of this set-up.3
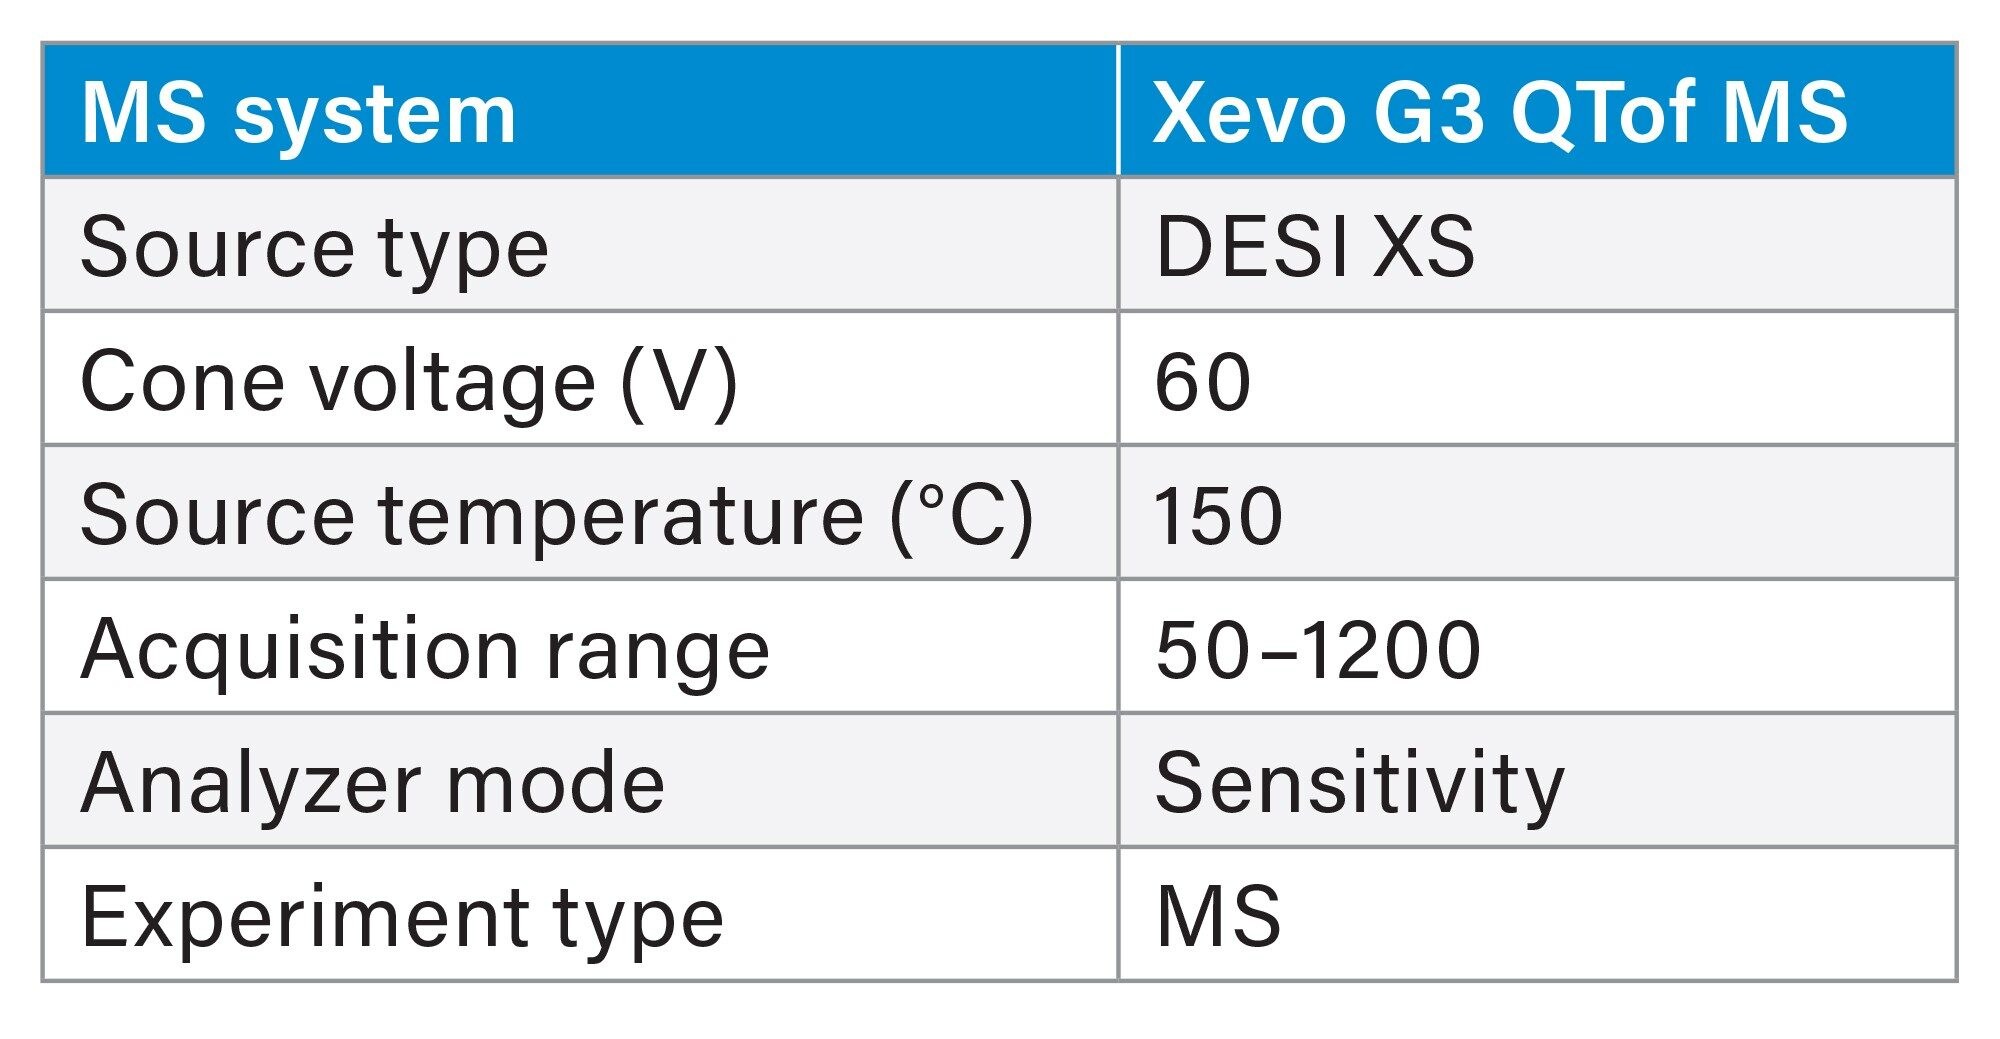 Table 1. MS Conditions
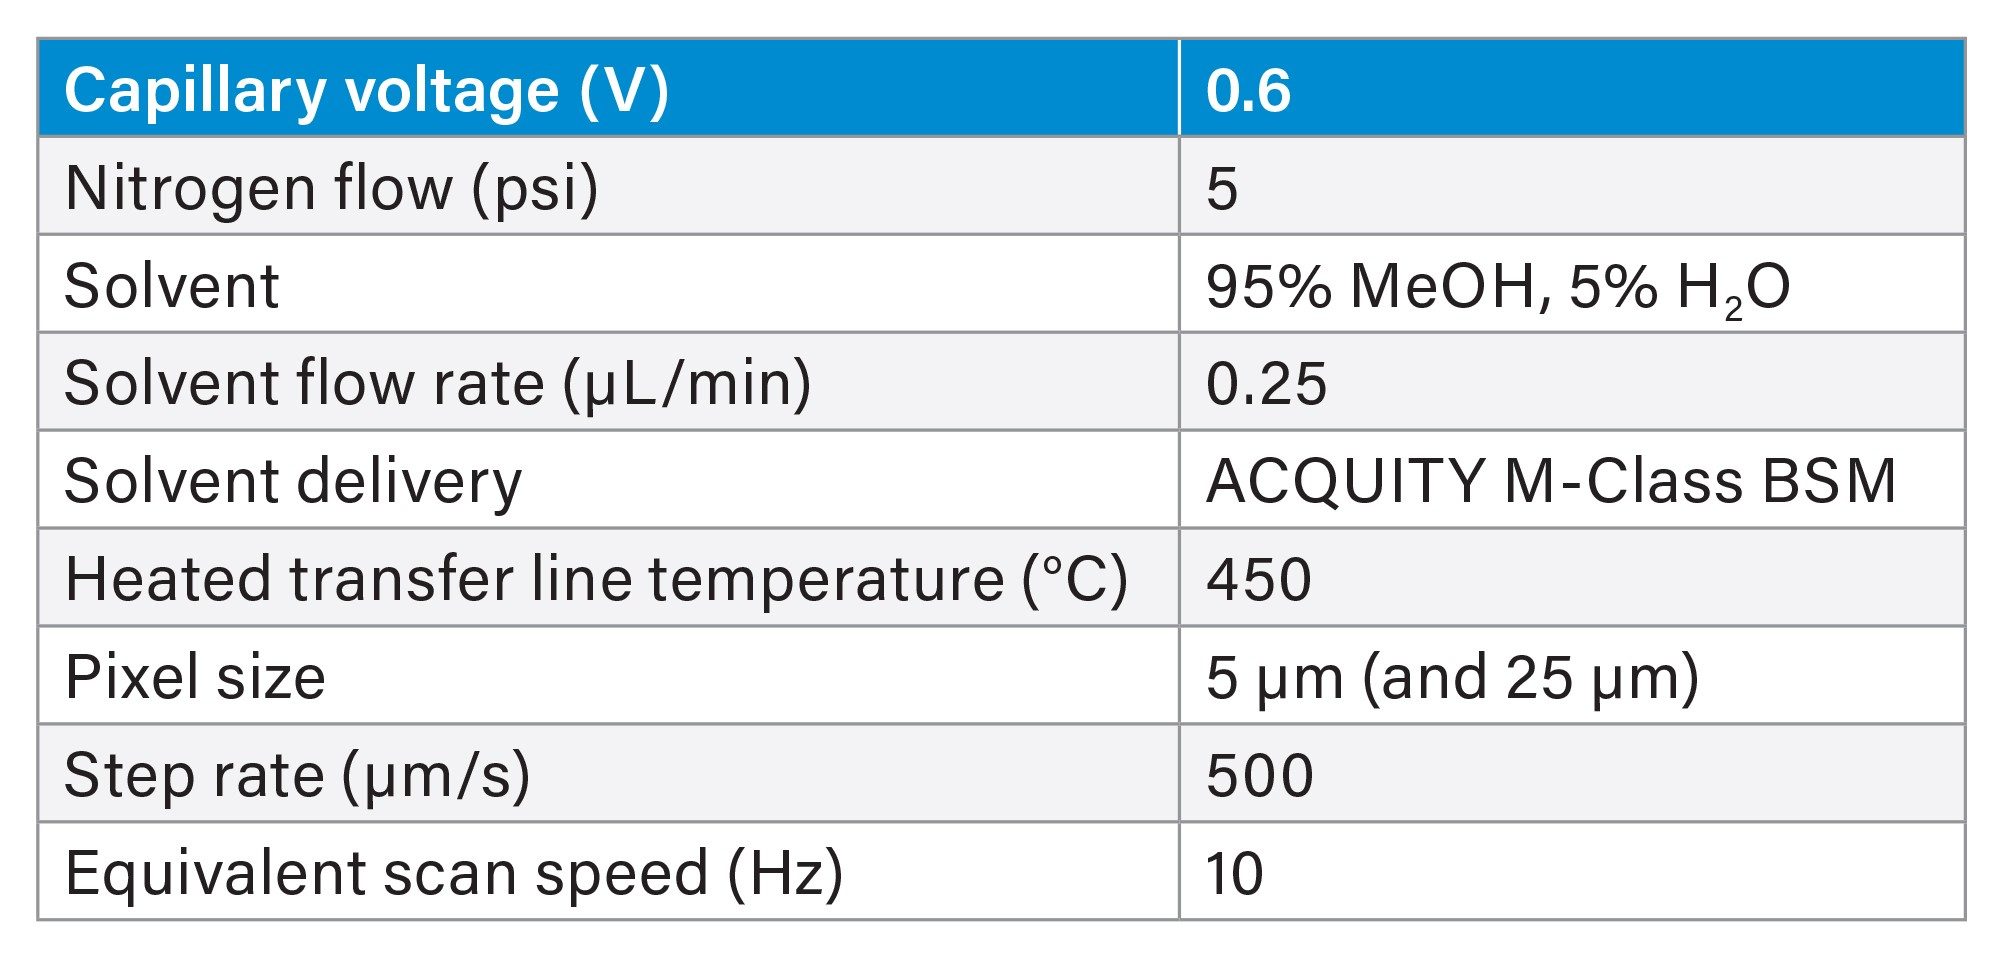 Table 2. Setup
Microscopy
All microscope images were generated using a Lecia DM 2500 LED microscope and a Bio-Rad fluorescent cell imaging system.
Data Processing
MS data were manually assessed using MassLynx™ Software prior to being processed in High-Definition™ Imaging (HDI™) v1.8 software for image visualization and selection of regions of interest (ROI) for more detailed image acquisition.
Single cells and blanks were manually annotated and exported as single spectrum regions of interest in HDI. Data were processed by conversion through progenesis bridge, analytes “peak picked” and lipids putatively annotated using Lipostar v2.1.6b5 (Mass Analytica™) using LMSD with a ppm <6, data were then exported from Lipostar and taken into MetaboAnalyst 6.0 for statistical evaluation.4
Results and Discussion
In tissue sections and non-confluent cell cultures we demonstrate that with a 5 µm pixel size DESI is beginning to achieve spatial resolution approaching single cell differentiation.
An example of single cells imaged within tissue are given in Figure 1. Here, we have imaged a small area of a murine cerebellum, focusing on a white matter structure. The murine cerebellum images were produced by selecting a single lipid signal with an m/z 760.5848, putatively identified as PC 34:1 [M+H]+, for which the strongest signal is localized to structures that appear as single non-uniform cells within the white matter, most likely oligodendrocytes.5,6 Microscopy suggests these cells are approximately 10–15 µm in diameter.
Shown is the same area of tissue imaged at both a 10 µm pixel size and with a 5 µm pixel size (Figure 1 B), there is clearly an increase in image fidelity between the two pixel sizes. This indicates that there is an improvement in image resolution at a 5 µm pixel size significantly improving the differentiation of the single cells.
- Figure 1 A shows a 10 µm pixel acquisition of a small section of murine cerebellum. Visualizing the lipid with m/z 760.5848, a number of cell structures can be seen within the white matter. Accompanying the mass spectrometry image is a microscope visual of the pre-analyzed slide.
- Figure 1 B shows a similar region of murine cerebellum (to A) analyzed from consecutive sections, with a 10 µm pixel size and with a 5 µm pixel size, showing an improvement in image fidelity with the smaller pixel size.
- Figure 1 C shows the same acquisitions (as B) zoomed closer so pixel definition can be visualized.
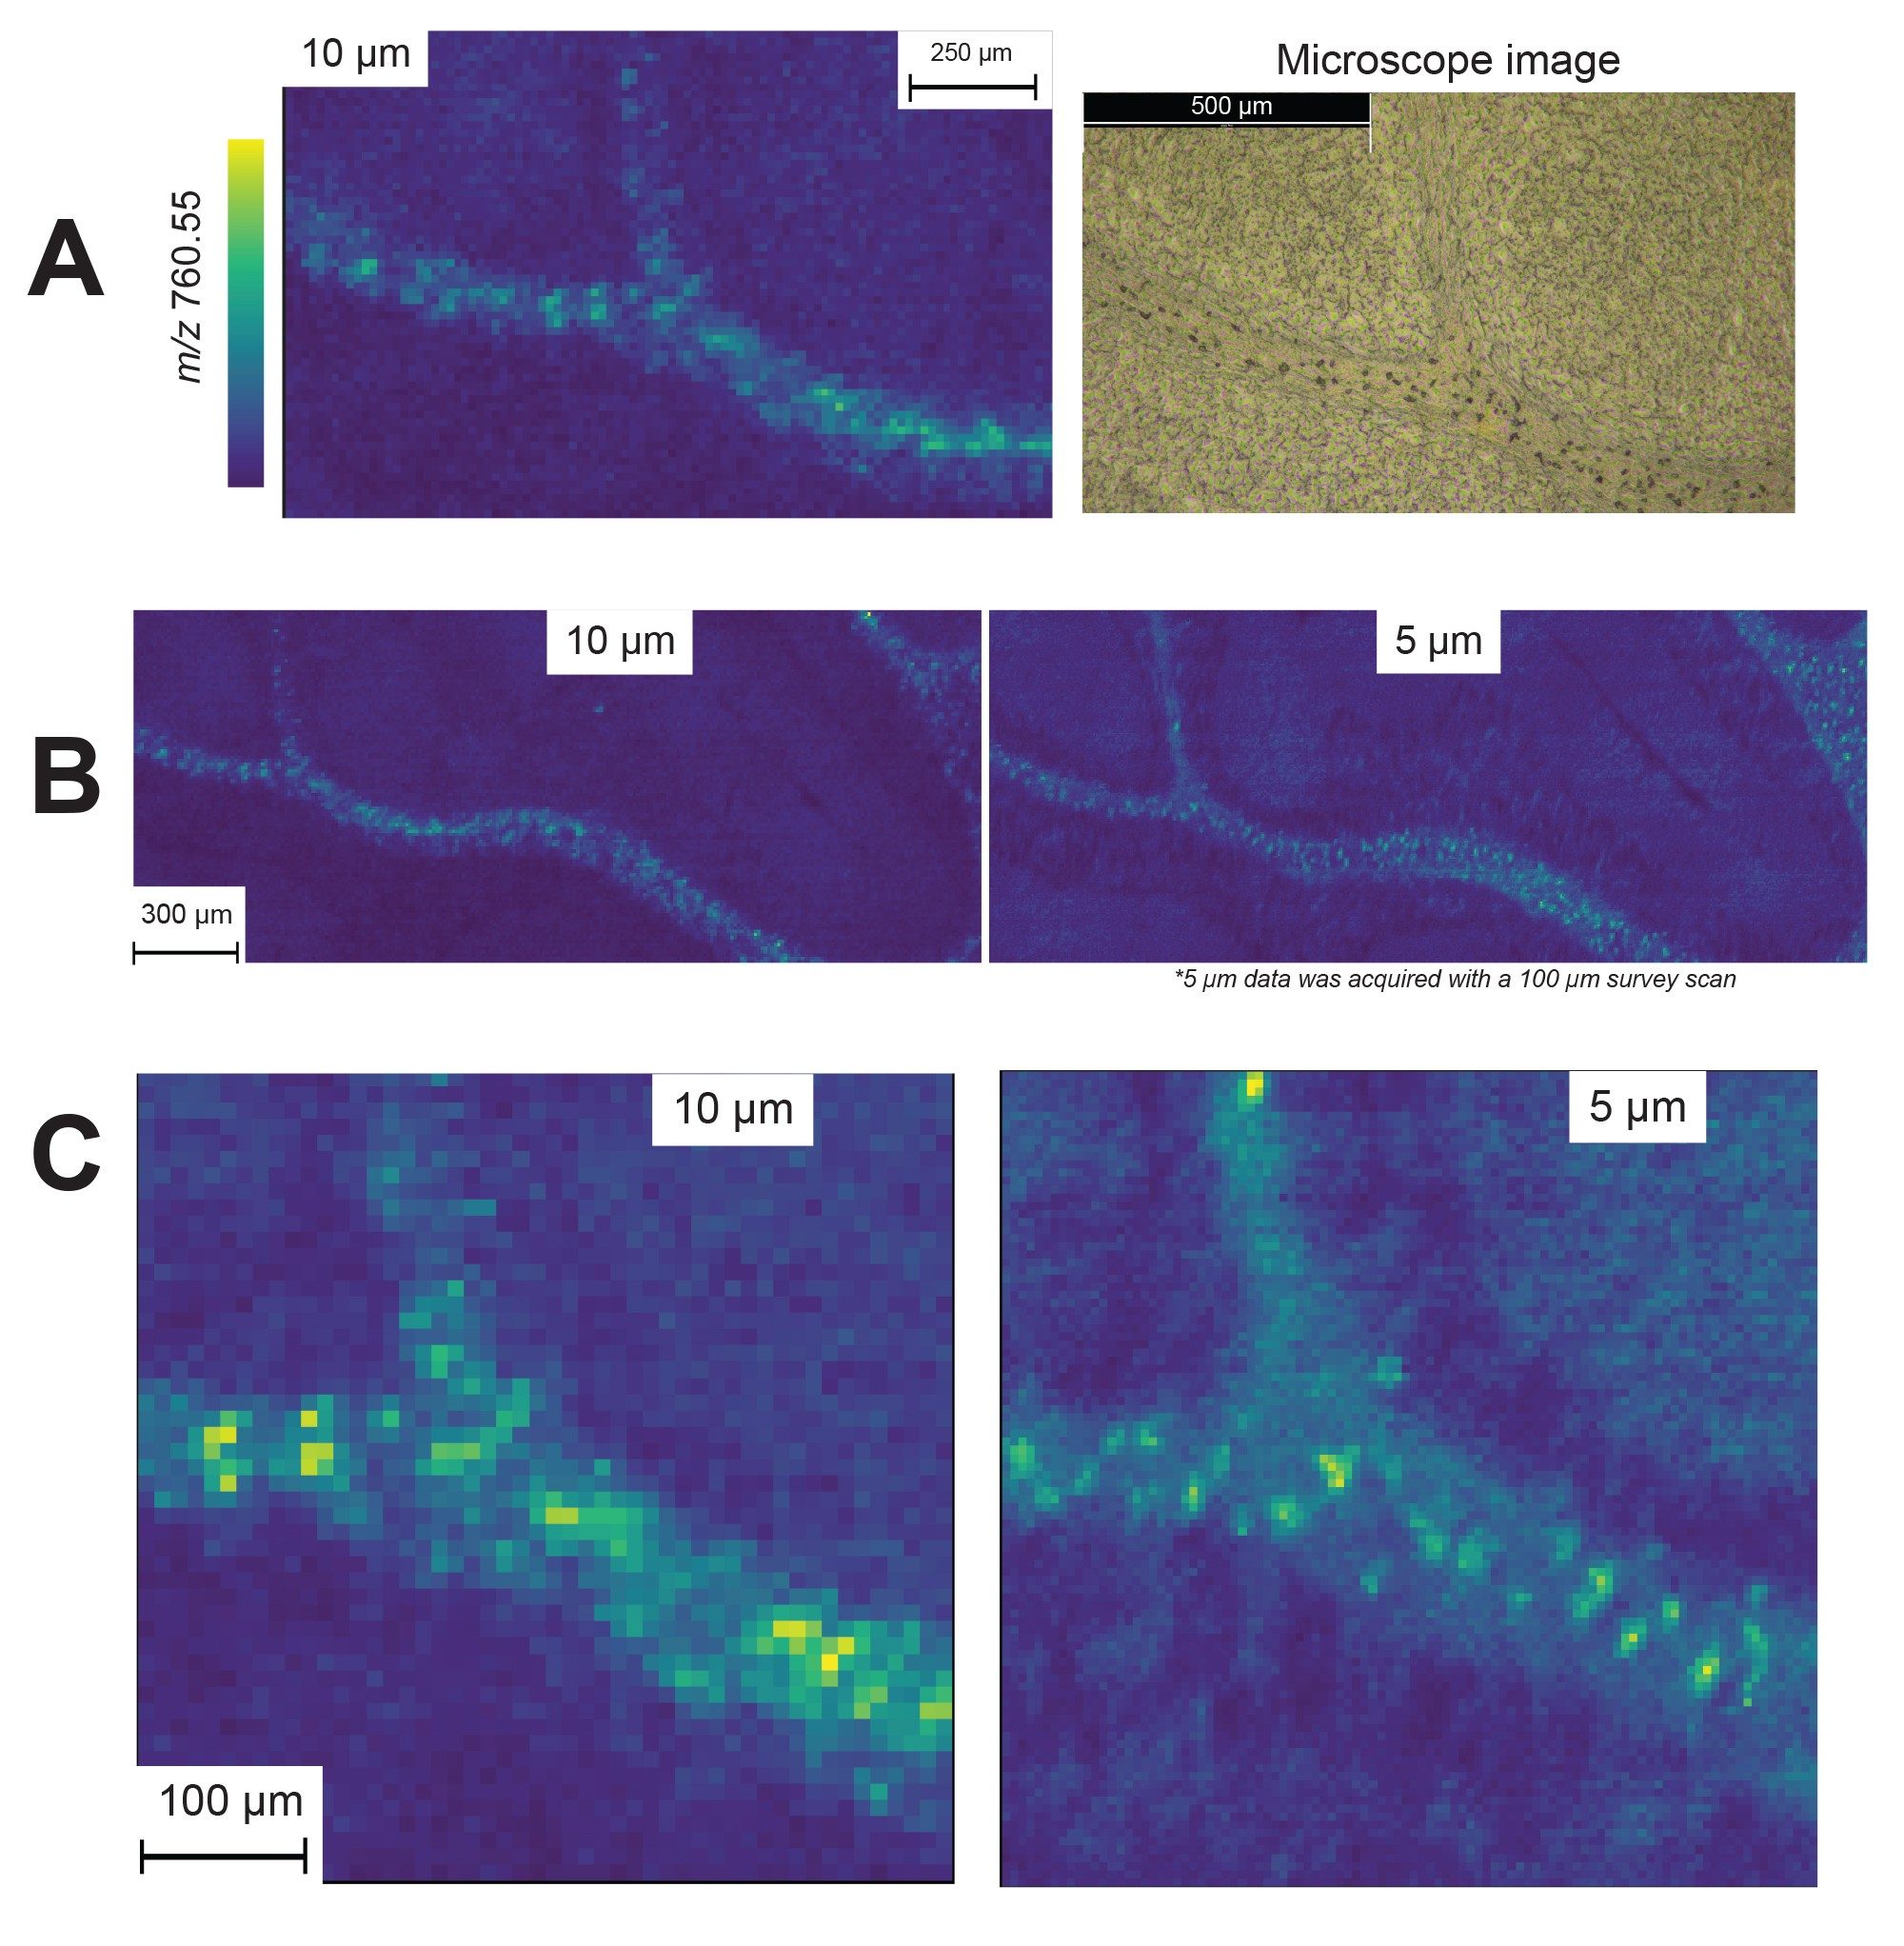 Figure 1. A) A small area of a murine cerebellum fissure with coresponding microscope image, B) an area of a murine cerebellum white matter on consecutive sections imaged at both 5 µm and 10 µm, and C) a closer zoom of (B).
When such small pixel sizes are utilized to acquire an image, the analysis time required quickly becomes limiting, especially if large areas are being imaged. This is often necessary to ensure feature acquisition, or to guarantee cell coverage for non-confluent cultures. As such, to optimize data acquisition time an acquisition setup: “microscope mode” is now available in HDI v1.8. This software tool enables larger areas to be rapidly scanned with a greater pixel size, and then smaller regions of interest can be subsequently reacquired at a lower pixel size, guaranteeing targeted area acquisition at improved image resolution.
To investigate this, non-confluent cell cultures of THP-1 and PC-3 were analyzed. THP-1 is a human monocytic leukemia cell line that has been extensively utilized in the field of immunobiology to probe monocyte and macrophage functions, signaling pathways and drug transport mechanisms.7,8 PC-3 is a human prostate cancer cell line often used to assess cellular responses to chemotherapeutic agents.9 The ability to investigate cells such as these at an individual level can help to uncover complex cellular mechanisms within cells, leading to discoveries about how cells function and interact. This in turn can aid in the identification of specific cellular abnormalities that contribute to diseases, leading to more accurate diagnoses, or by studying how individual cells respond to new drugs, researchers can better predict the efficacy and safety of potential treatments.
Microscope mode proved particularly useful for these acquisitions as it facilitated the identification of areas of the slide containing cells. This can be seen in Figure 2 where microscope mode images of THP-1 derived macrophages are shown. An initial 25 µm pixel survey scan (Figure 2 A and B) was acquired followed by a 5 µm pixel acquisition of a region identified in the survey scan as being more densely populated. For visualization purposes, the images highlight m/z 808.5855 putatively identified as PC 36:2 [M+Na]+.
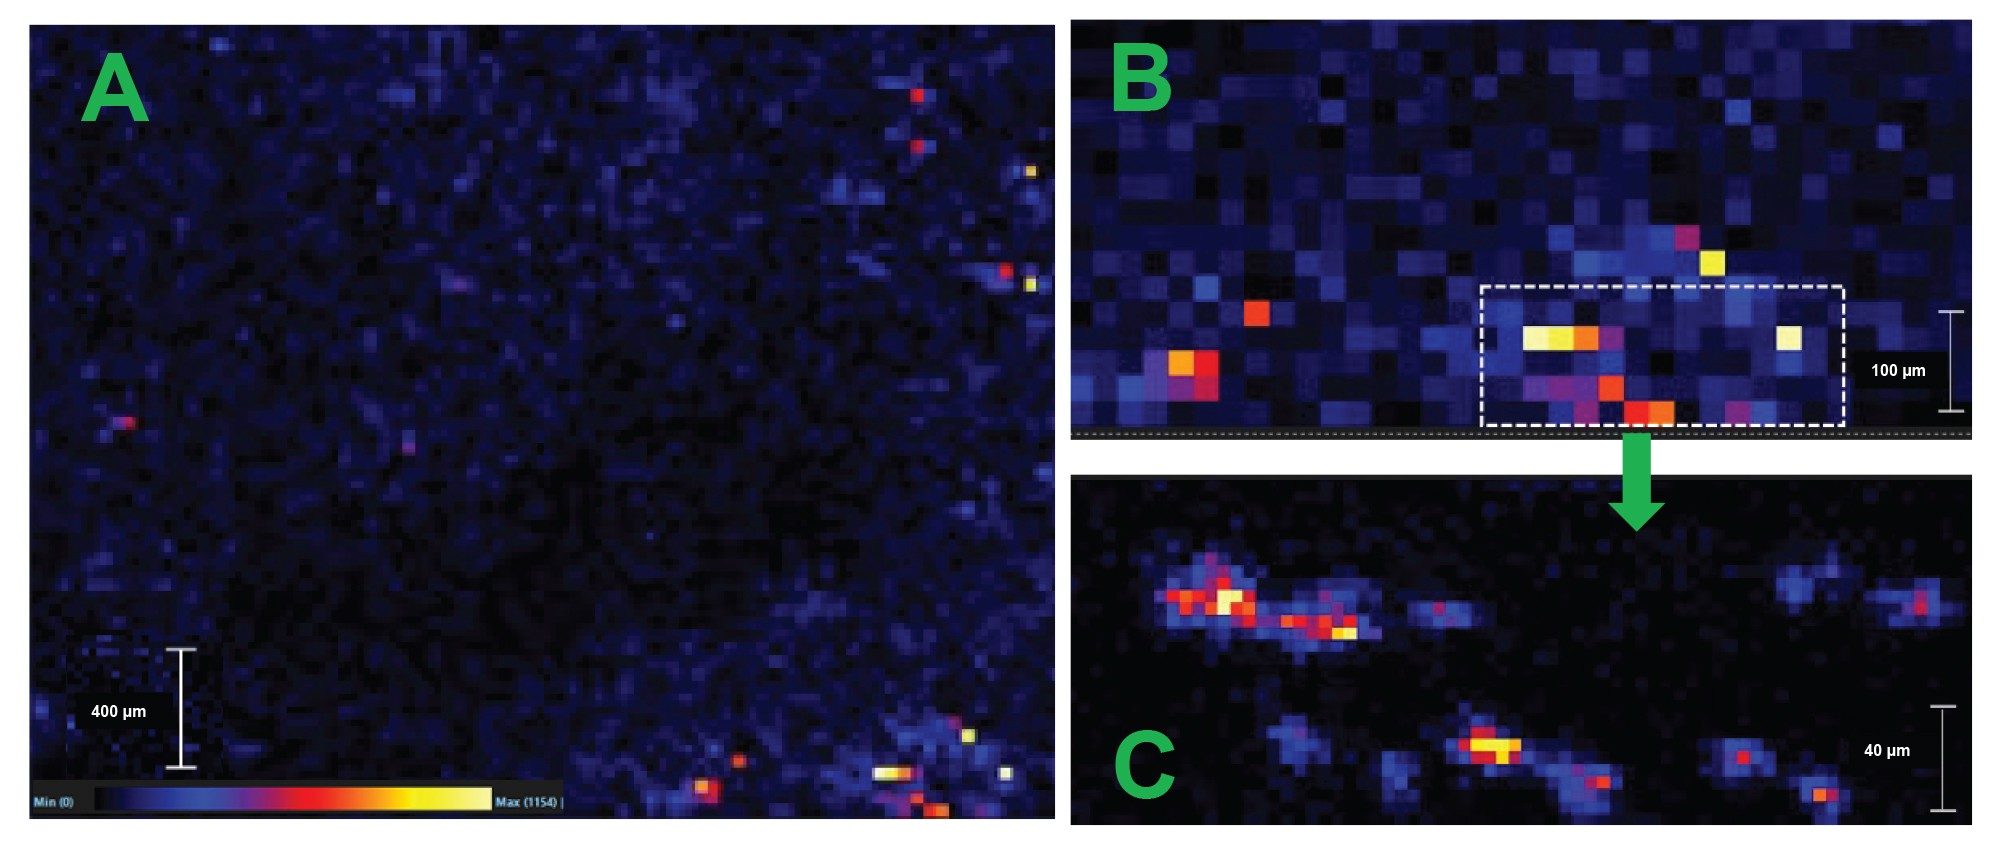 Figure 2. Images of a non-confluent cell culture (THP-1 derived macrophages), A) a 25 µm survey scan B) Zoom in of the 25 µm survey scan showing area of interest C) 5 µm image of area of interest.
In addition to acquiring DESI images of the THP-1 non-confluent cell culture, DESI acquisition was also performed of a PC-3 non-confluent cell culture for biological comparison purposes. Prior to DESI analysis, microscopy images were taken of the non-confluent cultures and estimate that the THP-1 macrophages (Figure 3, A) have an average diameter of 18.7 µm (stdev=6.7, n=10), and PC-3 cells (Figure 3, B) have an average diameter of 24.1 µm (stdev=5.9, n=10). The DESI images corresponded well with the expected sizes for single cells with THP-1 cells measuring between 4 to 5 pixels across (20–25 µm) and PC-3 cells between 5–6 pixels across (25–30 µm).
The cell images seen in Figure 3 are accompanied by DESI images to show similarity of cell DESI and microscopy cellular measurements. These were taken from other sections of the culture area and therefore cell images do not colocalize. The THP-1 cell images were produced using analyte signal m/z 782.5696 putatively identified as PC (36:4) [M+H]+ (Figure 3, C) and the PC-3 cell images were produced using analyte signal m/z 798.5492 putatively identified as PE P(40:6) [M+Na]+ (Figure 3, D). It can be noted that there are clear differences in lipid intensity between the individual cells, this shows potential heterogeneity between the cells, possibly due to cycle stage and/or biological variance.
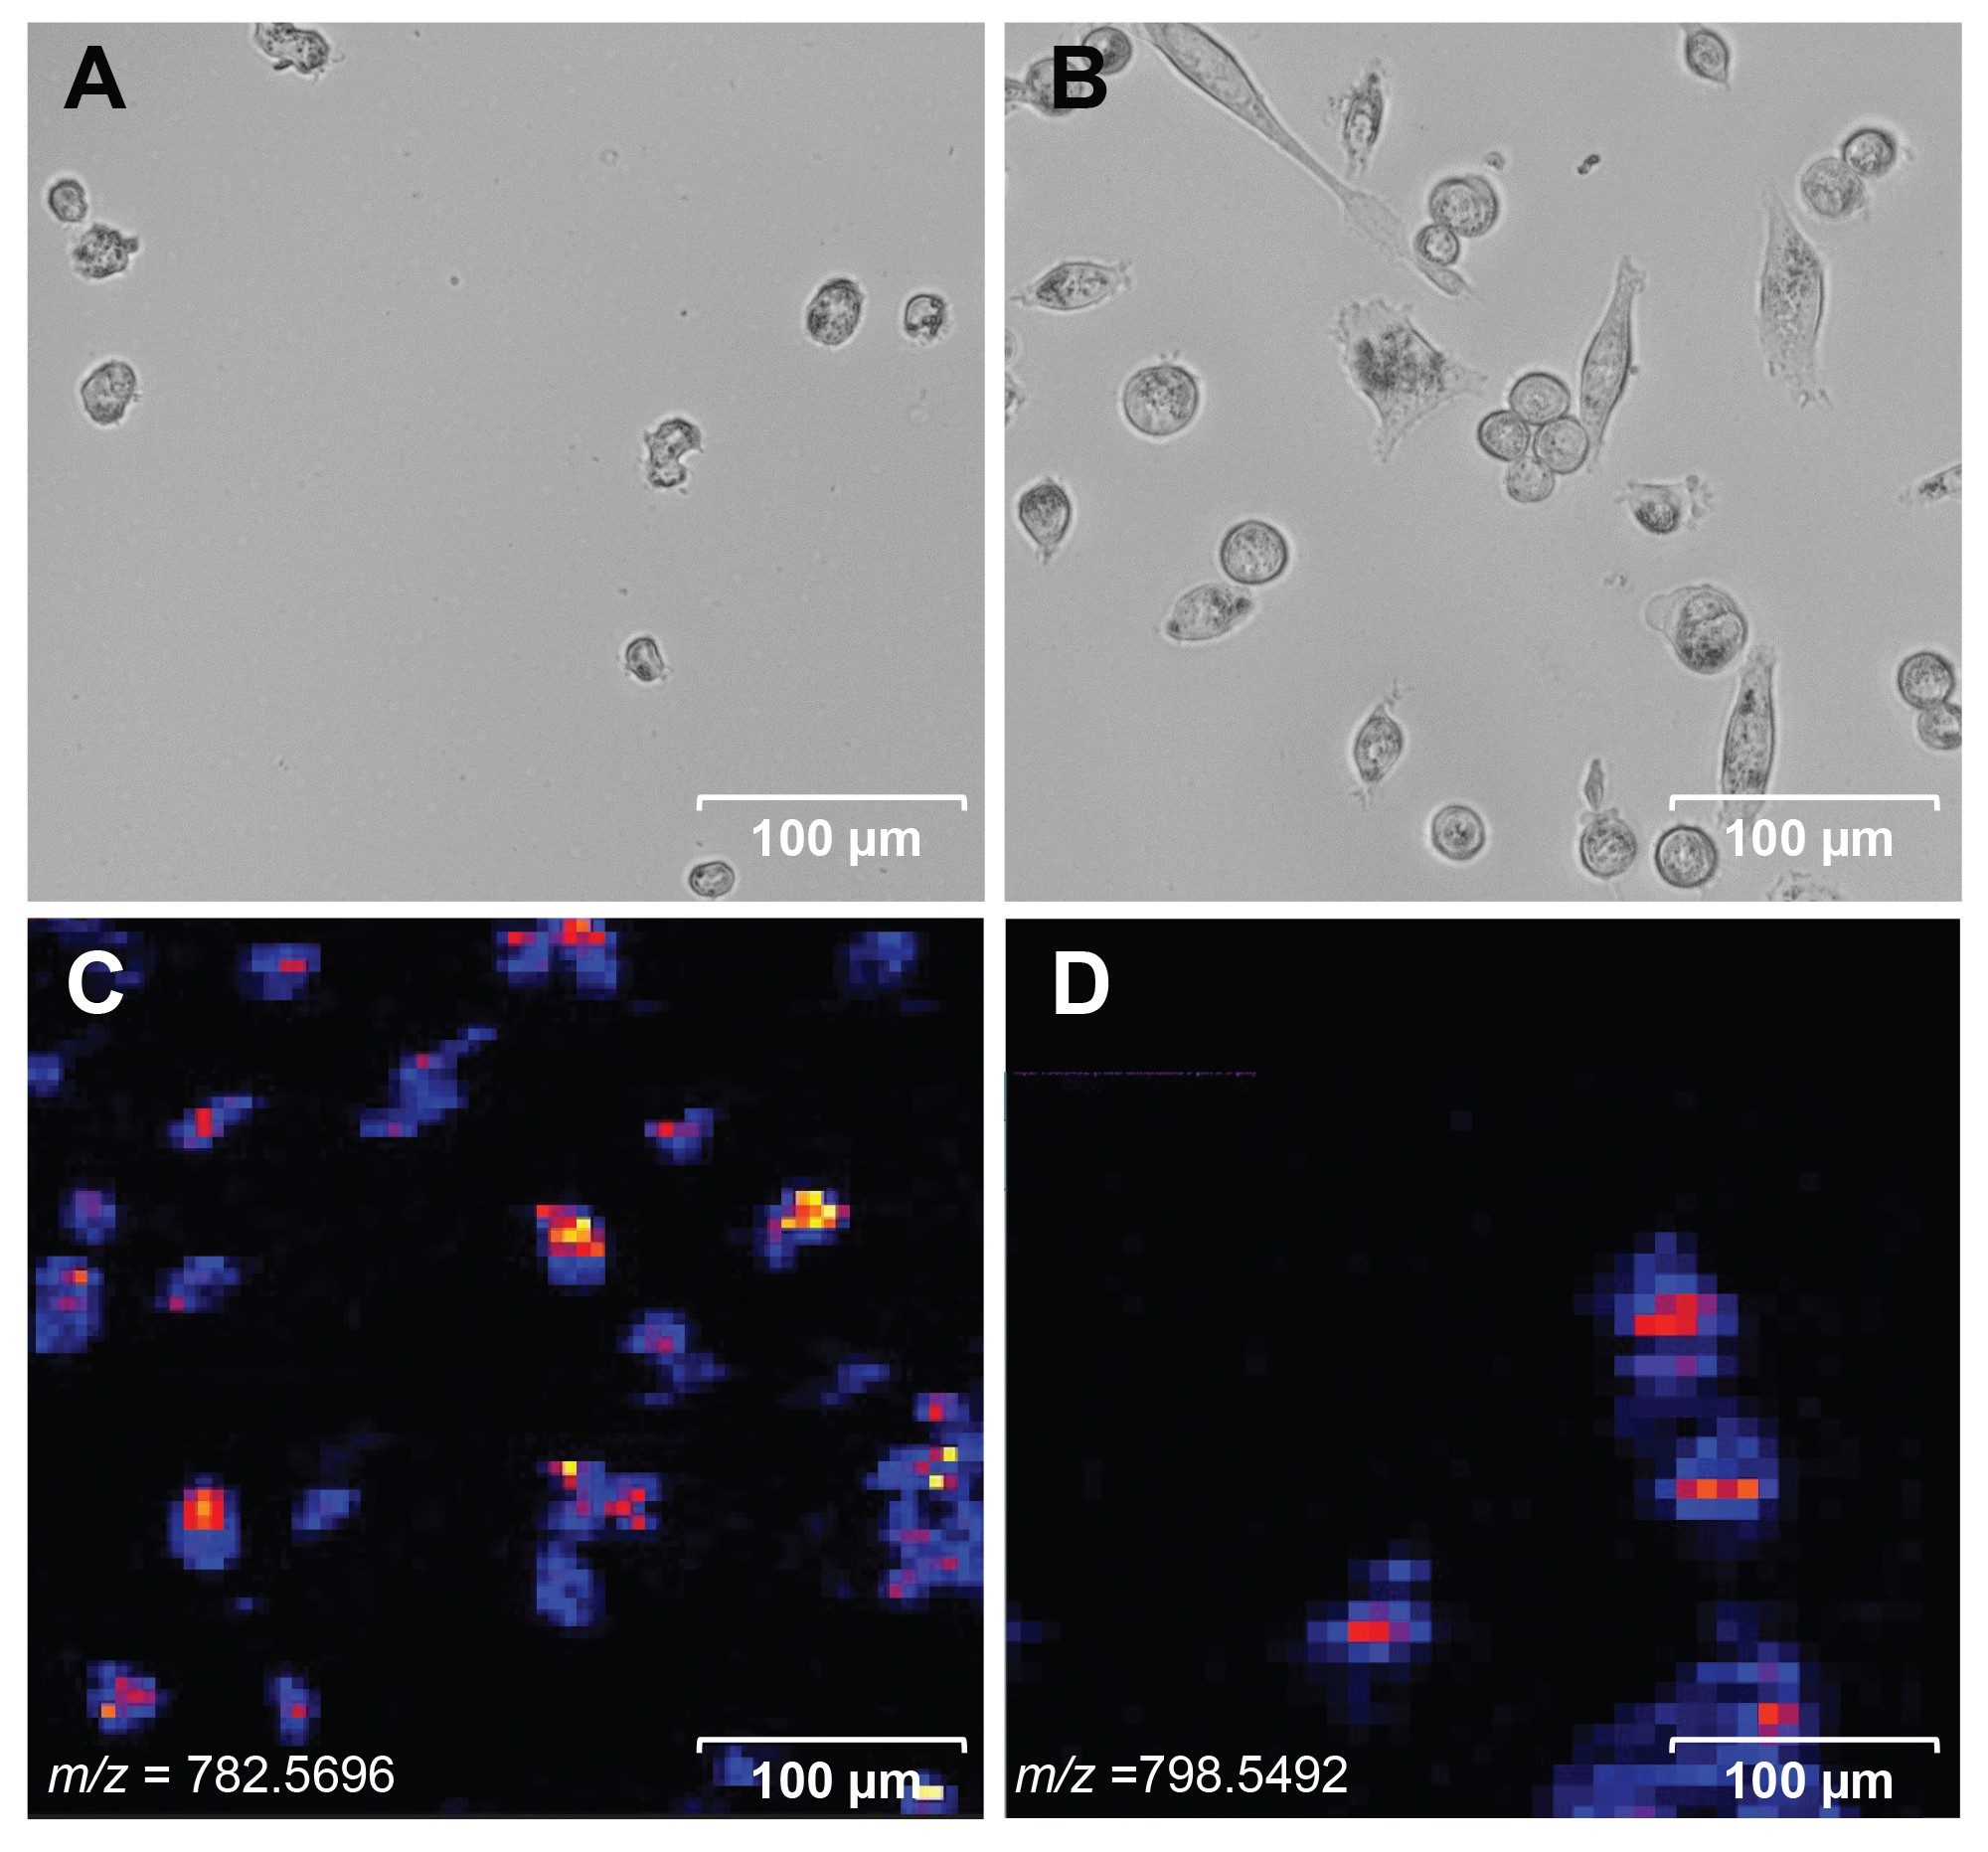 Figure 3. Microscopy images of non-confluent A) THP-1 cell culture B) PC-3 cell culture, with DESI images (of a different region) of the same cell cultures C) THP-1 cell culture, D) PC-3 cell culture.
The DESI data from a selection of individual cells for each cell line were statistically processed, in total 192 different lipids were putatively identified over both cell types. Of these, a total of 91 lipids were common between the two cell types, 60 identified lipids were unique to the PC-3 cells, and 41 identified lipids were unique to the THP-1 cells (Figure 4A). On average, 48 lipids were putatively identified per single PC-3 cell, and 55 per single THP-1 cell, as displayed in Figure 4B.
Taking the individual cells for each type a principal component analysis (PCA) was generated (Figure 4C). A clear separation was observed between the two cell types, demonstrating that single cell DESI data can confidently distinguish between differing cell lines. Furthermore, it can be seen from the PCA plot that the individual THP-1 cells do not cluster as tightly as the PC-3 cells. This suggests there is a large amount of heterogenity within the THP-1 cells and indicates that DESI appears sensitive enough to distinguish between individual cells, potentially allowing for visualisation of biologically differentiated cells. This differentiation could be for example due to age, stress levels or interaction with an external factor.
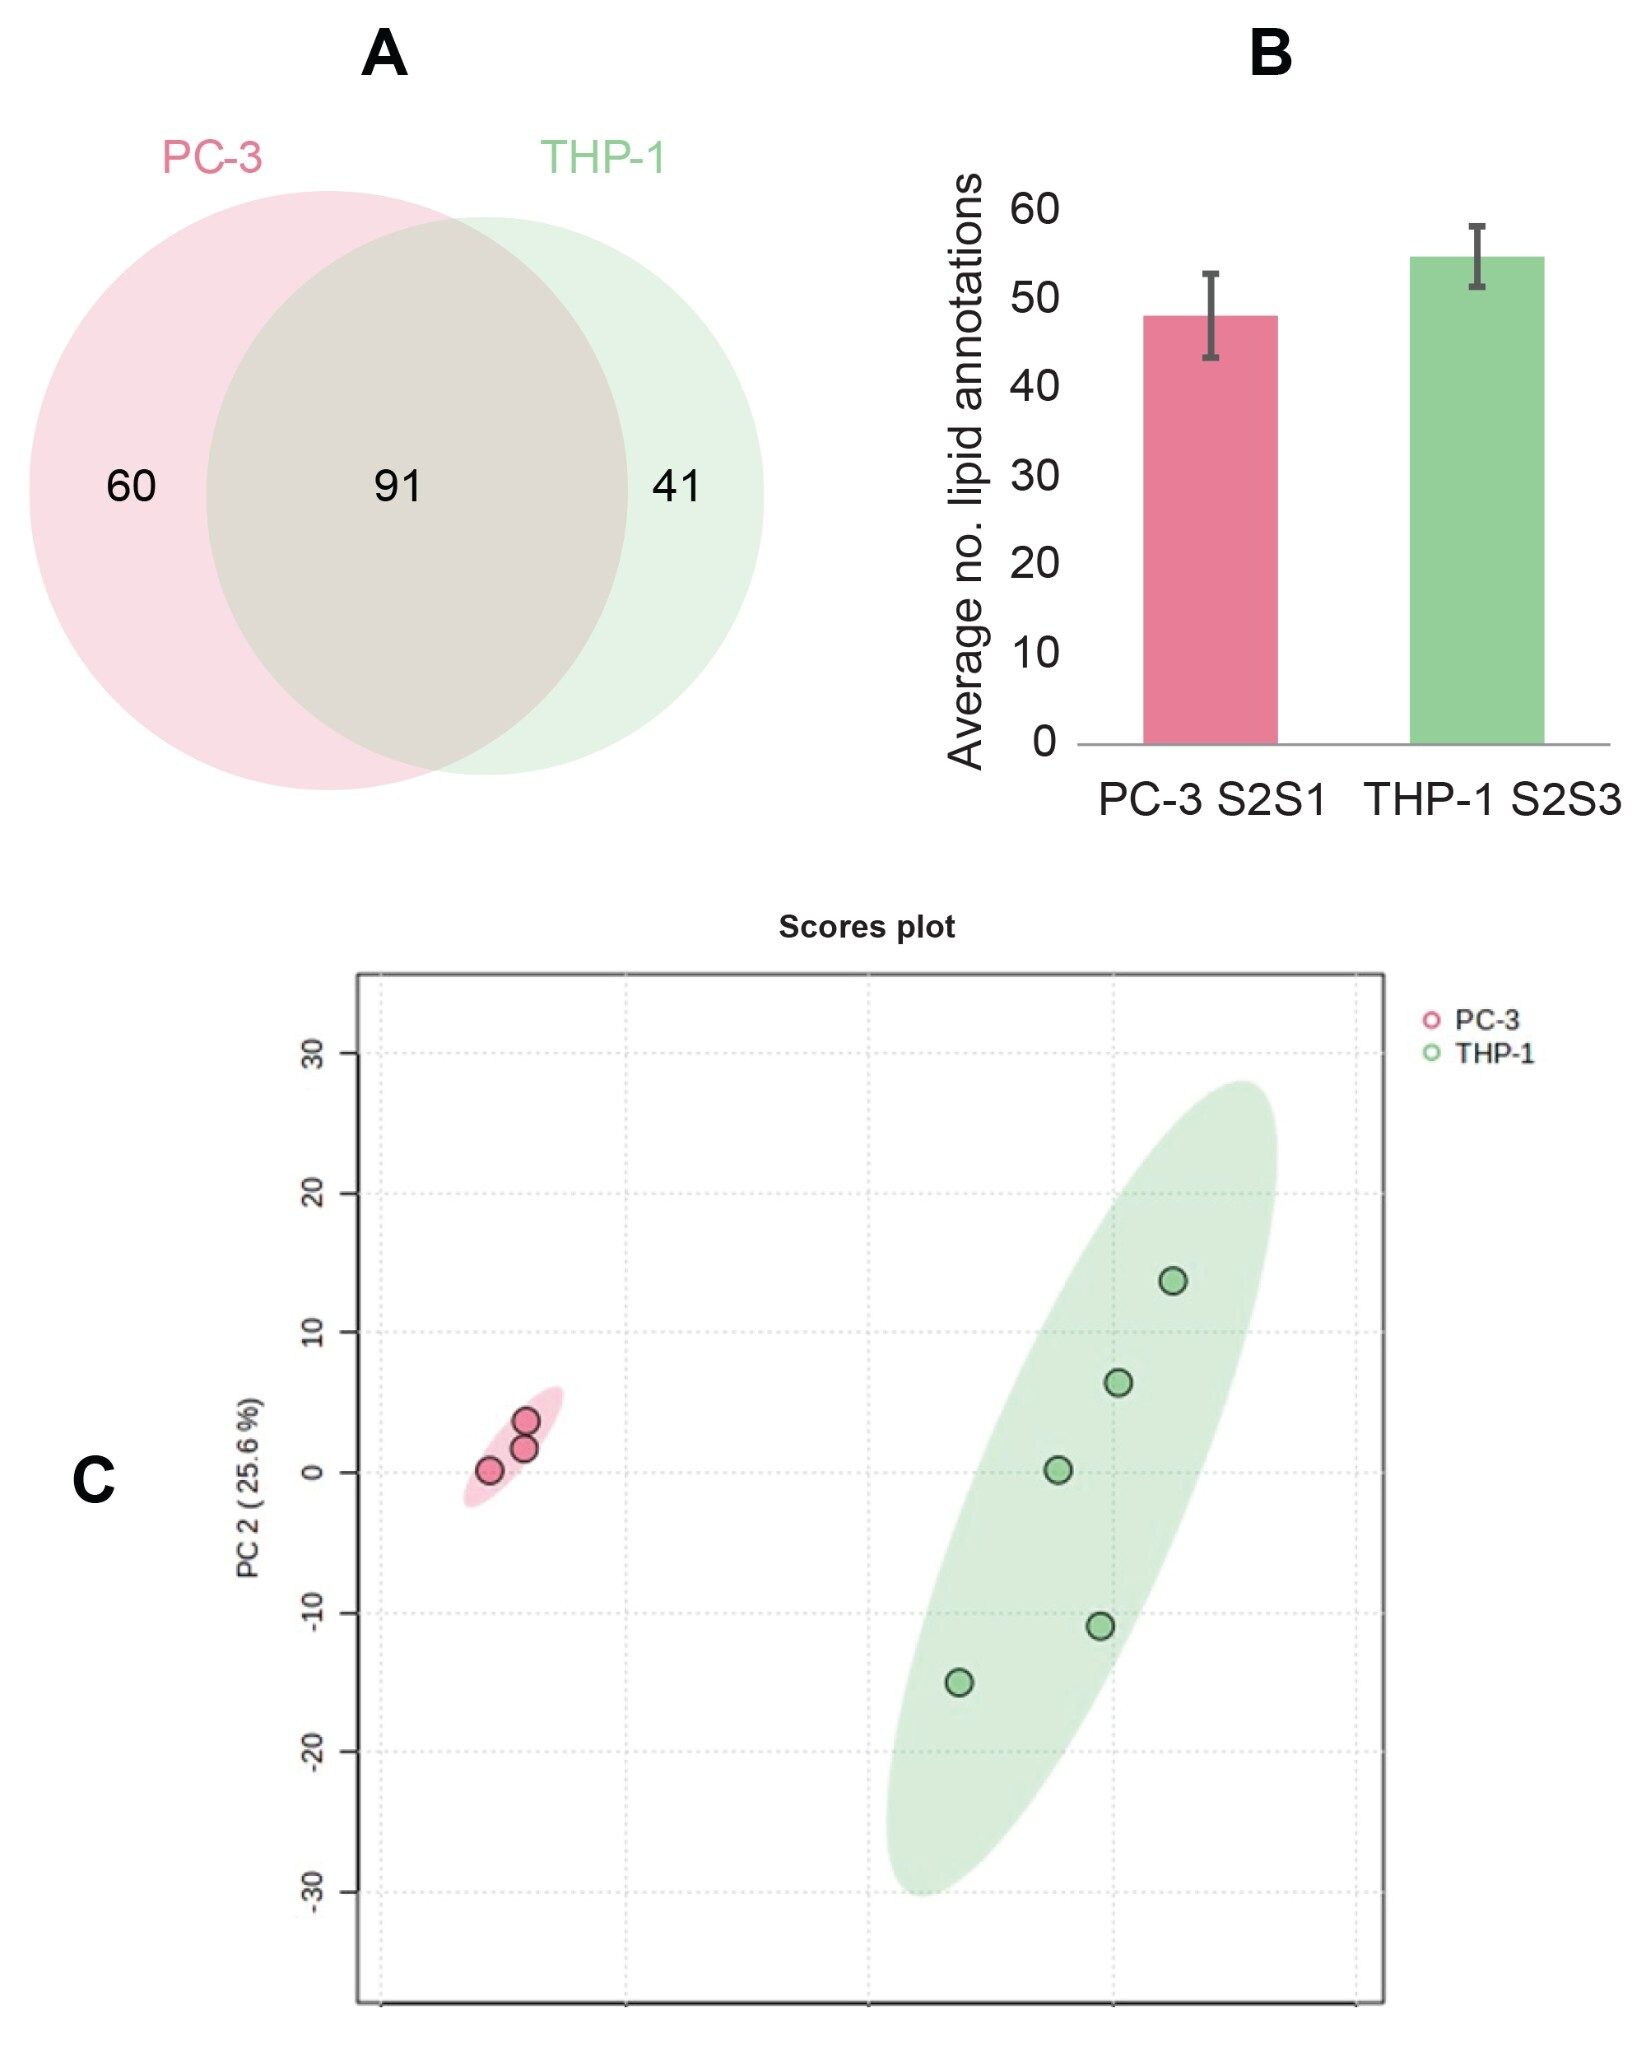 Figure 4. (A) Area-proportional Venn diagram illustrating the overlap of Lipostar annotations in PC-3 cells and THP-1 cells. (B) Box plot showing the average number of lipids identified (Lipostar) split by cell type PC-3 (av=48, n=3) and THP-1 (av=55, n=5). (C) PCA plot generated using Metaboanalyst 6.0.
When the data from a single cell is investigated within MassLynx, spectra can be visualised allowing for determination of individual cell molecular profiles and relative compound intensity. The mass spectra of a single PC-3 cell and a single THP-1 cell can be seen in Figure 5 (A and B respectively). These spectra demonstrate that the two different cell lines have visibly different molecular profiles and that signal obtained from a single cell is strong.
Included also within Figure 5 are the spectral profiles obtained from a cell free region of the same cultured slide: C) PC-3 cell culture, D) THP-1 cell culture. These “blank” spectra profiles were generated combining a similar number of pixels as a single cell. The spectra obtained from a cell free area of the cell cultures show minimal molecular signals particularly in the lipid-region (m/z 450–950). This demonstrates that the slide washing was successful in removing the majority of media and gives confidence that the signals seen for each individual cell are originating from the cell itself.
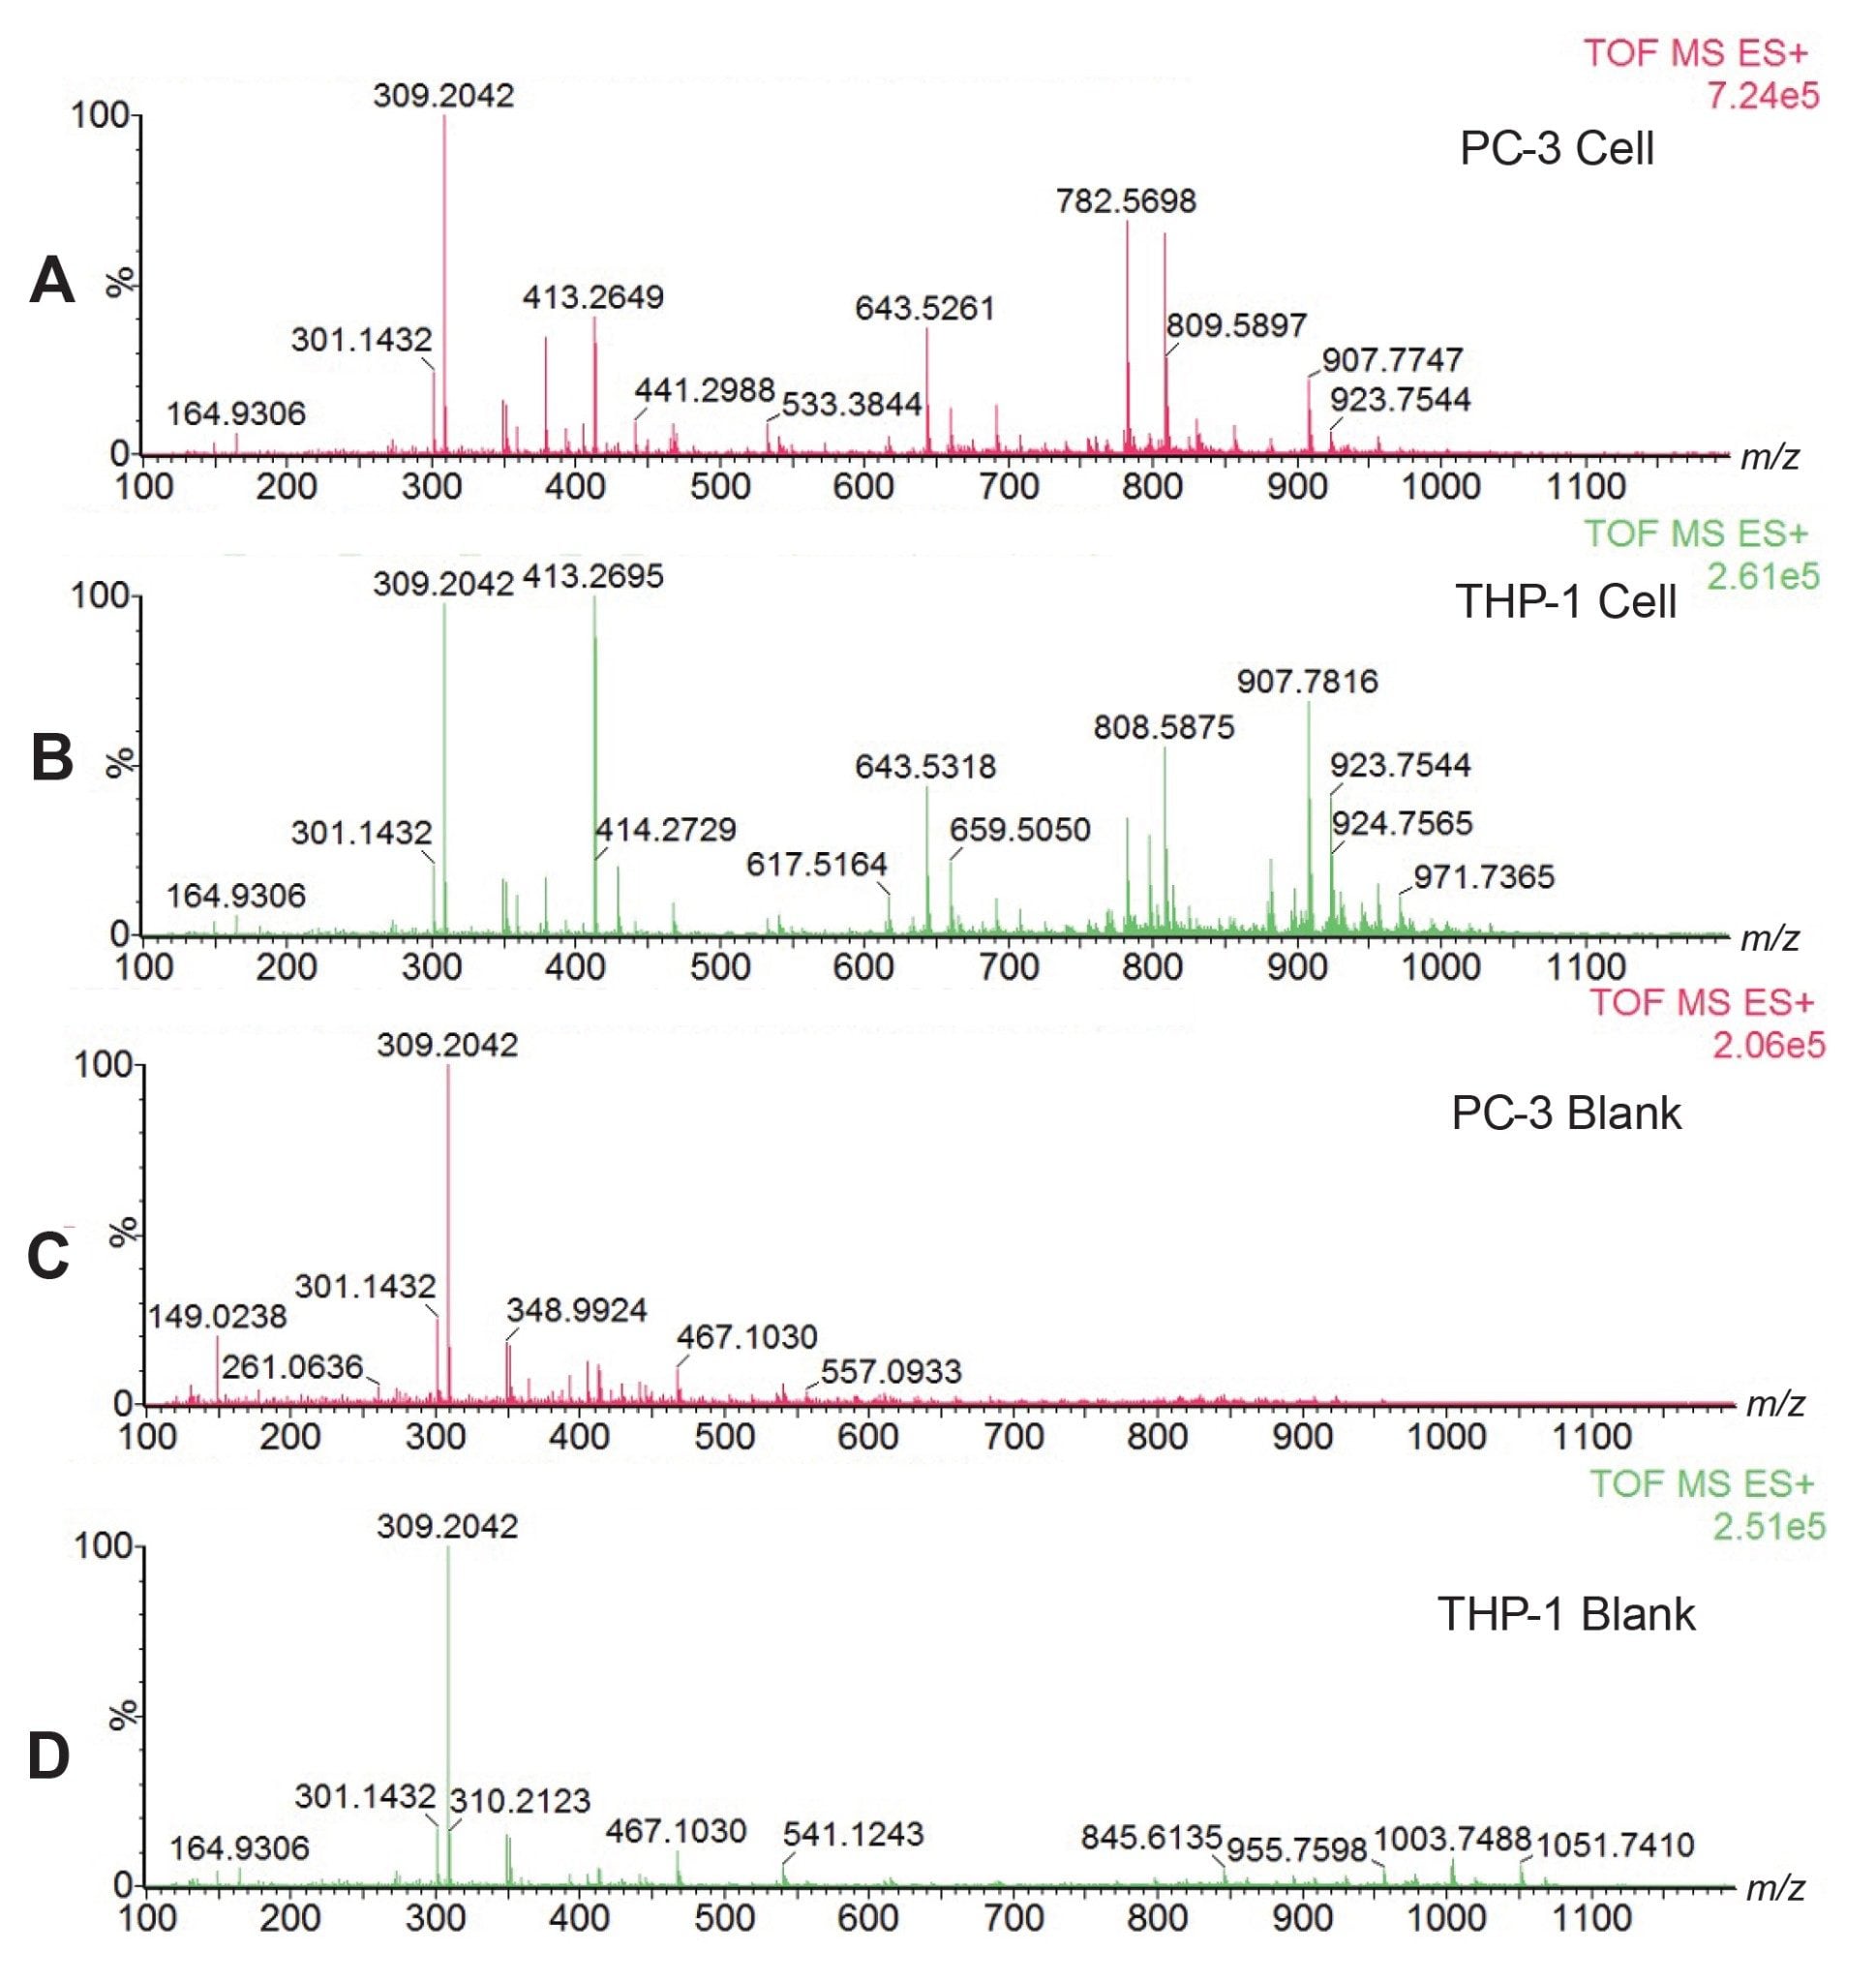 Figure 5. (A) Mass spectrum of a single PC-3 cell (pixels=30) (B), Mass spectrum of a single THP-1 cel (pixels=20), (C) Mass spectrum of a region of no cells on the PC-3 slide and (D) Mass spectrum of a region of no cells on the THP-1 slide (pixels=30).
Conclusion
We have demonstrated that by utilizing a low flow, high resolution, DESI configuration, MS imaging acquisitions can be performed with a 5 µm pixel size and the spatial resolution achieved by the DESI allows the visualization of single cells within tissue, and from non-confluent cell culture analyses.
We have also shown that using DESI-MS >190 lipids were detected in PC-3 and THP-1 cells, with on average ~50 lipids routinely identified from each single cell, this information would valuable for exploring cellular heterogeneity as well as cell type differentiation.
References
- C. Seydel, Nat Methods, 2021, 18, 1452–1456.
- B. Carter and K. Zhao, Nat Rev Genet, 2021, 22, 235–250.
- Mark Towers, Lisa Reid, Emrys Jones, Joanne Ballantyne, Pushing the Boundaries of DESI Imaging with High Spatial Resolution, Waters Application note, 720008551, October 2024.
- Pang, Z., Lu, Y., Zhou, G., Hui, F., Xu, L., Viau, C., Spigelman, A., MacDonald, P., Wishart, D., Li, S., and Xia, J. (2024) MetaboAnalyst 6.0: towards a unified platform for metabolomics data processing, analysis and interpretation Nucleic Acids Research (doi: 10.1093/nar/gkae253)
- Marcus Fruttiger et al, Defective oligodendrocyte development and severe hypomyelination in PDGF-A knockout mice, Development (1999) 126 (3): 457–467.
- Jäkel, S., Agirre, E., Mendanha Falcão, A. et al. Altered human oligodendrocyte heterogeneity in multiple sclerosis. Nature 566, 543–547 (2019). https://doi.org/10.1038/s41586-019-0903-2
- S. Tsuchiya, Y. Kobayashi, Y. Goto, T. Okumura, T. Nakae, M. Konno and K. Tada, Int. J. Cancer, 1980, 26, 171–176.
- W. Chanput, J. J. Mes and H. J. Wichers, Int. Immunopharmacol., 2014, 23, 37–45.
- M. E. Kaighn, K. S. Narayan, Y. Ohnuki, J. F. Lechner and L. W. Jones, Invest. Urol., 1979, 17, 16–23.
Featured Products
720008646, December 2024