The UPLC-MS/MS Analysis of Urine Free-Metanephrines for Clinical Research
僅供研究使用。不能用於診斷程序。
這是一篇應用簡報,不含詳細的實驗內容章節。
Abstract
This application note demonstrates the high analytical sensitivity and quantitative performance of the Xevo TQ-XS IVD Mass Spectrometer for the analysis of urine free-metanephrines for clinical research.
Benefits
- Measurement of urine free-metanephrines using reverse-phase chromatography
- Acid hydrolysis or enzymatic deconjugation that is typically required to measure both free- and conjugated-metanephrines is not required
- Urine free-metanephrine are thought to offer superior clinical performance to the traditionally used fractionated-metanephrines
Introduction
Metanephrine and normetanephrine are inactive metabolites of catecholamines. The primary catecholamines are dopamine, epinephrine, and norepinephrine and these are released in response to physical or emotional stress. They help transmit nerve impulses in the brain, increase glucose and fatty acid release for energy as well as dilate small air passages in the lungs. Norepinephrine also constricts blood vessels, which results in an increase in blood pressure, and epinephrine increases heart rate and metabolism. Norepinephrine breaks down into normetanephrine, and epinephrine becomes metanephrine and then are excreted in the urine.
These metabolites are usually present in the urine in fluctuating amounts as either unconjugated (i.e. free) or conjugated to sulphate, that increase significantly during and shortly after the body is exposed to stress. Rare phaeochromocytomas and other neuroendocrine tumors, however, can produce large amounts of catecholamines, resulting in greatly increased concentrations of the hormones and their metabolites in both the blood and urine. Historically, both the conjugated and free forms (typically referred to as fractionated metanephrines) have been quantified when testing for phaeochromocytomas. Recent evidence has indicated that the urinary-free metanephrines offer a more specific marker for tumoural metanephrine production. Measurement of urine-free metanephrines removes the need for acid hydrolysis or enzymatic deconjugation that would be needed to measure urinary-fractionated metanephrines.
Clinical researchers are often interested in measuring elevated concentrations of urinary metanephrines. However, these compounds can be a challenge to analyze via reversed-phase LC-MS/MS due to their polarity. As a result, many research laboratories still analyze this panel using ion-pairing reagents and electrochemical detection (ECD). While reversed-phase LC-MS/MS has been used successfully, challenges still exist due to ion-suppression from urine matrix components, insufficient retention, and inadequate separation of normetanephrine and epinephrine. HILIC methods have been successfully used, however they can be challenging to implement.
Here we describe a reversed-phase UPLC-MS/MS clinical research method that employs a mixed-mode SPE procedure and combines it with a reversed-phase chromatographic separation using the Waters ACQUITY™ UPLC™ HSS™ PFP Column and detection on the Xevo™ TQ-XS IVD Mass Spectrometer. This results in a rapid and analytically sensitive method with excellent linearity, precision, and minimal matrix effects for clinical research.
 Figure 1. ACQUITY™ UPLC™ I-Class FTN IVD and Xevo TQ-XS IVD Mass Spectrometer.
Experimental
Sample Preparation and UPLC-MS/MS Analysis
Commercial calibrators (6PLUS1 Multilevel Urine Calibrator Set MassChrom Catecholamines, free Metanephrines, Serotonin in urine) were purchased from Chromsystems® (Gräfelfing, Germany) and prepared according to manufacturer’s instructions. The calibration ranges were 14–11,941 nmol/L for metanephrine, 27–11,031 nmol/L for normetanephrine, and 43–7,385 nmol/L for 3-methoxytyramine. The QC samples were ChromSystems: MassCheck Catecholamines, free Metanephrines, Serotonin Urine Control Level I and II at 414 nmol/L and 3,427 nmol/L for metanephrine, 459 nmol/L and 3,303 nmol/L for normetanephrine, and 399 nmol/L and 1943 nmol/L for 3-methoxytyramine. Water, acetonitrile, and formic acid were purchased from Merck (Gillingham, UK).
To convert SI units (nmol/L) to conventional mass units (ng/mL), divide by 5.06 for metanephrine, 5.46 for normetanephrine, and 5.98 for 3-methoxytyramine.
Unacidified urine samples (110 µL) were pre-treated with 110 µL of water containing 70 ng/mL of internal standard. Oasis™ WCX SPE µElution plate 2 mg 30 µm plates (p/n: 186002499) were conditioned with 200 µL of 85% acetonitrile + 1% formic acid followed by 200 µL of water, drying down with positive pressure after each step. 175 µL of the sample/internal standard mix was added to each well and passed through the plate using positive pressure. Each well was then treated with 200 µL of water followed by 200 µL of acetonitrile, again drying each well by positive pressure after each step. Target analytes were eluted from the sorbent bed with 60 µL of 85% acetonitrile + 1% formic acid into a 96-well sample collection plate (p/n: 186002482). Samples were evaporated to dryness and reconstituted in 500 µL of water.
Samples were subsequently injected (10 µL) onto an ACQUITY UPLC I-Class FTN System and Xevo TQ-XS IVD Mass Spectrometer, utilizing a water/acetonitrile gradient with each containing 0.1% formic acid and an ACQUITY UPLC HSS PFP Column, 2.1 x 100 mm, 1.8 µm (p/n: 186005967) heated to 35 °C as shown in Table 1.
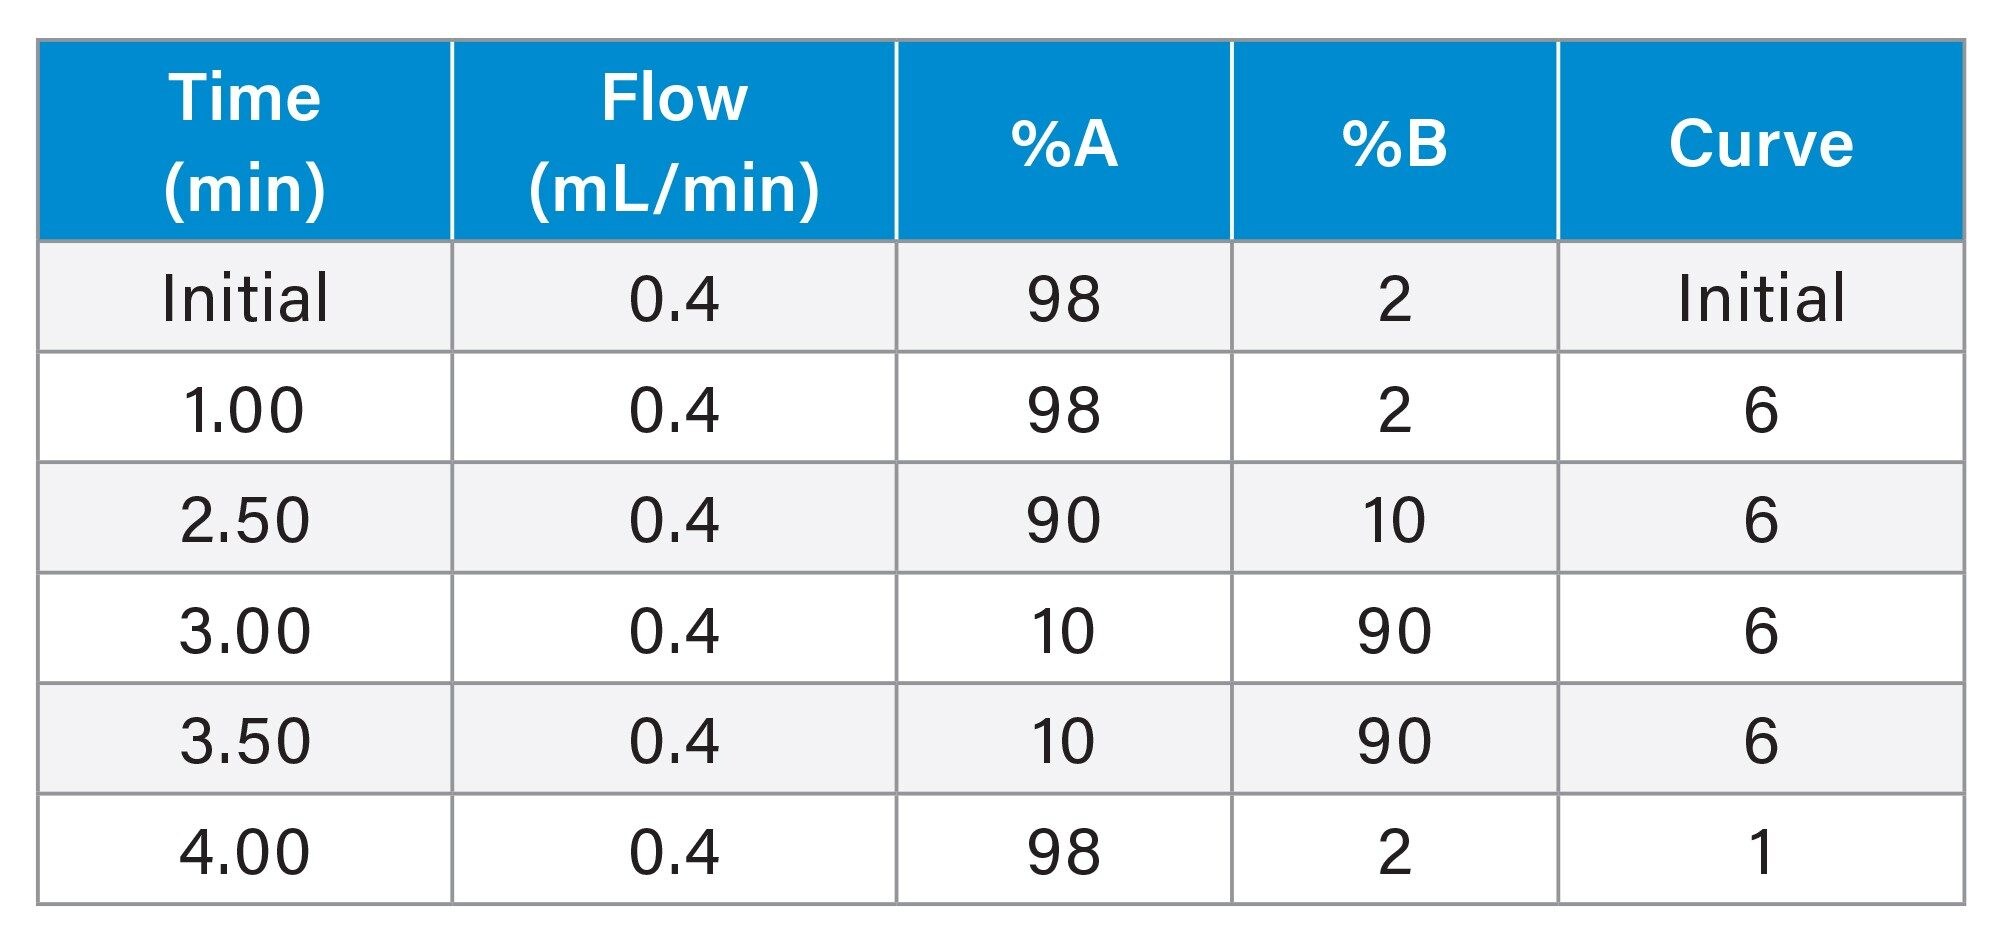 Table 1. Gradient Table for the separation of metanephrine, normetanephrine and 3-MT, having a total run time of 5.0 minutes.
Multiple Reaction Monitoring (MRM) transitions, quantifier (quan), and qualifier (qual), for the detection of all analytes are shown in Table 2, having a capillary voltage of 0.5 kV in electrospray positive ionization mode, with resolution settings at 0.7 FWHM for MS1 and MS2.
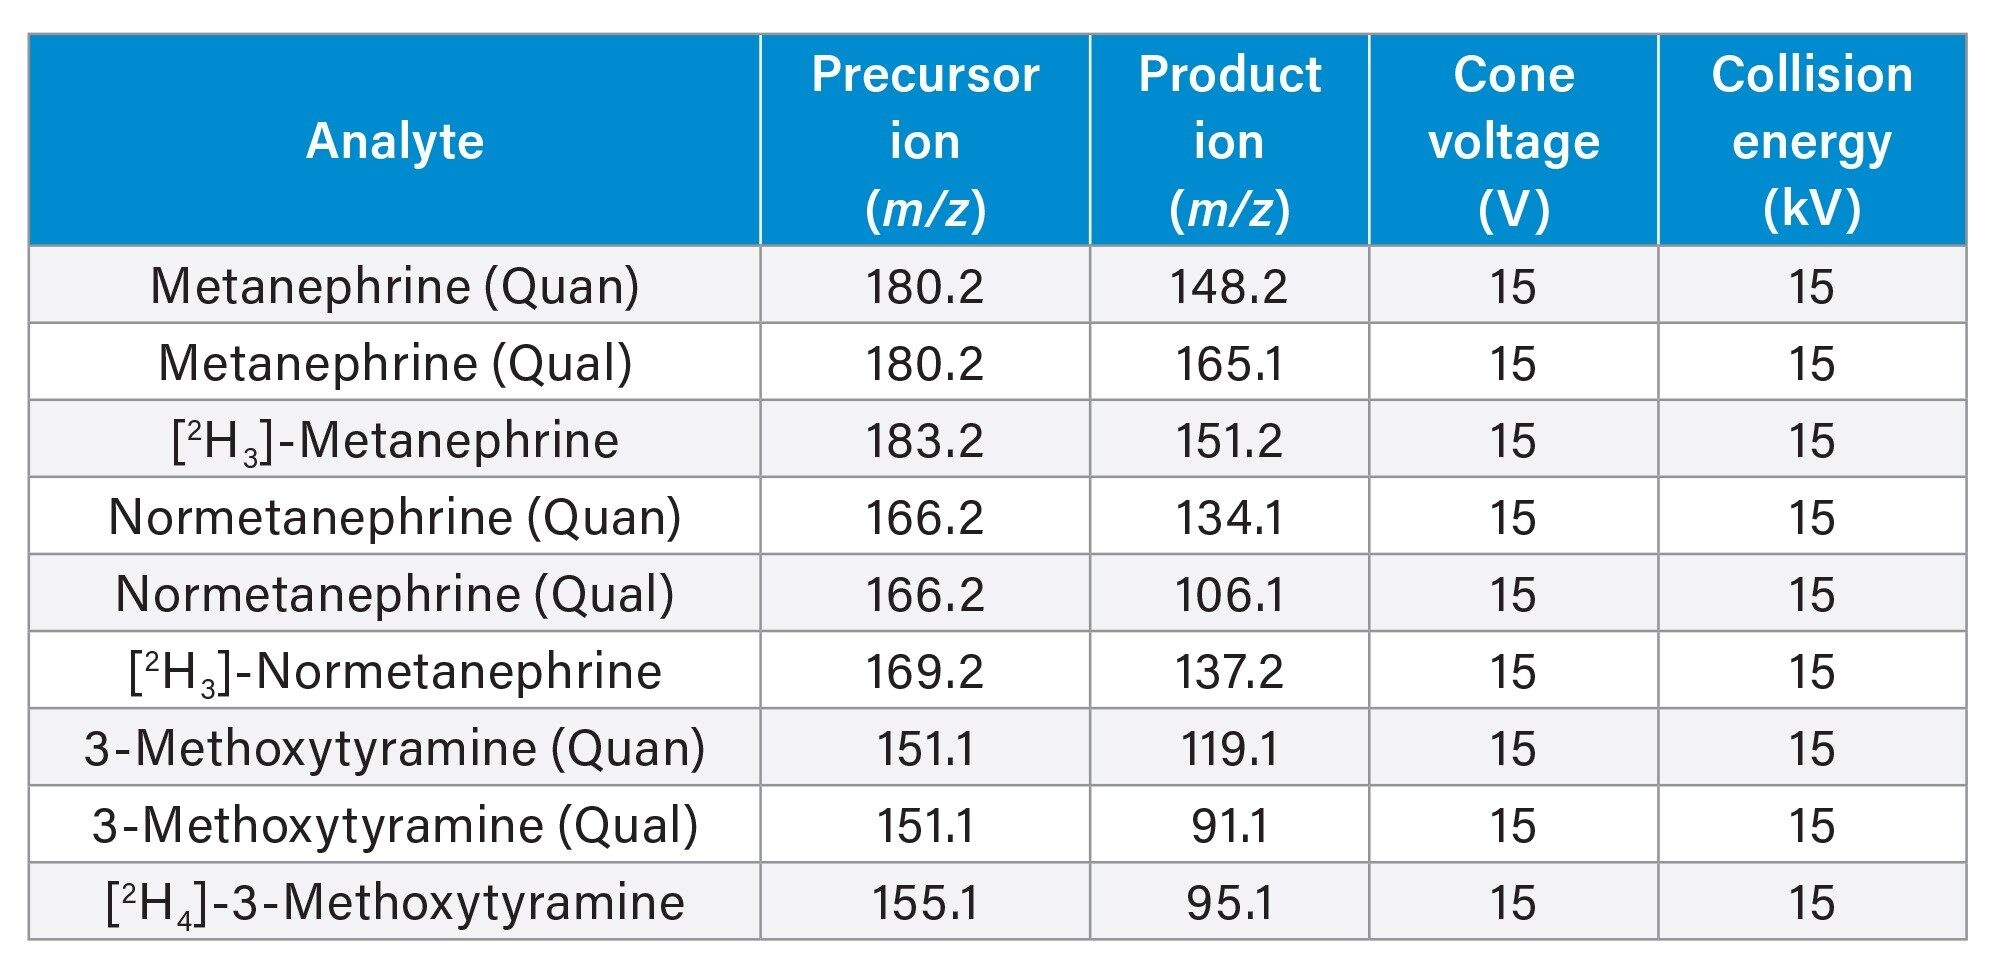 Table 2. MRM parameters of Metanephrine, Normetanephrine, and 3-MT quantifier ions, qualifier ions and their internal standards.
Results and Discussion
Chromatographic separation was achieved for metanephrine, normetanephrine and 3-methoxytyraine having an injection-to-injection time of approximately 5.5 minutes. A typical chromatogram is shown in Figure 2.
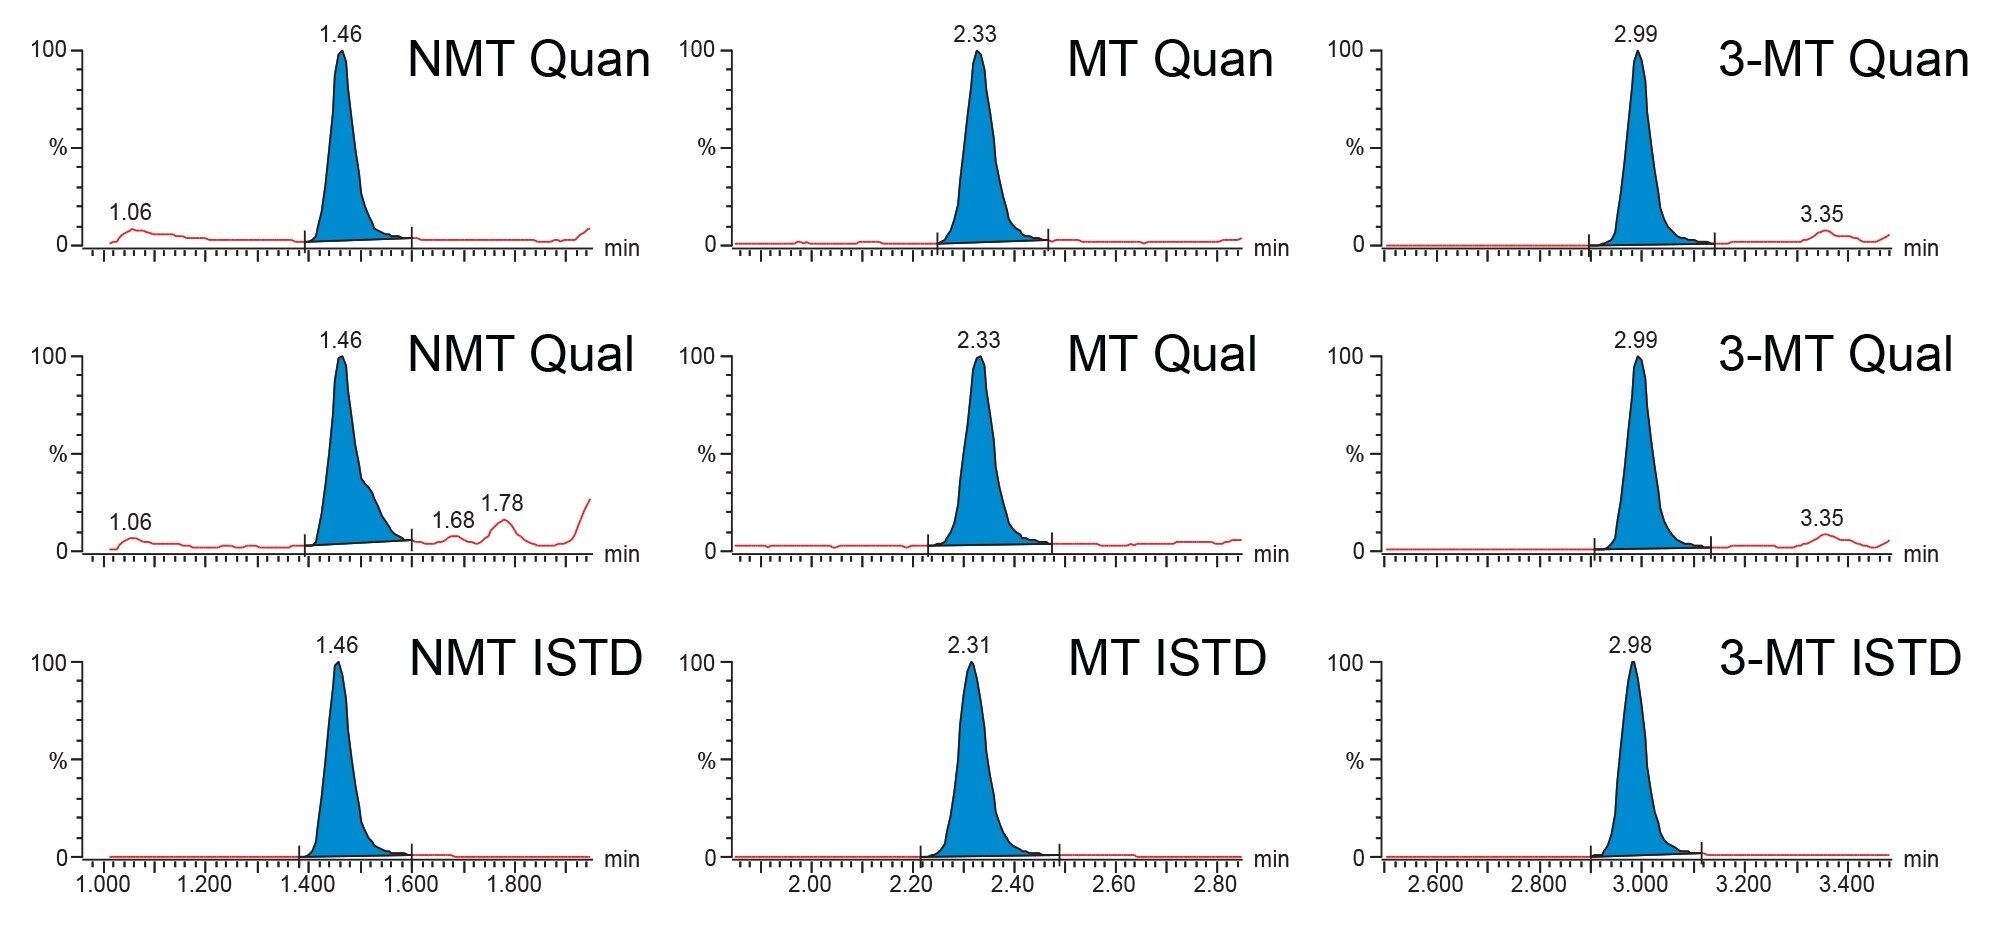 Figure 2. Typical Chromatograms of normetanephrine (NMT), metanephrine (MT) and 3-methoxytyramine (3-MT) of the calibrator 1 sample at 23.0 nmol/L, 14.9 nmol/L and 37.1 nmol/L respectively.
Calibration curves were shown to be linear over the calibration ranges described, having correlation coefficients of >0.99 and %bias of within ± 15% (± 20% for Calibrator 1) for metanephrine, normetanephrine, and 3-methoxytyramine across eight occasions.
Recovery was determined by spiking five separate urine samples with known concentrations of analyte standard covering the analytical concentration range and calculated as (spike result – base result)/spike added. %Recoveries were found to be 103% (88–111%) for metanephrine, 109% (90–117%) for normetanephrine, and 103% (96–111%) for 3-methoxytyramine.
Intra-assay precision performance was assessed by extracting and analyzing eight replicates of five different samples at low to high concentrations on one occasion. Intra-assay precision were ≤10.7% CV for all analytes for all concentration levels and is summarized in Table 3.
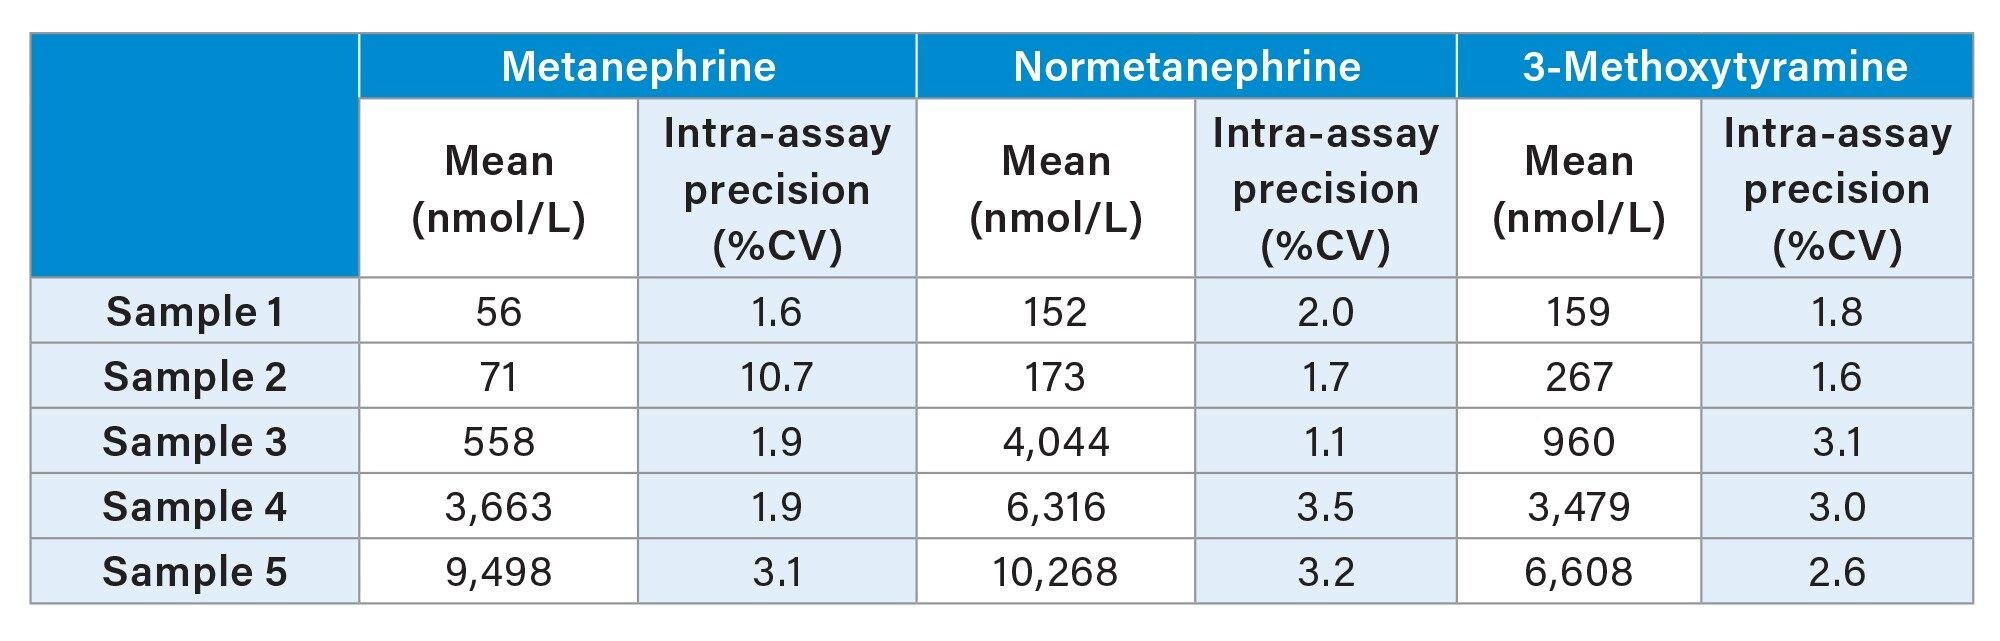 Table 3. Intra-Assay Precision Performance Summary of Metanephrine, Normetanephrine and 3-Methoxytyramine.
Inter-assay precision performance was assessed by extracting and analyzing a single replicate of five different samples at low to high concentrations on five different occasions. Inter-assay precision were ≤4.0% CV for all analytes for all concentration levels and is summarized in Table 4.
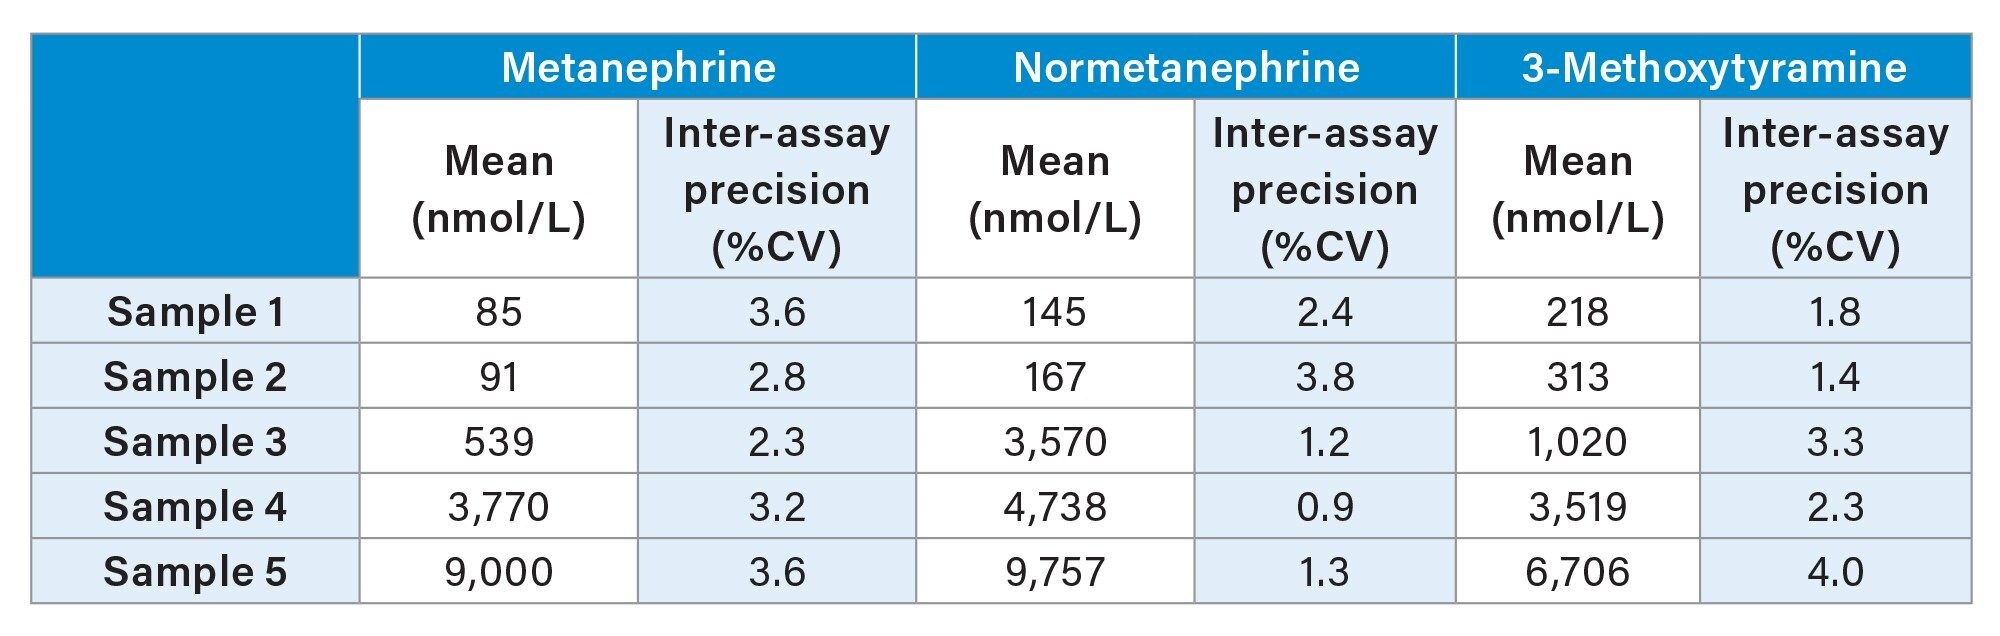 Table 4. Inter-Assay Precision Performance Summary of Metanephrine, Normetanephrine and 3-Methoxytyramine.
Little to no carryover was observed when comparing peak areas of protected blank samples to those following a high spiked sample for metanephrine, normetanephrine and 3-methoxytyramine. Dilution testing also showed that samples can be diluted up to one in three to yield results of within ± 15%, with the exception of 3-methoxytyramine, which can be diluted to one in one. Samples were also shown to be stable for up to 48 hours on instrument following extraction at 4 °C.
Matrix effect investigations were performed using urine from six individuals. The endogenous peak areas were separately quantified and post-spiked samples at low, mid, and high concentration levels were adjusted using the mean peak areas to enable comparison to solvent spiked samples. Whilst some suppression and enhancement in the matrix factor results was observed when looking at the peak areas, these were compensated for by the internal standard (Table 5).
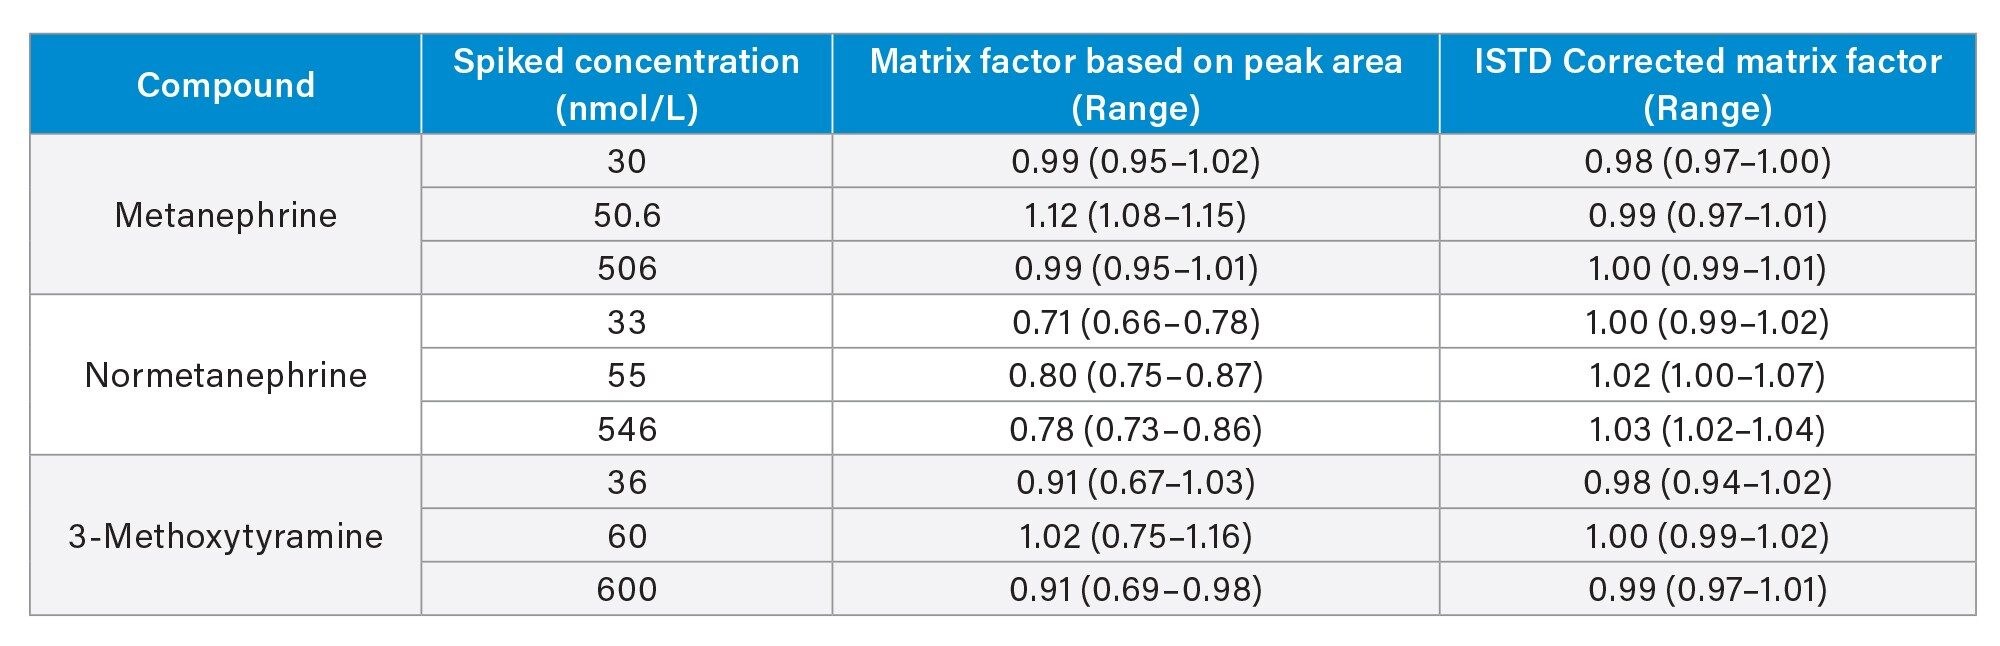 Table 5. Matrix Factor Summary for Metanephrine, Normetanephrine and 3-Methoxytyramine.
Accuracy was assessed by analyzing RCPA Quality Assurance Program samples, 60 for metanephrine, 34 for normetanephrine and 30 for 3-methoxytyramine. The comparison results can be seen in Table 6 and Figures 3–5 and show excellent agreement with minimal bias to the EQA scheme results.
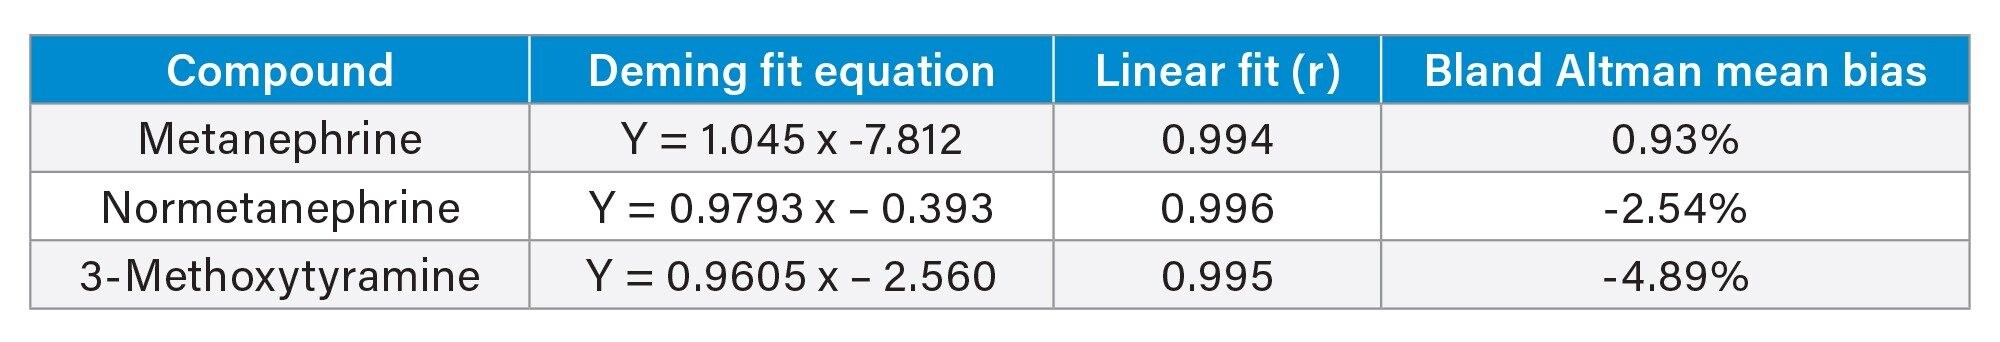 Table 6. Accuracy Summary for Metanephrine, Normetanephrine and 3-Methoxytyramine.
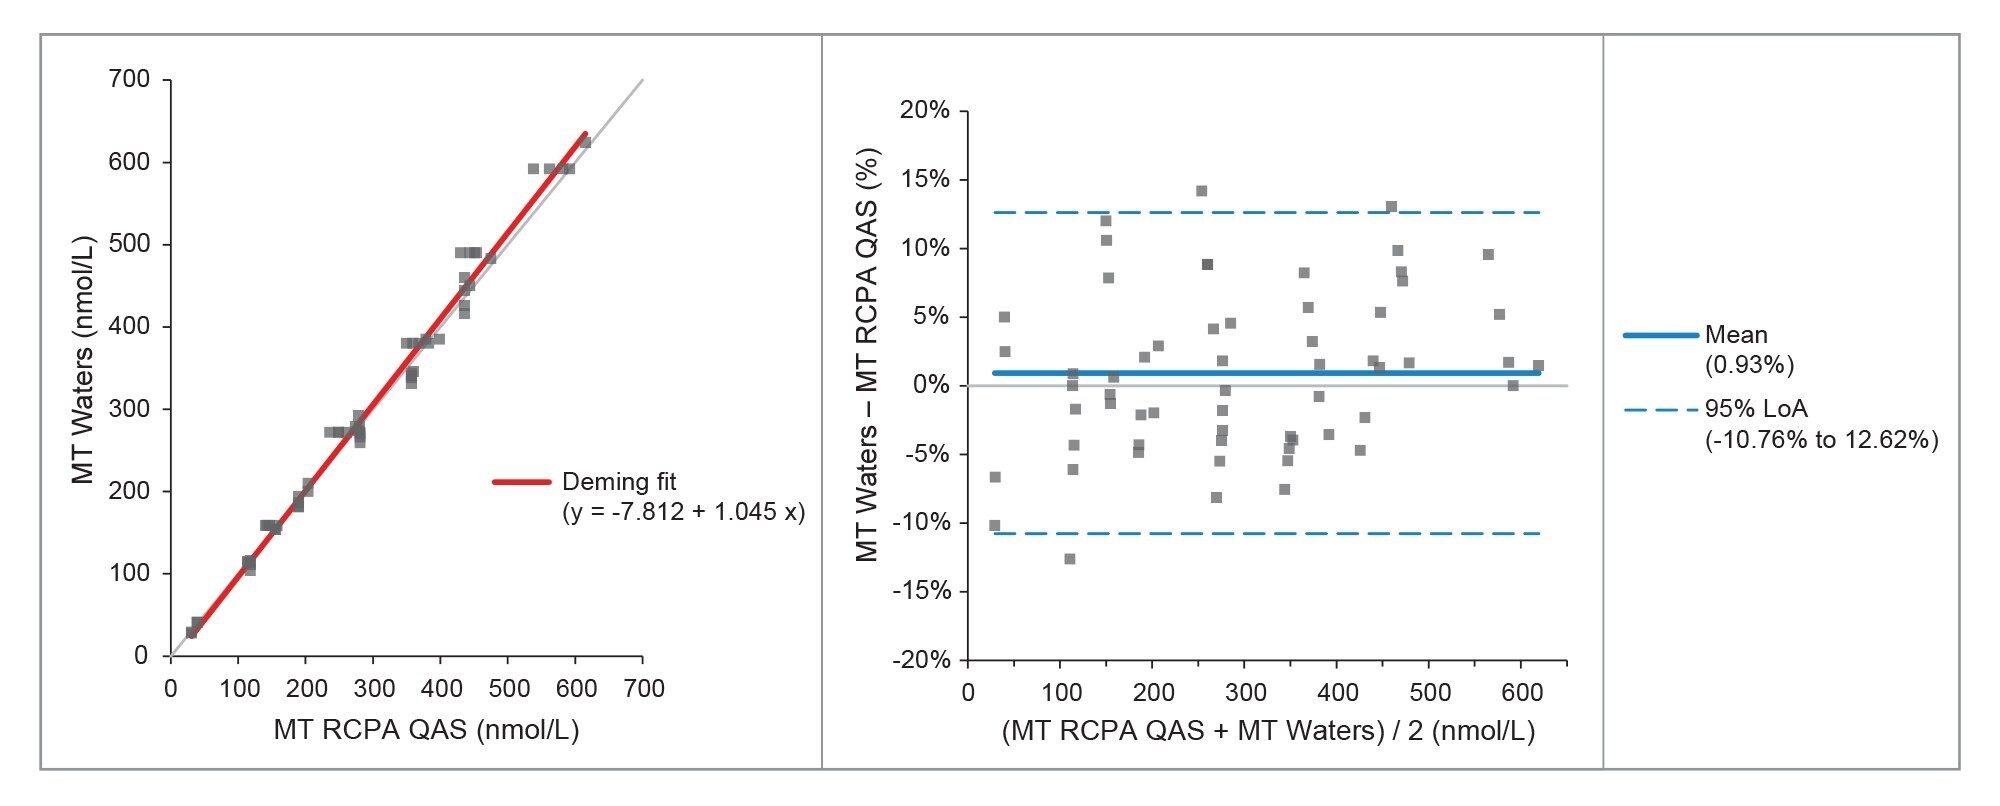 Figure 3. Deming Fit and Bland Altman Plots for Comparison with the RCPA QAS for Metanephrine.
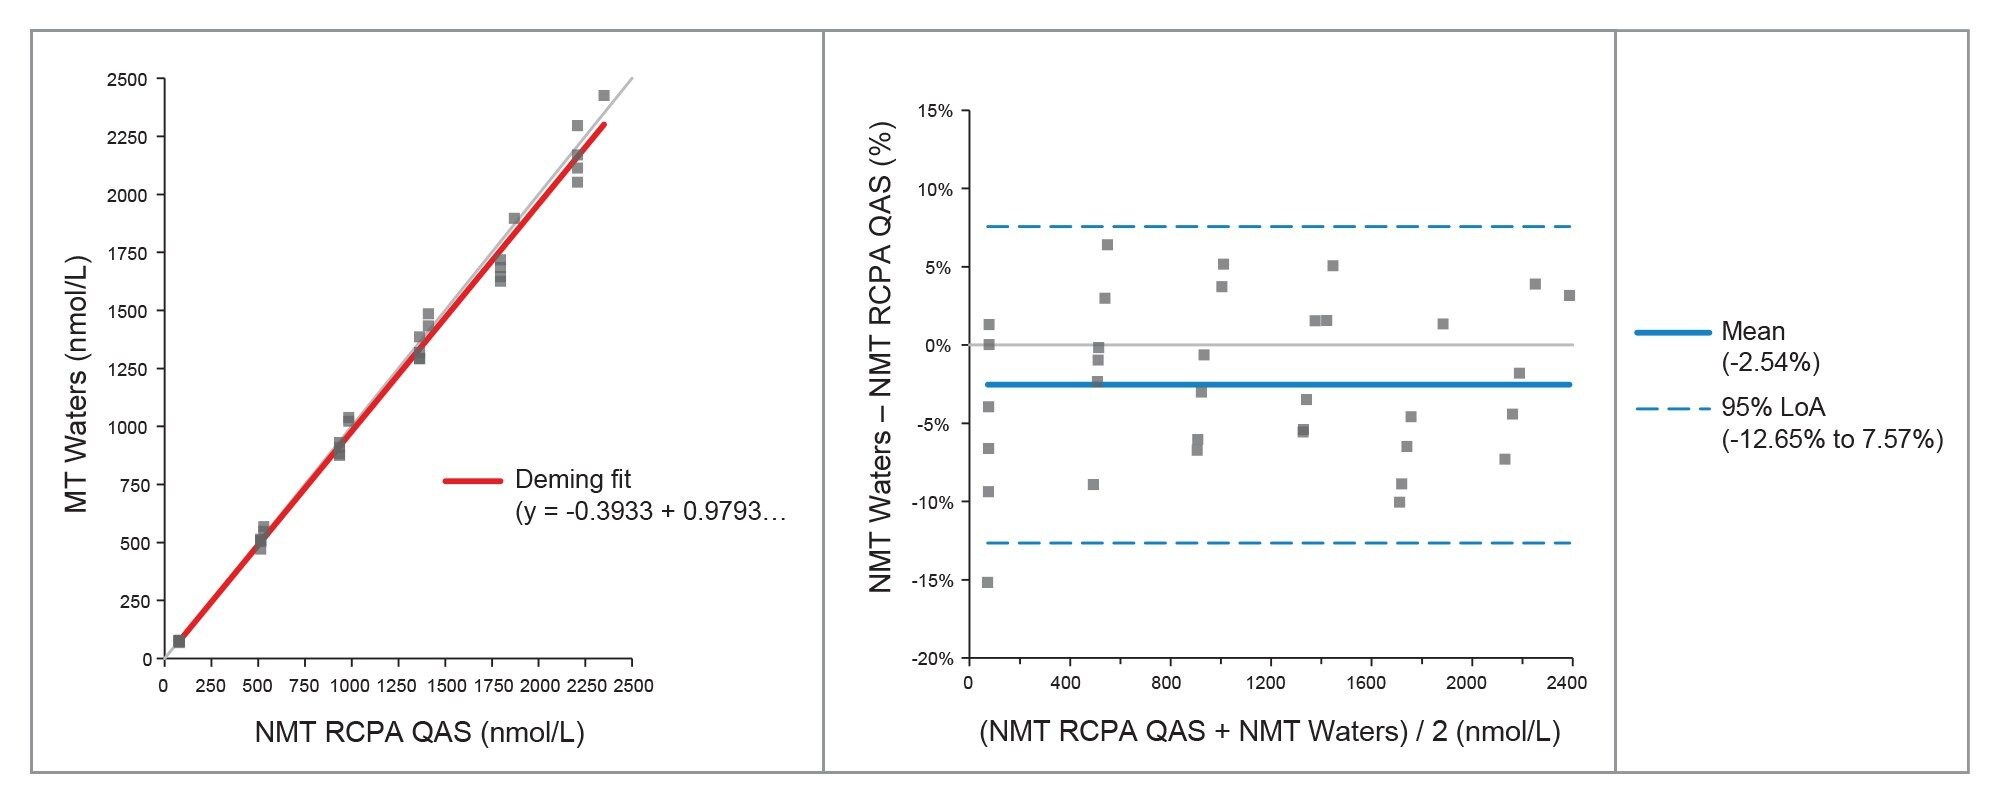 Figure 4. Deming Fit and Bland Altman Plots for Comparison with the RCPA QAS for Normetanephrine.
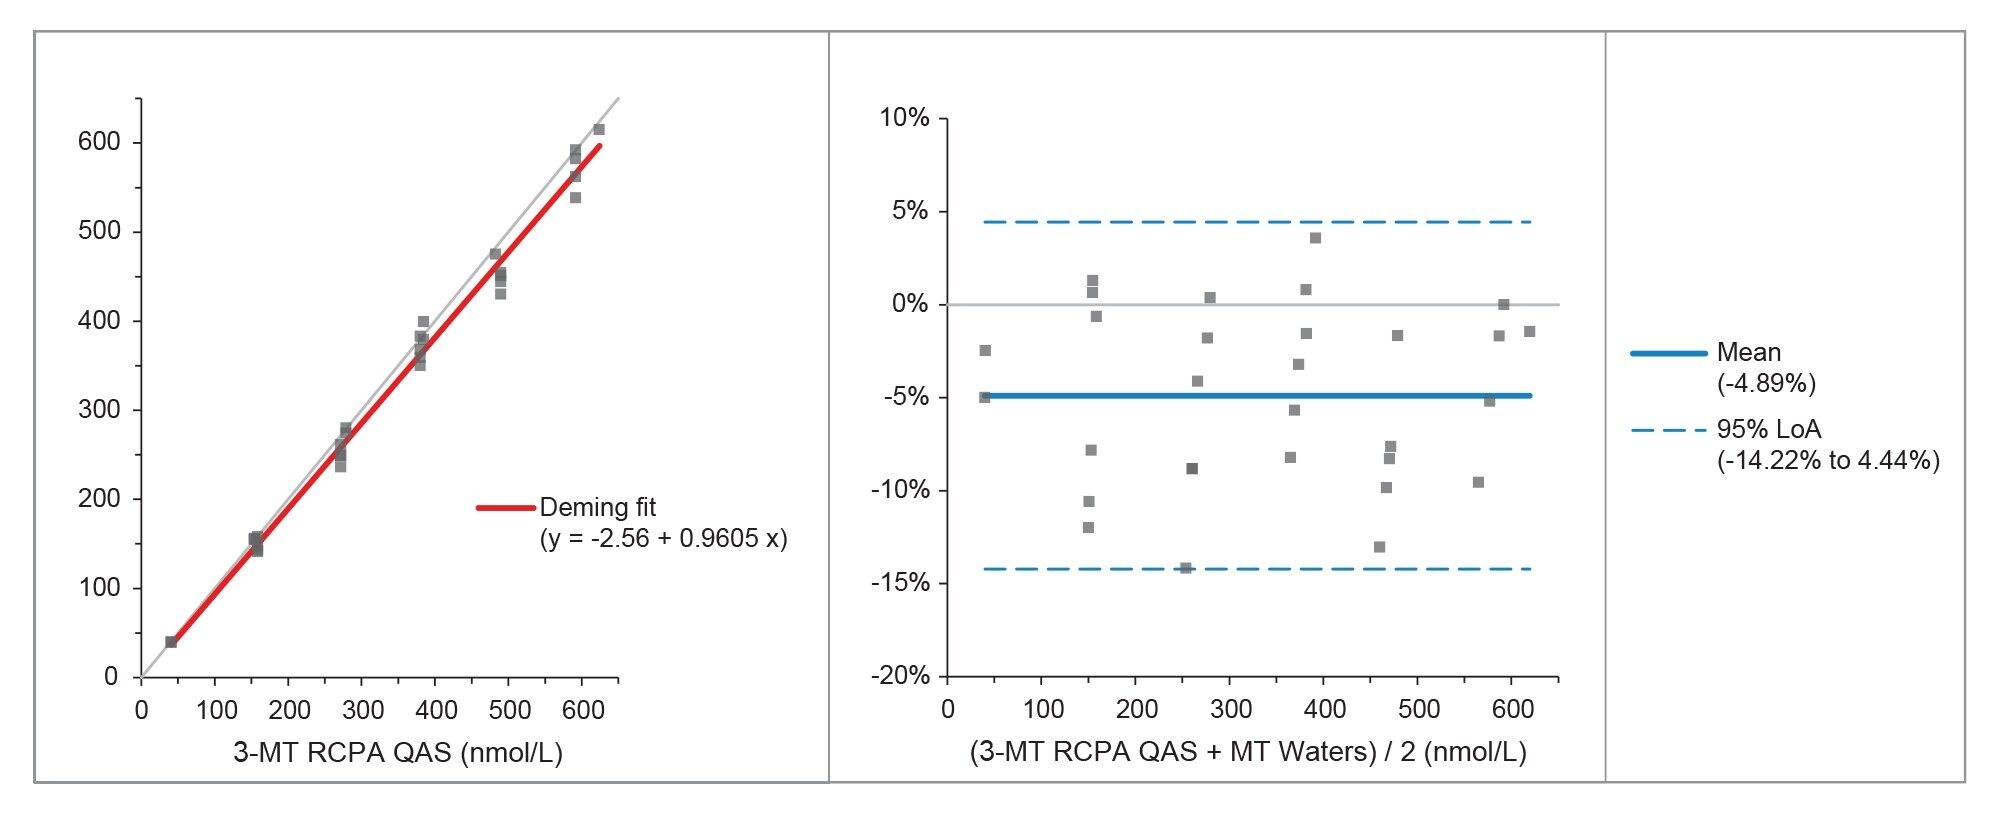 Figure 5. Deming Fit and Bland Altman Plots for Comparison with the RCPA QAS for 3-Methoxytyramine.
Conclusion
A clinical research method has been developed for the analysis of metanephrine, normetanephrine and 3-methoxytyramine from human urine, having the following method performance characteristics:
- Calibration curves had correlation coefficients (r2) of >0.99 for all analytes for all runs
- Intra-assay and inter-assay precision results of ≤10.7% CV
- No significant carryover was observed when blank samples were injected immediately after a high-level sample
- Little to no ion suppression was observed from six individuals when comparing calculated concentrations to control samples
- The clinical research method was shown to have good agreement when compared to the RCPA Quality Assurance Scheme
720008227, February 2024