This application note demonstrates a wide linear dynamic range with 5.0% deviations typically above 2.5 AU using ACQUITY UPLC System and ACQUITY UPLC Photodiode Array Detector. Linearity tests of a main component and its 0.01% impurity were shown to be easily validated.
There are two characteristics that determine the value of a detector: performance at low noise levels and a wide linear dynamic range. These are crucial for applications such as quantitative impurity analysis to analyze both a large amount of parent compound and low-level impurity peaks (<0.05%) within the same chromatogram, and for food safety and environmental applications where the levels of the compounds of interest can vary dramatically. Designed for the resolution, speed, and sensitivity of Ultra Performance LC (UPLC), the ACQUITY UPLC Photodiode Array (PDA) Detector is ideal for such tasks, with a linear dynamic range that extends over more than four orders of magnitude and is in excess of 2.0 AU. Combined with low noise characteristics,1 the ACQUITY UPLC PDA allows for the validation of linearity for both high-and low-level components (<0.01%) and quantitation over a wide concentration range.
System: |
ACQUITY UPLC System with the ACQUITY UPLC PDA Detector and Empower Software |
Flow cells: |
125 mg/mL: Analytical Cell 50 mg/mL: High Sensitivity Cell |
Mobile phase: |
A: Methanol B: Methanol with Propyl Paraben |
Gradient: |
1% to 97% B in 4% steps, with a 3 min duration |
Flow rate: |
1 mL/min |
Pressure: |
4,000 psi (restrictor) |
Wavelength: |
254 nm |
Bandwidth: |
1.2 nm |
Data rate: |
10 Hz |
Time constant: |
0.2 sec |
System: |
ACQUITY UPLC System with PDA (Analytical Flow Cell) and Empower |
Column: |
ACQUITY UPLC BEH C18 2.1 x 50 mm, 1.7 μm |
Injection volume: |
2 μL, Full Loop |
Sample: |
Prilocaine: 2 mg/mL (100%) o-Toluidine: 0.2 μg/mL (100%) |
Mobile phase: |
A: 75/25 10 mM Ammonium B: Bicarbonate pH 9.5/Acetonitrile |
Flow rate: |
800 μL/min |
Temp.: |
40 °C |
Weak wash: |
1000 μL 75/25 Water/Acetonitrile |
Strong wash: |
200 μL 25/75 Water/Acetonitrile |
Wavelength: |
230 nm |
Bandwidth: |
1.2 nm |
Data rate: |
20 Hz |
Time constant: |
0.1 sec |
System: |
ACQUITY UPLC System with PDA (Analytical Flow Cell)and Empower |
Column: |
ACQUITY UPLC BEH C18 2.1 x 50 mm, 1.7 μm |
Injection volume: |
2 μL, Full Loop |
Sample: |
2,4-D in 50/50 Water/Acetonitrile 0.410 to 800 μg/mL |
Mobile phase: |
A: 70/30 Water/Acetonitrile B: 0.1% Formic acid |
Flow rate: |
650 μL/min |
Temp.: |
35 °C |
Weak wash: |
800 μL 75/25 Water/Acetonitrile |
Strong wash: |
200 μL 20/80 Water/Acetonitrile |
Wavelength: |
230 nm |
Bandwidth: |
1.2 nm |
Data rate: |
10 Hz |
Time constant: |
Normal |
The linearity of a detector is governed by the degree of stray light. The less stray light that is present in an optical detector, the wider its linear dynamic range. For maximum linearity performance, the ACQUITY UPLC PDA has two low-light level flow cell options for use with 2.1 mm i.d. columns: the analytical flow cell with a 10 mm path length, and the high-sensitivity flow cell with a 25 mm path length. Figures 1 and 2 demonstrate the linear ranges for the analytical and high sensitivity flow cells, respectively. Both flow cells typically have 5.0% deviation values above 2.5 AU, while deviations at 2.0 AU are typically below 2.0% (with a specification of less than 5.0%).
It is important for quantitative impurity analysis to have a detector with a wide linear dynamic range to accurately quantitateboth the main component and impurities in the same chromatogram, and to meet validation requirements for linearity. The linear range of the main component must be validated2 from 80%–120%, with typical acceptance criteria for R2 values in excess of 0.9995 for the calibration curve. For quantitation of impurities, linearity must be validated over an extended range as impurity levels may be more susceptible to fluctuations. Typical acceptance criteria for the linearity of impurities are R2 values in excess of 0.995 for the calibration curve. To demonstrate these validation requirements, Prilocaine and its impurity, o-Toluidine (Figure 3) were analyzed in duplicate at seven concentration levels. The validated range was 80%–100% for prilocaine, and 50%–150% for o-toluidine. The acceptance criteria were met as the prilocaine R2 value was 0.9998 and the o-toluidine R2 value was 0.998 (Figure 4).
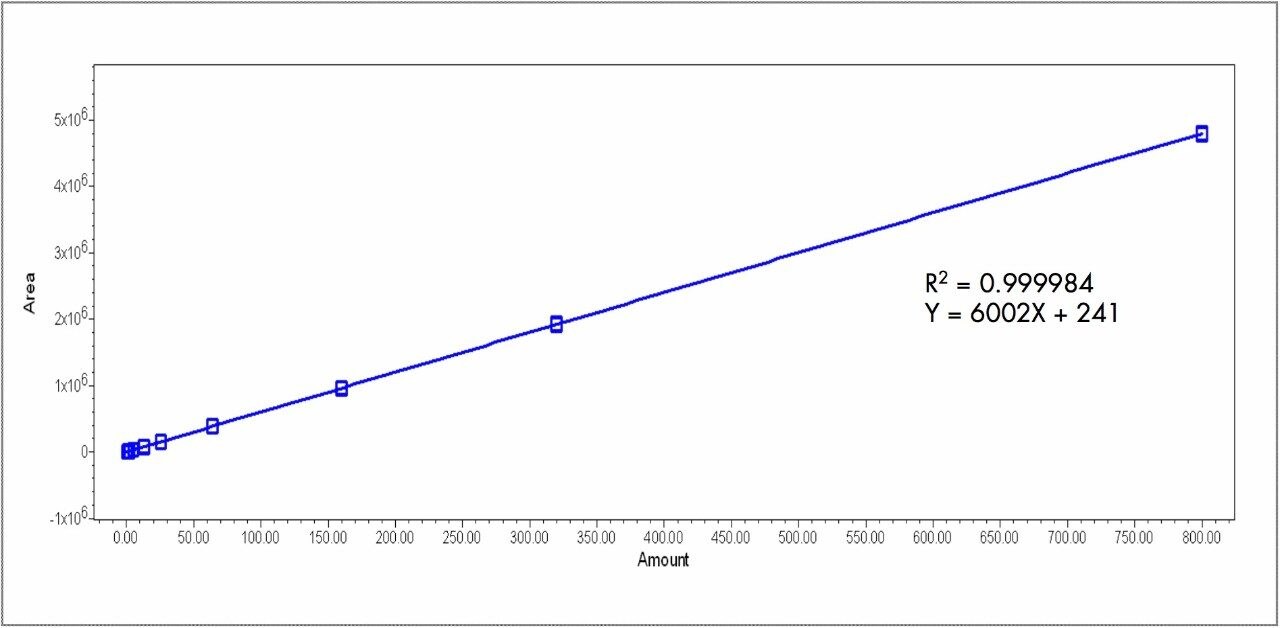
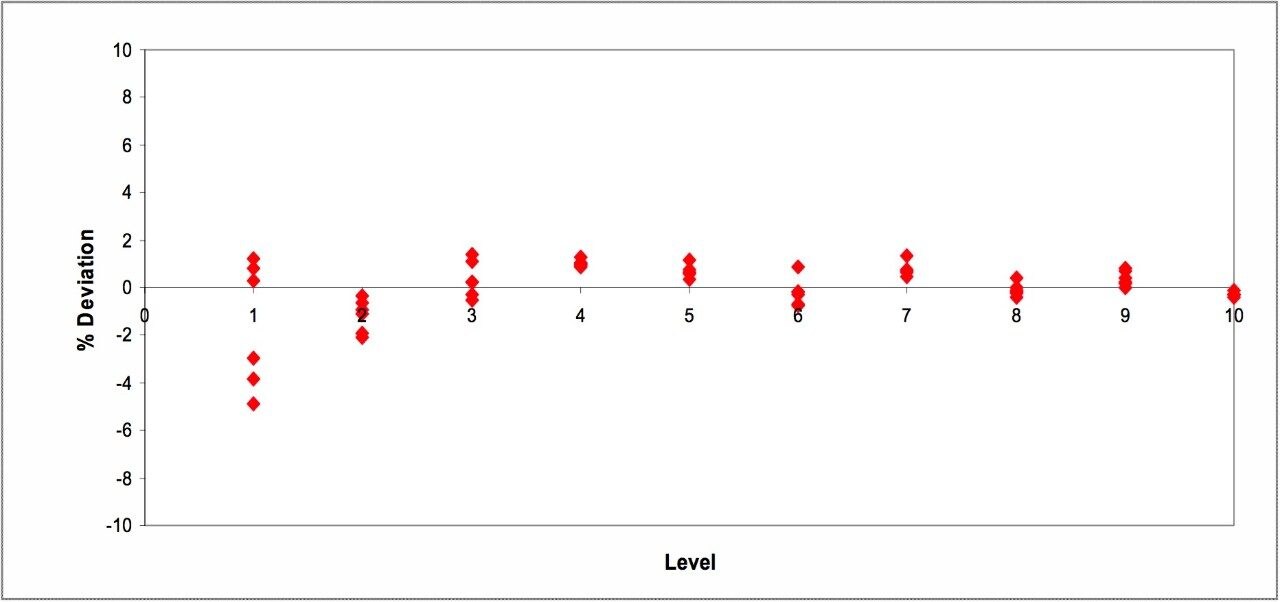
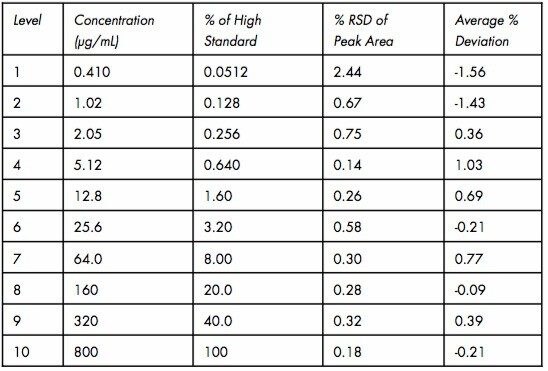
For applications in food safety and environmental analysis, it is often necessary to quantitatecomponents across many orders of magnitude. With conventional detection approaches, several calibration plots over the range are usually required. The ACQUITY UPLC PDA, however, is linear over more than four orders of magnitude, allowing quantitation from a single calibration curve. To demonstrate, a series of ten dilutions from 0.410 to 800 μg/mL of (2,4-dichlorophenoxy)acetic acid (2,4-D) standard were injected in six replicates to create a calibration curve (Figure 5). A 1/x weighting was chosen to reflect the variation of precision (standard deviation) over the wide concentration range.3 For curves over a wide range such as this, R2 is not a good indicator of linearity. Therefore, the % deviation from the curve (residuals) was plotted and examined for trends. The % deviation plot in Figure 6 does not exhibit trending at either end of the concentration range, indicating good linearity. Table 1 lists the average % RSDsat each level. The lowest level is near the limits of quantitation and thus has higher scatter of the residuals and a higher % RSD. Also shown is the average % deviation at each level as less than 2.0%.
Integral to the the superior performance of the ACQUITY UPLC System, the ACQUITY UPLC Photodiode Array Detector demonstrates a wide linear dynamic range with 5.0% deviations typically above 2.5 AU. Linearity tests of a main component and its 0.01% impurity were shown to be easily validated. A linear range in excess of four orders of magnitude makes the ACQUITY UPLC PDA ideal for all quantitative applications, from the routine to the most challenging.
720001593, March 2006