Impurities such as modifications and sequence variants generated from transcriptional/translational errors are common in recombinant protein products, and may affect their safety and activity. Effective control of these variants requires sensitive and reproducible methods for protein production monitoring.
Liquid Chromatography (LC)-based peptide mapping is a key method for protein structure characterization and purity analysis. However, ultra violet (UV) or mass spectrometry (MS) detectors in traditional LC/UV or LC-MS peptide mapping methods are unable to characterize unexpected contaminants, although they are sensitive for detection of low-level impurities in recombinant proteins. Additional time-consuming tandem mass spectrometry (MS/MS) measurements are required for the elucidation of unknown sequences. Furthermore, the presence of peptides resulting from unexpected proteolytic cleavages often makes the LC separation and the assignment of LC peaks more difficult.
Recently, LC combined with data-independent acquisition mass spectrometry (MSE) has been employed to analyze peptide maps with a high sequence coverage (>90%).1 Excellent analytical reproducibility was obtained from replicate analyses of the protein digest. In MSE 2-3, the parallel and unbiased data acquisition mode not only overcomes the repeatability limitations of data-dependent acquisition (DDA) LC-MS/MS experiments, but also ensures the sampling of low-abundance peptides from low-level impurities. The obtained MS and MSE spectra of such peptides allow for identification of unknown impurities in the sample.
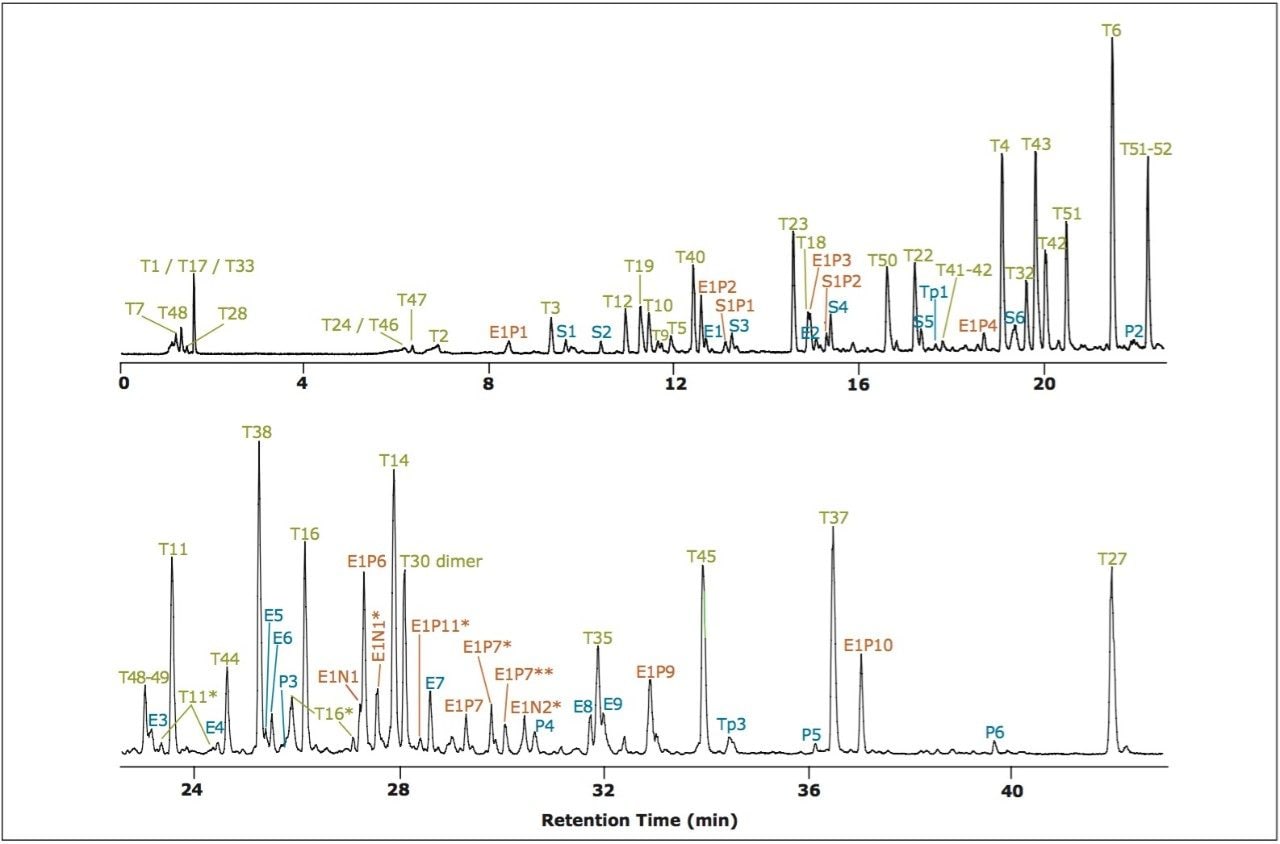
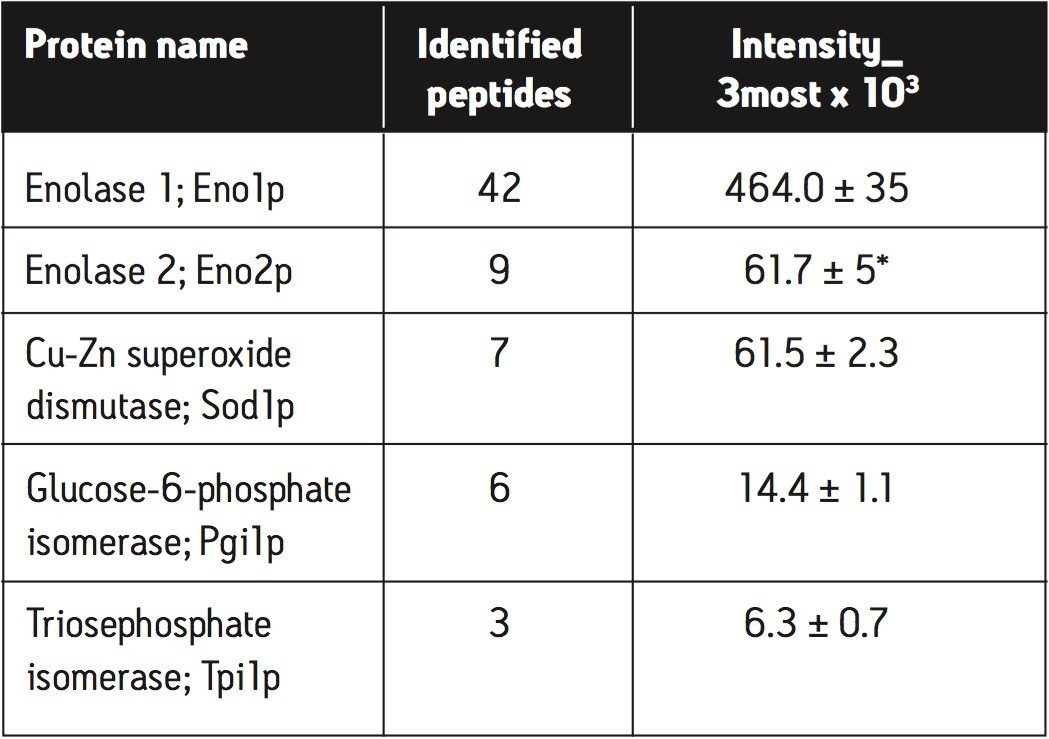
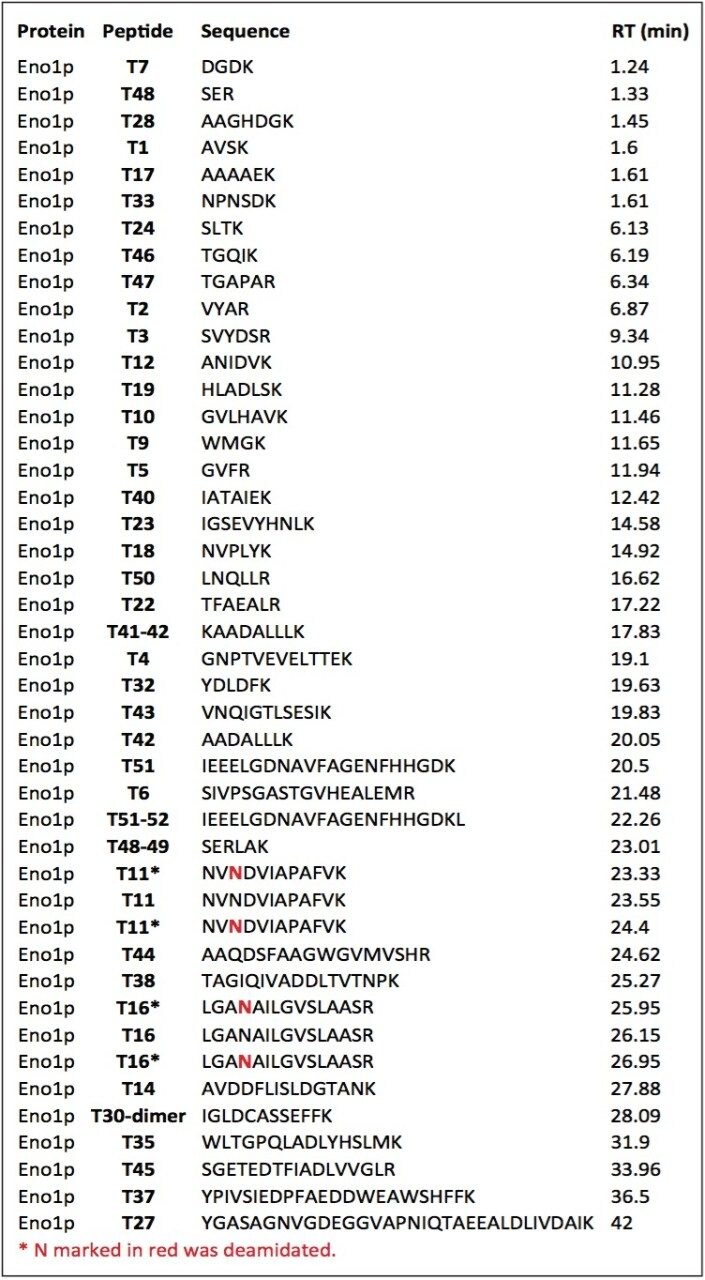
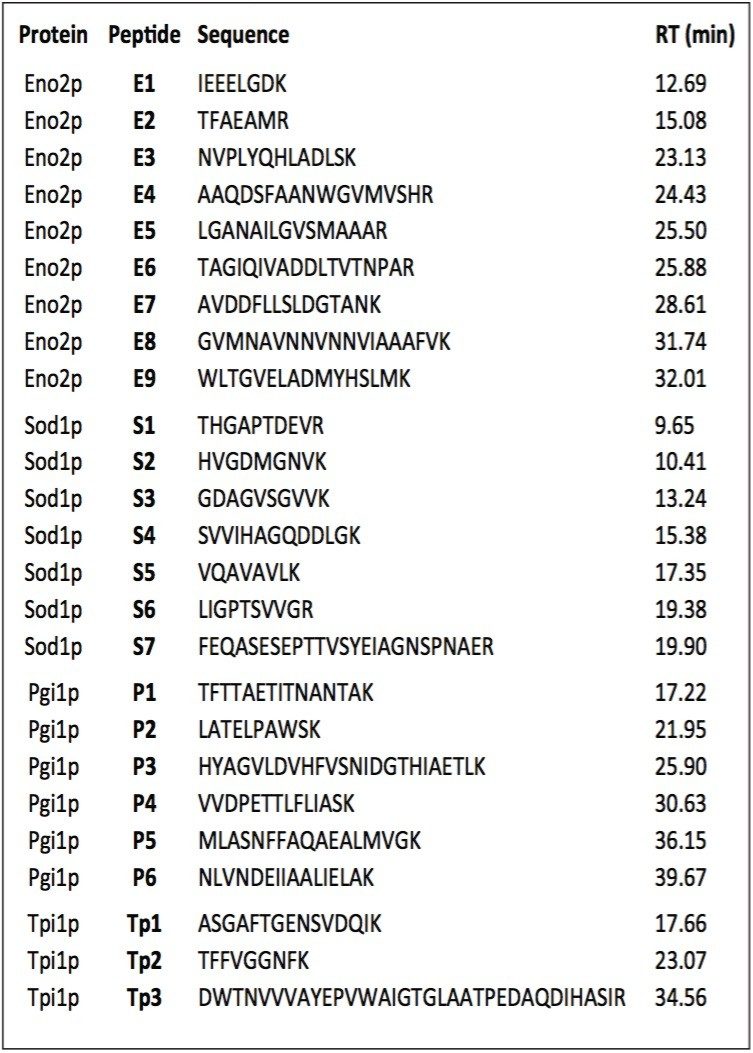
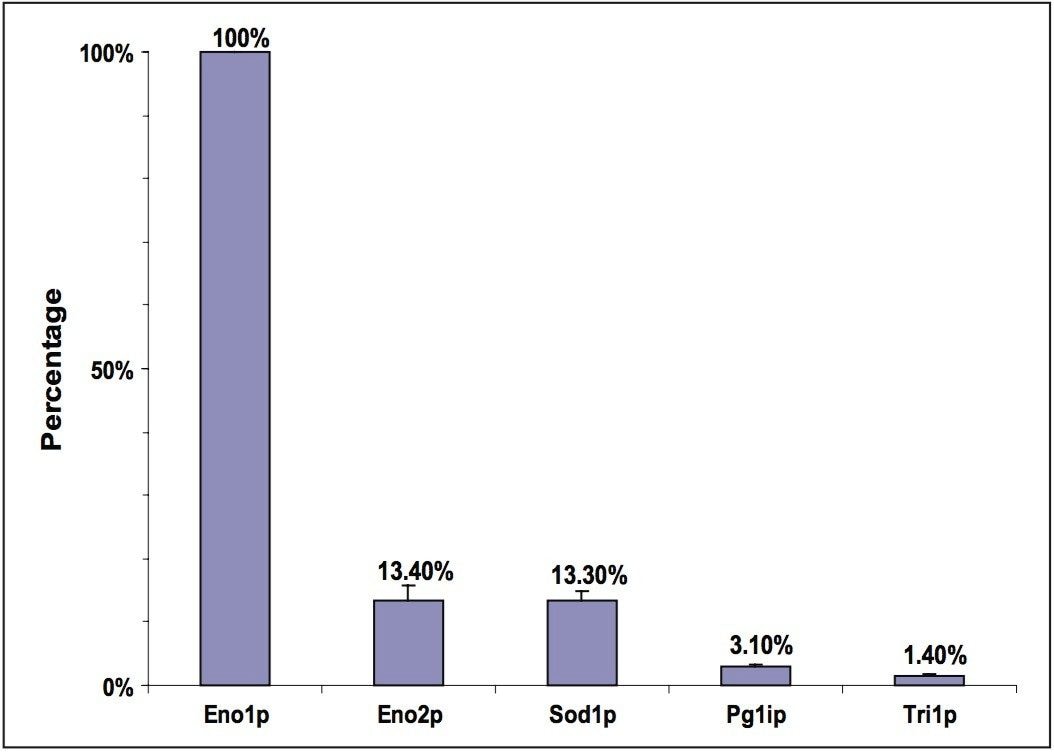
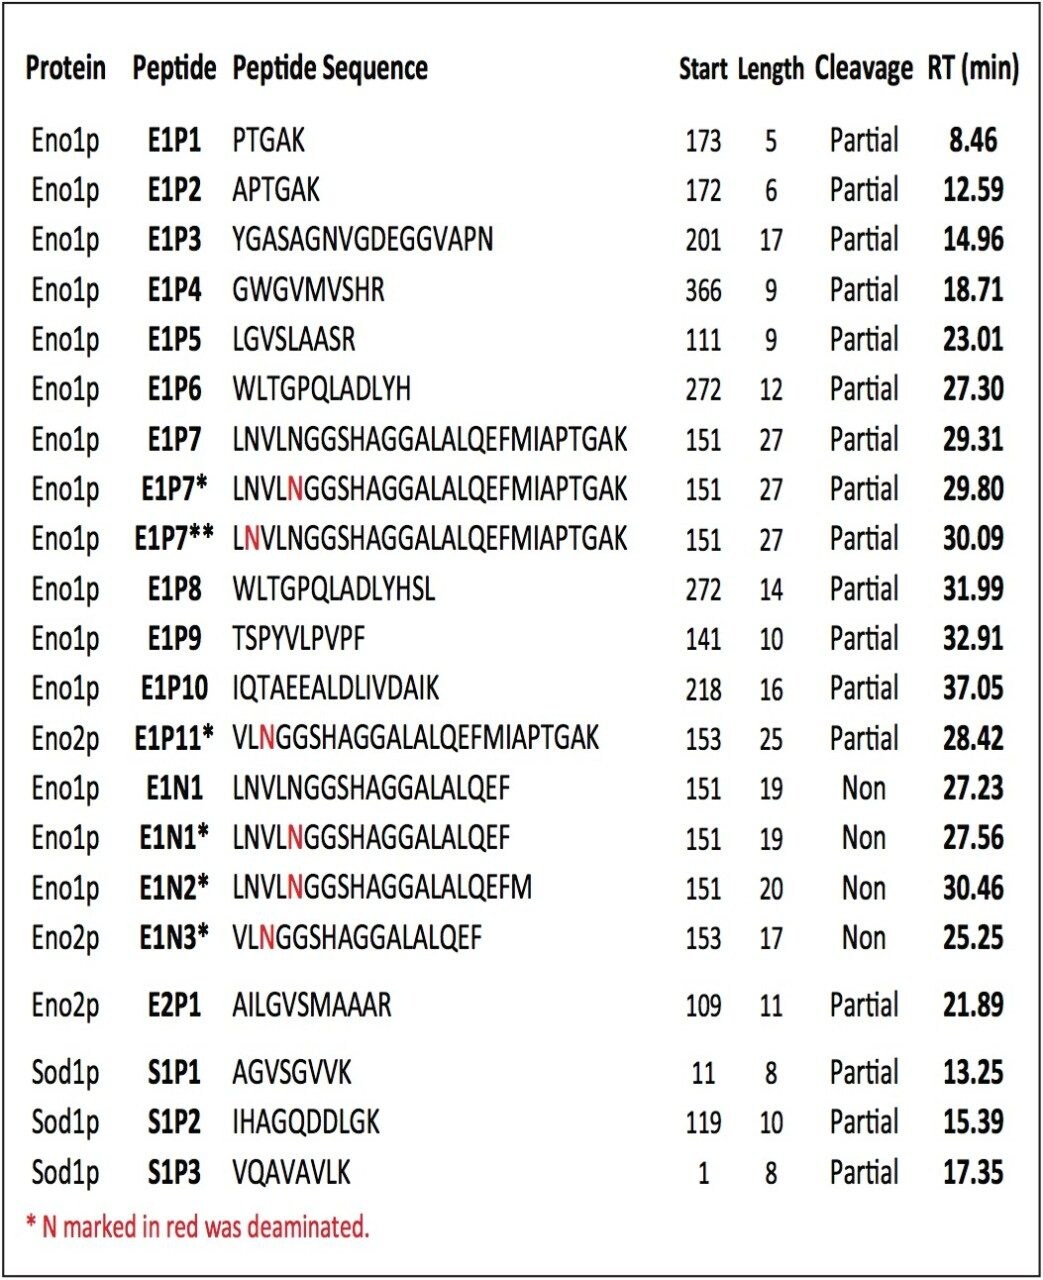
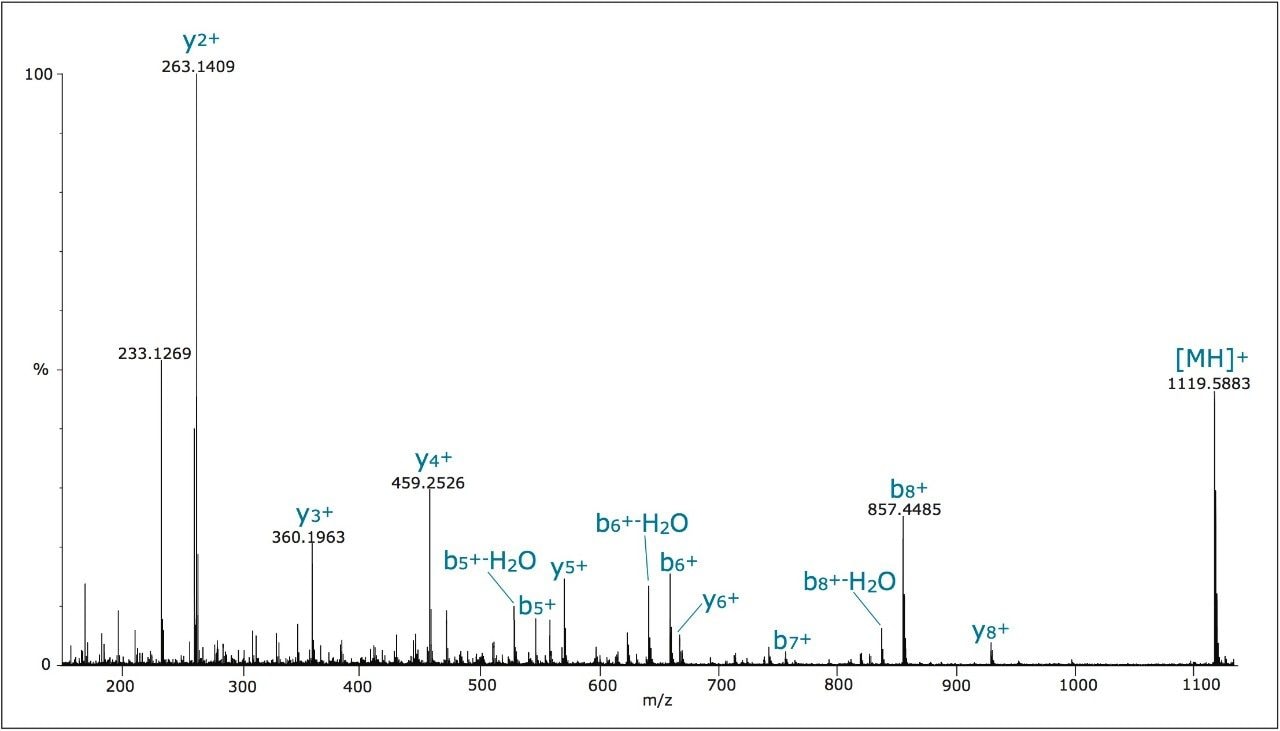
In this application note, we demonstrate an application of MSE, using the Waters SYNAPT MS System coupled with UltraPerformance LC (UPLC), for characterization of a yeast enolase tryptic digest. Multiple protein contaminants as well as unexpected peptides resulting from non-specific digestion were identified. The results demonstrate that UPLC-MSE methodology is capable of identifying and quantifying low-level impurities in protein products. LC peaks from unexpected partially tryptic and non-tryptic cleavages are assigned and distinguished from peptides originating from impurity proteins.This methodology may also be used to accelerate the development of protein purification strategies.