• Application Note

Enabling Significant Improvements for Peptide Mapping with UPLC

Enabling Significant Improvements for Peptide Mapping with UPLC

  • Jeffrey R. Mazzeo
  • Thomas E. Wheat
  • Beth L. Gillece-Castro
  • Ziling Lu
  • Waters Corporation

Abstract

This application note highlights the advantages of UPLC for peptide mapping.

Benefits

  • Better resolution is obtained in combination with generally increased sensitivity.
  • Run time can be reduced without compromising resolution by reducing column length and by increasing flow rate.

Introduction

Peptide mapping continues to be the preferred technique for the comprehensive characterization of biopharmaceutical products. Its applications include:

  • Identification of proteins based on the elution pattern of peptide fragments
  • Determination of post-translational modifications
  • Confirmation of genetic stability
  • Analysis of protein sequences when interfaced to a mass spectrometer

In a peptide map, it is necessary to resolve each peptide fragment into a single peak. Therefore, peptide mapping represents a significant chromatographic challenge due to the inherent complexity of protein digests. In addition to the large number of peptide fragments that are generated from the enzymatic digestion of a protein, the number of alternative peptide structures (e.g., posttranslational modifications, oxidations, etc.) can be significant.

The capabilities of UltraPerformance LC (UPLC) Technologies make higher resolution peptide mapping possible. This application note demonstrates the advantages of UPLC for peptide mapping.

Experimental

Method Conditions

LC System:

ACQUITY UPLC System

MS System:

Waters Q-Tof micro Mass Spectrometer

Software:

MassLynx 4.0 Software, SP4

Columns:

Waters Peptide Separation Technology

ACQUITY UPLC BEH 130, 1.7 μm, 2.1 x 50 mm and 2.1 x 100 mm

BioSuite PA-A 3 μm, 2.1 x 100 mm

BioSuite 3.5 μm, PA-B 2.1 x 100 mm

Flow Rate:

0.1 or 0.3 mL/min

Mobile Phase:

A: 0.02% TFA or 0.1% FA in H2O

B: 0.018% TFA or 0.1% FA in ACN

Gradient:

Linear gradients from 5 to 50% B, times as Indicated

Temperature:

40 ˚C

Injection Vol:

20 or 50 μL

Detection:

ESI/MS

Samples:

Waters MassPREP Peptide Standard Mixture MassPREP Enolase Digest Tryptic digest of α-1 acid glycoprotein

An ACQUITY UPLC Column.

Results and Discussion

The chromatographic benefits of UPLC are largely derived from reduced band-broadening that is, in turn, a consequence of reduced diffusion distances in small particles. This process is quantitatively described in the van Deemter equation that relates height equivalent of a theoretical plate to linear velocity.

This relationship is shown graphically in Figure 1 for a peptide of 1500 MW on 3.5 μm and 1.7 μm packings. The minimum in the curve corresponds to the maximum efficiency, and greatest resolving power, for each particle size. At linear velocities, or flow rates, above and below the optimum, resolving power declines.

Figure 1. van Deemter plot of a 1500 Da peptide.

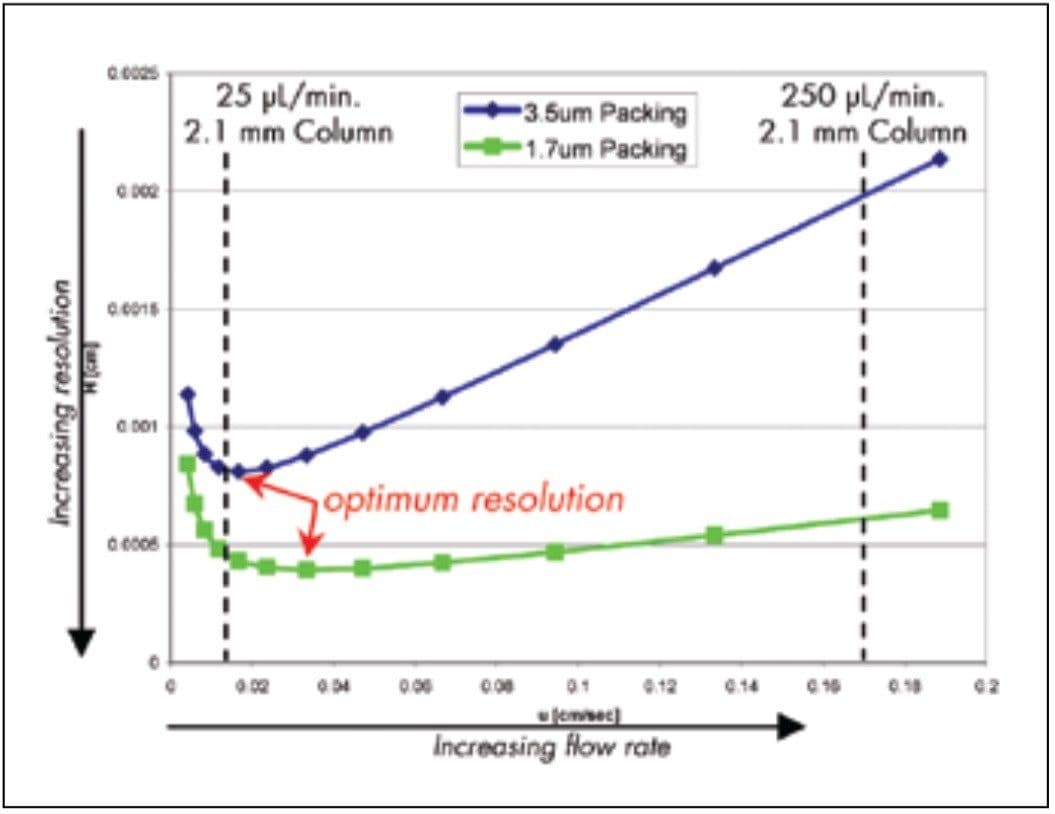
As expected, the smaller particles have higher resolving power at a higher linear velocity. In quantitative terms, the 3.5 μm particles have a minimum plate height of 8.11 μm at a linear velocity of 0.17 mm/sec. In contrast, a minimum plate height of 3.94 μm is observed at 0.33 mm/sec with the 1.7 μm particles.

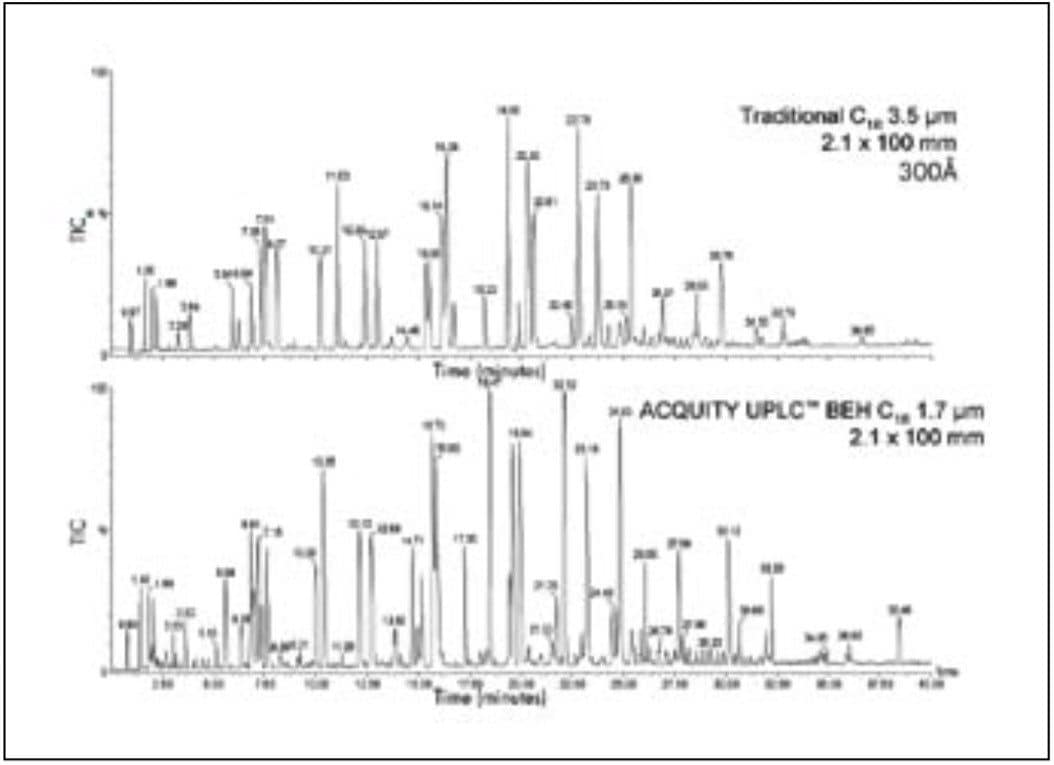
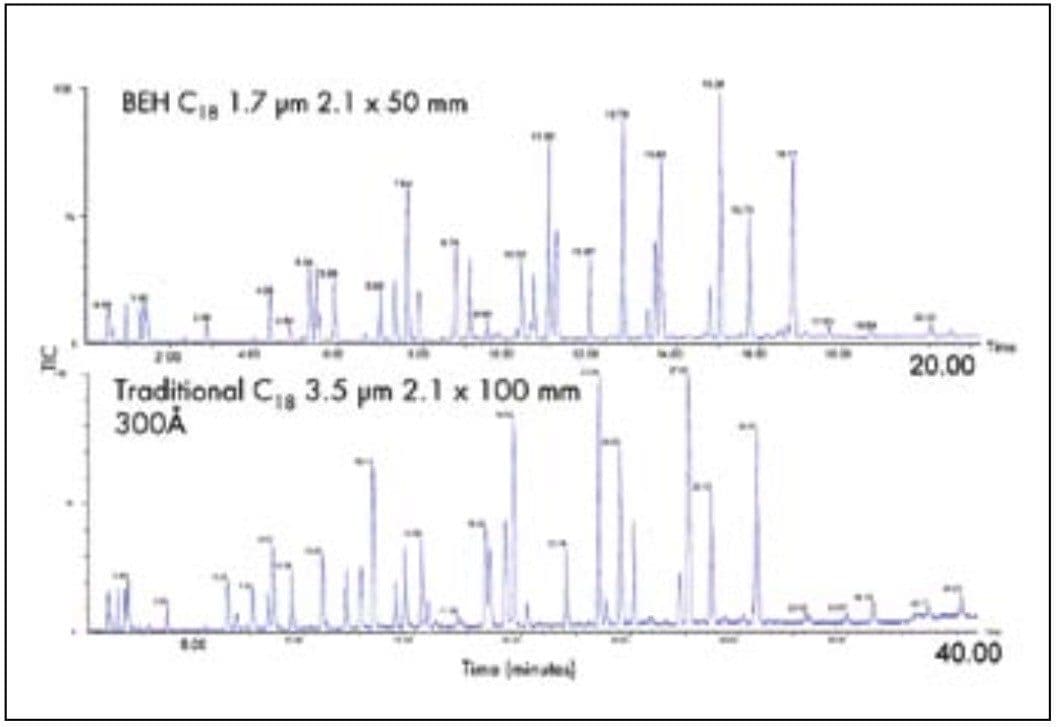
In practical terms, these principles suggest that the small particles used in UPLC could double the resolving power in a peptide mapping experiment and could simultaneously reduce the separation time because the optimum is achieved at a higher linear velocity.

For the 3.5 μm particle, the optimum linear velocity corresponds to a flow rate of about 24 μL/min on a 2.1 mm I.D. column. In practice, such a flow rate would never be used for a peptide map because the separation times would be far too long. It is common practice to operate at a higher flow rate, typically about 250 μL/ min on 2.1 mm columns. This linear velocity of about 1.7 mm/sec corresponds to a plate height of about 21 μm. This loss of resolution with a 10-fold increase in separation speed has come to be an accepted compromise. For 1.7 μm particles, resolution is much better preserved at the higher flow rate.

These chromatographic principles suggest several ways to approach improving peptide maps using UPLC. First, the smaller particle packing will improve both resolution and sensitivity by reducing diffusion-related band broadening. Second, the reduced plate height is consistent with obtaining the same or better resolution with shorter columns and higher flow rates. Third, the compromise between separation time and resolution will be more favorable with the smaller particles.

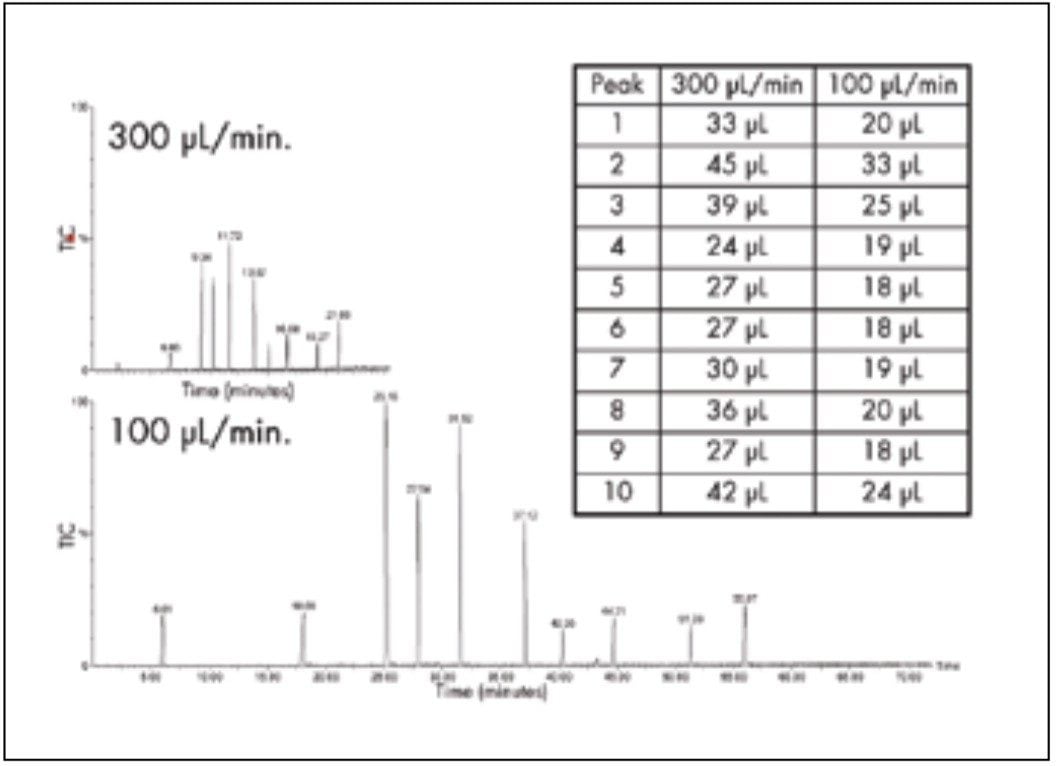
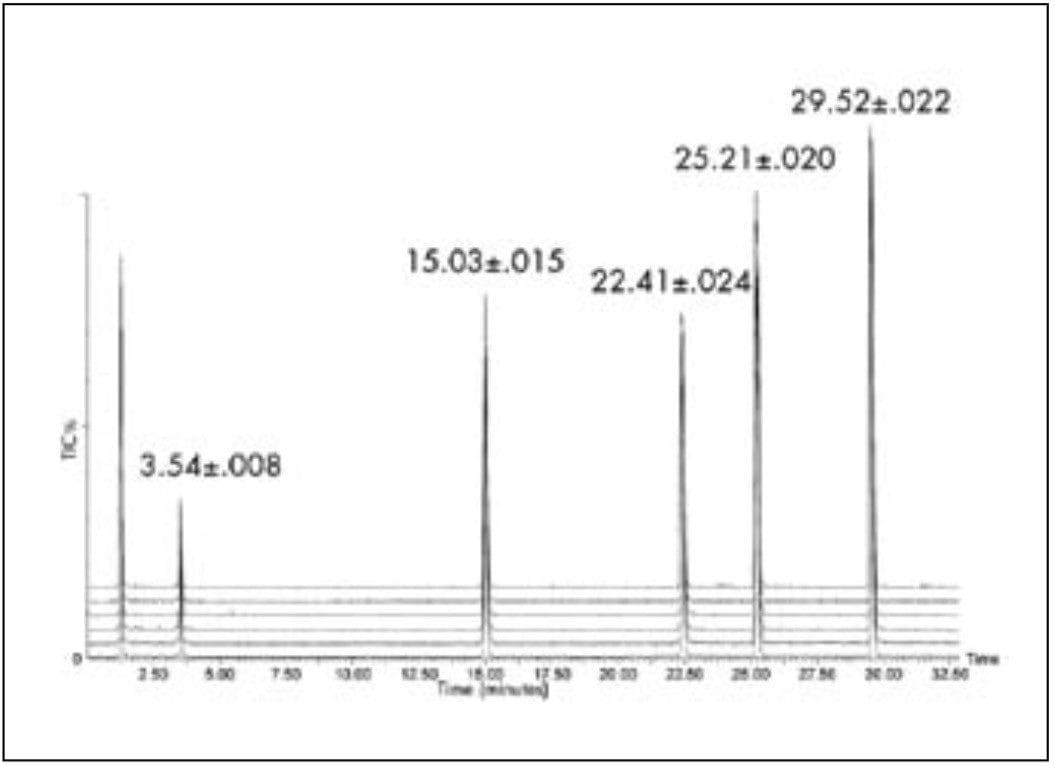
The influence of volumetric flow rate on peptide separation performance with 2.1 mm I.D. columns was investigated. A standard peptide mixture was separated on a UPLC column run at 100 μL/min and at 300 μL/min, as shown in Figure 2. Flow rate, or linear velocity, was the only variable because the gradient change/column volume was the same, ensuring that the chromatographic selectivity is constant. In experimental terms, a 75 minute gradient was used at 100 μL/min and a 25 minute gradient at 300 μL/min.

Figure 2. Effect of flow rate on the MassPREP peptide standard mixture. Both chromatograms are plotted to the same intensity scale.

To compare the results, peak volumes, calculated by multiplying the flow rate by peak width at the base, are shown in the inset. Running at 100 μL/min provides, on average, about a 1/3 reduction in peak volume.

As expected from the chromatographic principles described above, peptide peak volumes, and, therefore, resolution and sensitivity, are optimum at 100 μL/min. The flow rate is low compared to what is traditionally used for peptide mapping with 2.1 mm I.D. HPLC columns. The commonly accepted flow rate represents a compromise between resolution and run time but it also reflects instrumental limits in reproducibly pumping liquid at flow rates less than 150 μL/min with accurate and precise gradients. The ACQUITY UPLC System performs extremely well at a flow rate of 100 μL/min in gradient mode. This performance is demonstrated by the overlay of six gradient runs of a peptide standard, shown in Figure 3. The average and standard deviations of retention times are listed for each peak.

Figure 3. UPLC retention time reproducibility for peptide mapping.

The chromatographic principles also suggest ways to reduce the run time of a peptide map. Peptide maps run by HPLC often require cycle times as long as 3 to 5 hours to separate all the peptides within the digest, especially for large proteins like antibodies. While faster peptide maps would be desirable, it is critically important that resolution not be compromised. The test results must provide the same level of information. The van Deemter equation predicts that plate height will be 2- to 4-fold less with 1.7 μm particles than with 3.5 μm particles. The same resolving power can, therefore, be obtained with a shorter column. 

These experiments focus on the physical aspects of the separation as they relate to band-broadening. Successful peptide mapping depends, of course, on the interaction among the peptides, the mobile phase, and the column surface chemistry. In Figure 4, the separation of a tryptic digest of enolase is shown with a 3.5 μm C18 HPLC column with 300Å pores, typical of the most common peptide separation columns, and a 1.7 μm UPLC column. Conditions are the same for both columns. In the UPLC separation, more peaks are observed. The overall resolution and sensitivity are higher. In the UPLC map, there are several small peaks that are difficult to discern with the HPLC run.

Figure 4. Suitability of UPLC for peptide mapping.

This result demonstrates that UPLC offers higher resolution and sensitivity when compared to HPLC under the same gradient conditions. As is always observed when comparing two different column chemistries, the separations are not identical in every detail. The overall appearance of the chromatograms is, however, similar. This suggests that the selectivity of the UPLC column is suitable for peptide mapping.

To show how UPLC can resolve the same number of peaks in a peptide map as HPLC but in less time, the separation of an enolase digest was done on a 50 mm length UPLC column with a 20-minute gradient and on a 100 mm length HPLC column with a 40-minute gradient, both with flow rates of 100 μL/minute. These chromatograms are shown in Figure 5. The UPLC separation shows the same number of peaks and a similar overall elution pattern as the HPLC separation, but in half the time. UPLC offers the potential to reduce cycle times for peptide maps.

Figure 5. Reduced column length for increased speed.

The higher resolution and sensitivity with UPLC is particularly important when the peptide map is used to detect modified peptides. Higher resolution ensures that modified peptides are resolved from the unmodified form, as well as from other peptides in the digest. Higher sensitivity means that modified peptides can be detected at lower levels. For example, in Figure 6, UPLC is used to separate a deamidated peptide from its unmodified form. UPLC should be the technique of choice for detecting all the peptides in a sample.

Figure 6. Separation of a deamidated peptide from its native form.

Peptide mapping is frequently interfaced with electrospray ionization mass spectrometry (ESI/MS) to provide additional information about the eluting peptides, including molecular weight and sequence. MS can also identify modified peptides and glycosylation sites. Therefore, it is important that a peptide mapping technique work well under conditions that are favorable for ESI/MS.

TFA is commonly used as an acidic additive for peptide maps with UV detection, but it can lead to suppression of ionization and reduced sensitivity in ESI/MS. Formic acid is more desirable for LC-MS, as it causes less ion suppression than TFA. However, many reversed phase columns used for peptide mapping show lower retention and broader peaks with formic acid than with TFA.

In Figure 7, the separation of several peptides with formic acid is compared with TFA on a UPLC column with MS detection. With formic acid, the peak heights are about 3-fold higher. There is only a slight reduction in retention, corresponding to a difference of a few percent organic at the point of elution, and a slight increase in peak width. This result indicates that the UPLC columns perform extremely well under conditions that are best for ESI/MS. 

Figure 7. Effect of mobile phase modifier in UPLC Peptide Separation Technology material.

Glycosylation is an important post-translational modification that plays a critical role in determining the efficacy and safety of a therapeutic protein. Glycosylation can be analyzed on the intact protein by mass spectrometry, as released glycans or as glycopeptides in LC-MS peptide maps. When glycosylation is characterized with LC-MS of the glycopeptides, the site of attachment can be directly determined and structural information can be obtained through MS/MS experiments. This approach is limited, however, by the poor chromatographic peak shape of glycopeptides and incomplete resolution of glycoforms with HPLC peptide mapping. The poor peak shape has been attributed to the large size of the glycopeptides and their heterogeneous structure.

Figure 8 shows the UPLC-MS separation of a tryptic digest of α-1 acid glycoprotein. The MS detection was performed with a Q-Tof micro Mass Spectrometer, which is well-suited for glycopeptides due to its extended mass range. Data is plotted as a selected ion chromatogram for m/z 657, a signature ion for glycopeptides resulting from carbohydrate fragments. The glycopeptides are detected as sharp, symmetrical peaks with UPLC. These characteristics are important for minimizing spectral overlap of different glycoforms of the same peptide. UPLC with ESI/TOF mass spectrometry will be a powerful tool for studying the glycosylation state of proteins.

Figure 8. A glycopeptide separation.

Conclusion

UPLC facilitates notable improvements in peptide mapping when compared to HPLC. Better resolution is obtained in combination with generally increased sensitivity. Run time can be reduced without compromising resolution by reducing column length and by increasing flow rate. Selectivity is comparable to that of common reversed phase HPLC peptide mapping columns and can be easily transferred to alternative modifiers that give better sensitivity in ESI/MS. UPLC with ESI/TOF is especially suitable for the separation of glycopeptides. The ACQUITY UPLC System is clearly proving to be the next-generation tool for peptide mapping.

720001339, January 2008

Back To Top Back To Top