• Application Note

Advances in Size-Exclusion Chromatography for the Analysis of Small Proteins and Peptides: Evaluation of Calibration Curves for Molecular Weight Estimation

Advances in Size-Exclusion Chromatography for the Analysis of Small Proteins and Peptides: Evaluation of Calibration Curves for Molecular Weight Estimation

  • Paula Hong
  • Stephan M. Koza
  • Kenneth J. Fountain
  • Waters Corporation

Abstract

This application note demonstrates, the impact of a 125 Å pore sub-2 µm packing material on the separation and resolution of small proteins and peptides. It also shows the impact of both physical and chemical properties of SEC packing materials on SEC calibration curves used for molecular weight estimation.

Benefits

  • Improved resolution and throughput of peptide separations and small proteins with SE-UPLC compared to SE-HPLC
  • Optimized conditions for true size-based separations of peptides
  • Organic mobile phase compatibility for reliable molecular weight estimation of hydrophobic peptides

Introduction

In 2010 over 60 therapeutic peptides were available in the US, Europe and/or Japan.1 Recent trends indicate this number will only increase: the decline in development of small molecule pharmaceuticals, combined with improvements in peptide synthesis, have renewed interest in the research and development of peptide biotherapeutics a class of compounds that includes synthetic peptides such as vasopressin analogues and enfuvirtide.2,3

However, the complex nature of biotherapeutics requires a number of different analytical techniques for complete characterization, with each technique providing information on a different physical property of the biomolecule. One such technique, size-exclusion chromatography (SEC) can be used to provide molecular weight characterization for the both the biomolecule and any process related species.2,3 In this chromatographic mode, apparent molecular weight, based on hydrodynamic radius, is determined by comparing the elution volume of the unknown biomolecule with the elution profile of a known set of standards. However, these results can only provide useful information if the separation is solely size-based and not influenced by non-ideal or secondary interactions.  

We have previously described the benefits of Ultra Performance Liquid Chromatography (UPLC) combined with 200 Å sub-2 µm SEC packing materials for the analysis of monoclonal antibodies; however, these packing materials are not ideal for small biomolecules (<80,000 Da).4,5 In the following application, the impact of a 125 Å pore sub-2 µm packing material on the separation and resolution of small proteins and peptides will be demonstrated. We will also show the impact of both physical and chemical properties of SEC packing materials on SEC calibration curves used for molecular weight estimation.

Experimental

Sample preparation

All samples were prepared in 25 mM sodium phosphate, 150 mM sodium chloride pH 6.8 buffer. Proteins and peptides were purchased as individual standards (Sigma-Aldrich). Sample concentrations ranged from 1–5 mg/mL. All samples were tested as individual standards unless otherwise noted.

LC conditions

LC System:

ACQUITY UPLC H-Class Bio System with Column Manager or 30 cm Column Heater

Detection:

TUV detector with 5 mm Titanium Flow Cell

Wavelength:

280 and 214 nm

Columns:

ACQUITY UPLC BEH125 SEC, 1.7 μm Column, 4.6 x 150 mm and 4.6 x 300 mm (Part Number: 186006505);

ACQUITY UPLC BEH200 SEC, 1.7 μm Column, 4.6 x 150 mm (Part Number: 186005225);

BioSuite 125 UHR, 4 μm Column, 4.6 x 300 mm (Part Number: 186002161)

Column Temp.:

30 °C

Sample Temp.:

10 °C

Injection Volume:

2–8 μL

Flow Rate:

0.4 mL/min

Mobile Phases:

25 mM sodium phosphate, 150 mm sodium chloride, pH 6.8, 25 mM sodium phosphate, 250 mm sodium chloride, pH 6.2 and 30% ACN, 0.1% TFA (prepared using Auto•Blend Plus Technology)

Gradient:

Isocratic

Vials:

Maximum Recovery Vials (Part Number: 186002802)

Data management

Chromatography Software: UNIFI v 1.5 Software

Results and Discussion

Size-based separation calibration curves are based on known molecular weights of each protein as a function of elution volume or retention time. These curves, typically linear or third order polynomial, provide a means to get an approximate molecular weight of an unknown protein or peptide. While the linear portion of the calibration curve provides the highest resolution, non-linear behavior can also be observed since elution is dependent on the hydrodynamic radius of the molecule. While pore size is the predominant determining factor for the linear range of an SEC calibration curve, other factors include total pore volume of the column and pore size distribution.

Effect of particle size

The benefits of smaller particles for size-exclusion chromatography have been well documented demonstrating improvements in efficiency and resolution.5 Until recently, most studies have evaluated packing materials consisting of particle sizes greater than 3 µm. The advent of sub-2 µm SEC column packing materials allows for further improvements in resolution and efficiency. 

A set of proteins and peptides were analyzed on both a UPLC-based BEH SEC column (1.7 µm) and an HPLC-based silica SEC column (4 µm) using the same ACQUITY UPLC H-Class Bio System (Figure 1) and aqueous mobile phase conditions (25 mM sodium phosphate, 150 mM sodium chloride, pH 6.8). The elution volume of the peptides and proteins was lower for the ACQUITY UPLC BEH125 SEC, 1.7 µm column as compared to the HPLC-based silica column. In addition, improved sensitivity and narrower peak widths were observed on the sub-2 µm packing material. USP resolutions for the main constituents were also calculated for both the UPLC-based BEH SEC (1.7 µm) column and the HPLC-based silica SEC (4 µm) column (Figure 2). While resolution in SEC with respect to the particle used is primarily a function of pore size and pore volume, the particle size of the separation medium also affects the ability to resolve closely related, molecular weight species. As shown in Figure 2, the calculated USP resolutions for peaks 2–8 in the test mixture showed resolution gains from 24–200% as compared to the 4 µm SEC column. As predicted, the greatest improvements in resolution on the 125 Å SEC-UPLC column were obtained in the molecular weight range less than 20,000 Da.

Figure 1. Effect of particle size on SEC separation of proteins and peptides.
Figure 2: USP resolution of protein and peptides in Figure 4. USP Resolution was calculated by 2(tR2- tR2)/(w2+w1), where tR = retention time and w = peak width at 50% peak height.

Effect of pore size

For the analysis of small proteins and peptides, SEC packing materials typically contain pores of with a diameter <200 Å. These pore diameters have been shown to provide optimum resolution for solutes with less than 100,000 molecular weight. To evaluate the effect of pore size, a set of proteins and peptides were analyzed on both the 125 and 200 Å BEH sub-2 µm SEC columns under aqueous conditions (25 mM sodium phosphate, 150 mM sodium chloride, pH 6.8).

The calibration curve for each column was also evaluated to verify the effect of pore size on the molecular weight range (Figure 3). As described above pore size has a significant impact on the linear portion of an SEC calibration curve. Comparison of the 125 and 200 Å BEH sub-2 µm SEC columns illustrates this phenomenon. The calibration curve for the ACQUITY UPLC BEH200 SEC, 1.7 µm  column showed greatest linearity and highest resolution, in the molecular weight range of 400,000 to 44,000 Da. Likewise, ACQUITY UPLC BEH125 SEC, 1.7 µm column provided highest resolution from 44,000 to 1,000 Da, the molecular weight range of most peptide biotherapeutics. As expected, pore size of the packing material had a significant impact on the useable molecular weight range of the column. The 200 Å packing material produced a separation with highest resolution over the molecular weight of 1,000,000 to approximately 44,000 Da, while the separation on the 125 Å packing material had greatest resolution from 44,000 to approximately 1,000 Da.

Figure 3: Calibration curves: Effect of pore size. ACQUITY UPLC BEH125 SEC, 1.7 µm and ACQUITY UPLC BEH200 SEC, 1.7 µm columns, 4.6 x 150 mm comparison. 

Effect of mobile phase composition

SEC separations based on the hydrodynamic radius of the biomolecule rely on minimal adsorption between the analyte and packing material. These secondary interactions can be due to a number of different mechanisms including ionic interactions between the solute and the free silanols of the packing material or hydrophobic interactions between the solute and the hydrophobic sites on the packing material. While ion-exchange effects can be minimized by the addition of buffers and salts and/or pH adjustments of the mobile phase, hydrophobic effects are commonly minimized by the addition of organic solvents or other additives. Given these considerations, careful evaluation of mobile phase conditions must be conducted to ensure a predominantly size-based separation for peptides

As described above, the ACQUITY UPLC BEH125 SEC, 1.7 µm column provided improved component resolution in molecular weight range less than 20,000. To explore the SEC separations within a defined molecular weight range, a series of peptides less than 9,000 Da were analyzed under aqueous conditions. Method development experiments evaluated the effect of mobile phase pH and salt concentration. The results showed minimal effect of salt concentrations (150–350 mM) and mobile phase pH (6.2–7.4) on retention time (data not shown). All of the aqueous mobile phases resulted in later than expected elution for most small peptides and proteins (<17,000 Da) as well as elution order that did not correspond to published molecular weight values. For example, bradykinin fragment 1–7 (MW 757) eluted before greater molecular weight peptides such as angiotensin I (MW 1296) and bradykinin (MW 1,060). Figure 4a. These results also suggest the non-ideal interactions of the tested peptides with the media is not solely due to an “ion-exchange” mechanism since increasing salt concentration had no significant impact on retention time.

Figure 4. Effect of mobile phase on SEC separation of peptides.

In order to optimize the SEC separation for these peptides, evaluation of mobile phase was conducted. Mobile phases commonly used for SEC analysis of biotherapeutic peptides are denaturing and often contain organic solvents, acids and denaturants/charge additives such as arginine. These mobile phases minimize non-ideal (hydrophobic and/or ionic) interactions and thus are often needed to obtain a size-based separation for some peptides.6 Additionally, these mobile phases can also affect retentivity by changing the structural conformation of the peptides. Under native conditions peptides may form stable secondary structures, while in the presence of denaturants these same polypeptides form random coil structures. These confirmation changes can increase the hydrodynamic radius of the biomolecule resulting in changes in elution volume. 

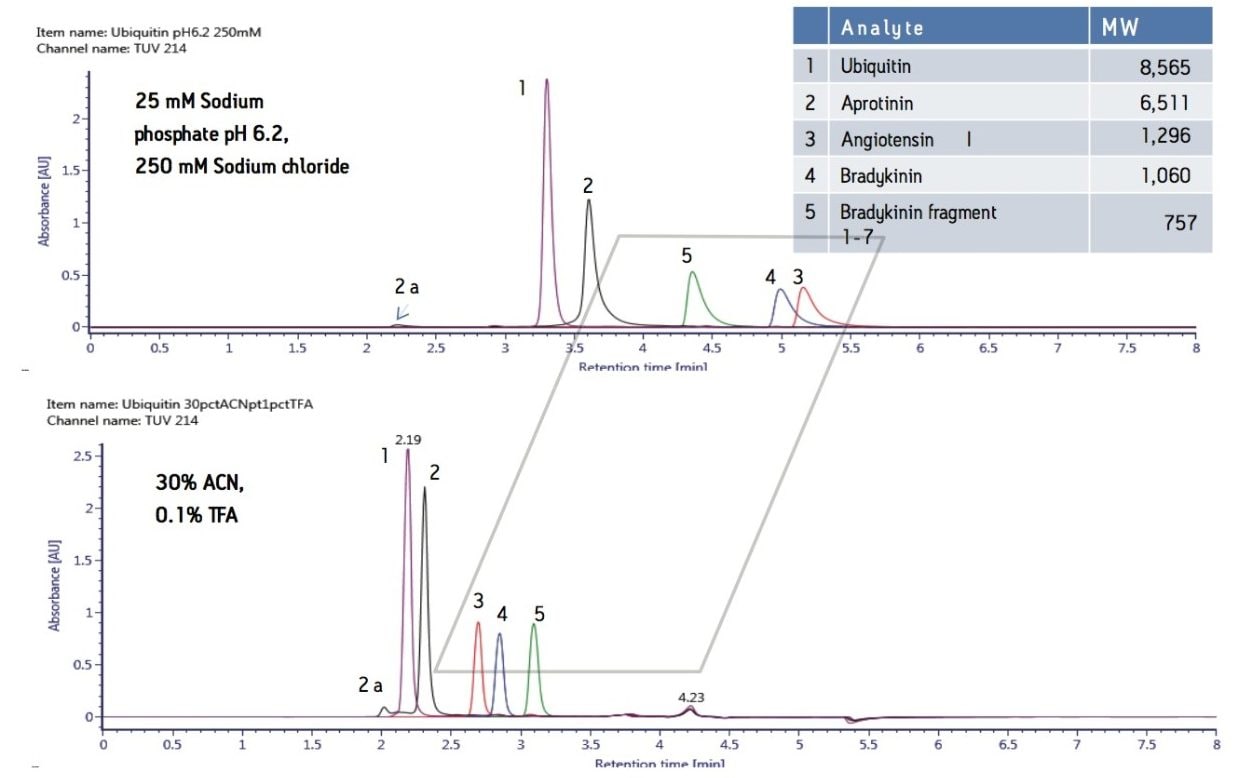
The ACQUITY UPLC BEH125 SEC, 1.7 µm column was tested under similar conditions with organic/ion-pairing mobile phases (Figure 4). Acetonitrile was used to minimize hydrophobic interactions and trifluoroacetic acid was used as an ion pairing reagent to reduce “ion-exchange” or charge-charge interactions. As expected, this mobile phase (30% acetonitrile and 0.1 % trifluoroacetic acid [TFA]) produced earlier retention times and more symmetrical peak shapes for the peptides analyzed. Furthermore, in contrast to the SEC separation of peptides under 100% aqueous mobile phases conditions, the use of organic and ion-pairing  mobile phases resulted in the expected elution order for bradykinin fragment 1–7, angiotensin I and bradykinin, based on their molecular weights (Figure 4b). These elution order changes could be due to reduction of secondary interactions and/or changes in the confirmation and hydrodynamic radii of the peptides.

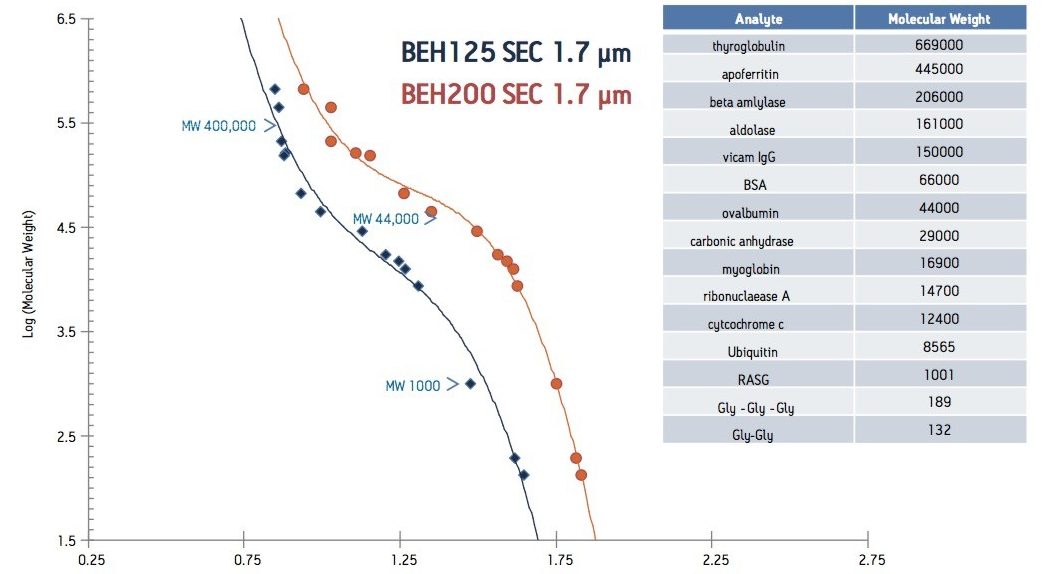
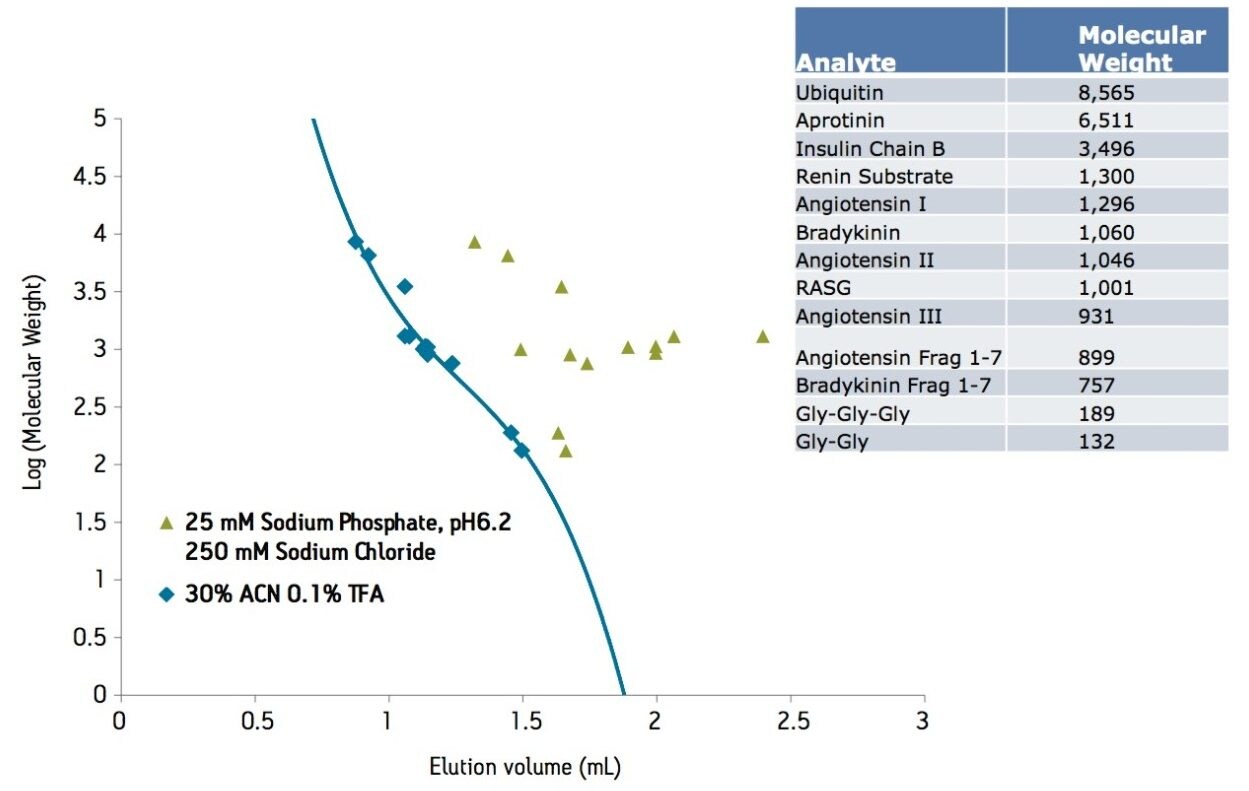
Comparison of the SEC calibration curves more clearly illustrates the effect of mobile phase formulation on the SEC separation of small biomolecules (Figure 5). Under aqueous condition (25 mM sodium phosphate, 150 mM sodium chloride, pH 6.8), the elution order of the peptides appears random. However, the use of acetonitrile and TFA in the mobile phase produced a 3rd order polynomial calibration curve, as predicted in size-exclusion chromatography. This allows for reliable molecular weight estimation based on the linear region of the calibration curve. For example, the high molecular weight species of aprotinin (peak 2a) was calculated to be within 11% (or 14,370 Da) of the expected molecular weight (13,022 Da). This same estimation could not be performed under aqueous conditions because of the non-linearity of the calibration curve.

Figure 5. Effect of mobile phase on calibration curve of BEH125 SEC, 1.7 µm column.

Conclusion

Size-exclusion chromatography has been the preferred method for the analyses of biomolecules based on size. By combining 125 Å sub-2 µm packing materials with a low dispersion ACQUITY UPLC H-Class Bio System, improved resolution and high-throughput of SE-UPLC can be realized for small biomolecule separations. However, secondary interactions may need to be minimized in the development of a size-based separation for reliable molecular weight estimation.

The ACQUITY UPLC BEH125 SEC, 1.7 µm column combined with the ACQUITY UPLC H-Class Bio System provides:

  • Improved resolution and higher throughput as compared to traditional SE-HPLC packing materials
  • Improved resolution for 80,000–1,000 Da as compared to larger pore sized packing materials
  • Compatibility with denaturing mobile phase used to reduce secondary interactions between peptides and packing materials for molecular weight characterization and impurity testing in the production of peptide biotherapeutics.

References

  1. Vlieghe, P, Lisowski, V, Martinez, J, Khrestchatisky, M. Synthetic Therapeutic Peptides: Science and Market. Drug Discovery Today, (2010), 15: 1/2 40-56.
  2. Irvine, G.B., Size-exclusion high performance liquid chromatography of peptides: A review. Anal. Chim. Acta 1997 352: 387-397.
  3. Irvine, G.B., Molecular Weight Estimation for Native Proteins Using High-Performance Size-Exclusion Chromatography, The Protein Protocols Handbook. In: Walker JM, editor.: Humana Press; 2002. p. 573-9
  4. Fountain KJ, Hong, P, Serpa, S, Bouvier, ESP and Morrison, D. Analysis of Biomolecules by Size-Exclusion UltraPerformance Liquid Chromatography. Waters Corporation, Application Note [serial on the Internet]. 2010; (WA64226).
  5. Hong P, Fountain KJ. Method Development for Size-Exclusion Chromatography of Monoclonal Antibodies and Higher Order Aggregates. Waters Corporation, Application Note, 2011.

720004412, June 2012

Back To Top Back To Top