• Application Note

MRM Analysis of a Parkinson's Disease Protein Signature

MRM Analysis of a Parkinson’s Disease Protein Signature

  • Tiziana Alberio
  • Kelly McMahon
  • Manuela Cuccurullo
  • Lee A. Gethings
  • Craig Lawless
  • Maurizio Zibetti
  • Johannes P.C. Vissers
  • Leonardo Lopiano
  • Mauro Fasano
  • Division of Biomedical Sciences, Department of Theoretical and Applied Sciences, University of Insubria
  • Center of Neuroscience, University of Insubria
  • Waters Corporation
  • Faculty of Life Sciences, University of Manchester
  • Department of Neuroscience, University of Torino

For research use only. Not for use in diagnostic procedures.

Abstract

In this application note, a Parkinson’s disease protein signature/panel was quantitatively evaluated in T-lymphocytes and peripheral blood mononuclear cells from a cohort of nine patients with Parkinson’s disease and nine controls utilizing multiple reaction monitoring (MRM) LC-MS.

Benefits

This work demonstrates the combination of nanoscale separations with quantitative tandem quadrupole mass spectrometry to accurately determine relative peptide and protein abundances. Statistical analysis of MRM data sets determined peptide abundances, which allowed for the differentiation of Parkinson’s disease in patients and control subjects.

Introduction

Parkinson’s disease (PD) is a degenerative disorder of the central nervous system. PD is currently assessed by the clinical evaluation of extrapyramidal symptoms, such as tremor, rigidity, and bradykinesia, which appear when the degeneration of dopaminergic nigral neurons has raised over 70%.1 The identification of specific biomarkers is critical for the early diagnosis of PD, as well as for monitoring disease progression and treatment efficacy.

A Parkinson’s disease protein signature/panel was quantitatively evaluated in T-lymphocytes and peripheral blood mononuclear cells from a cohort of nine patients with Parkinson’s disease and nine controls utilizing multiple reaction monitoring (MRM) LC-MS. A previously determined and proposed2,3 discriminant function was applied to the measured signature, assigning seven controls out ofnine as true negatives and nine patients out of nine as true positives.

Experimental

Sample preparation and digestion protocol

Peripheral blood mononuclear cells and T-lymphocytes were isolated as previously described.2 Cell pellets were re-suspended in a PBS/RapiGest solution and centrifuged. The supernatants were collected, NH4HCO3 solution added, and samples denatured. Each sample was reduced, alkylated, and digested with trypsin overnight. Prior to MRM measurement, TFA was added, peptides collected, and samples further diluted with an aqueous formic acid solution and spiked with pre-digested Chaperone protein ClpB (E. coli) standard for relative peptide quantification.

LC-MS conditions

Time-scheduled MRM experiments were conducted with a nanoACQUITY UPLC System interfaced to a Xevo TQ-S4 tandem quadrupole mass spectrometer. A 60-min reversed-phase gradient from 3 to 40% acetonitrile (0.1% formic acid) was employed using a vented trap configuration comprising a 5-μm Symmetry C18 2 cm x 180 μm trap column and a 1.7-μm ACQUITY UPLC BEH C18 15 cm x 75 μm analytical column. Unit quadrupole resolution settings were employed. Three technical replicates were acquired in random order.

Peptide quantification

Peptide MRM methods were created with Skyline Software (MacCoss Lab, University of Washington, Seattle, Washington, U.S.),5 which interfaces directly with MassLynx Software. Peak area integration, regression analysis, and sample quantification was performed using TargetLynx Application Manager. Relative quantitation was achieved using the exogenous CLPB protein digest spike, applying linear regression analysis. At least two non-interfered MRM transitions per peptide were required for quantitation. The resultant quantitative LC-MS peptide data were analyzed with mProphet (Biognosys AG, Schlieren, Switzerland).6

Statistical analysis

Relative calculated MRM amounts were normalized to a peptide of a housekeeping protein (beta-actin). Fold-change values were obtained for each peptide by normalizing the complete data set against a single control subject. Relative quantities were analyzed using the Wilcoxon test. Nine peptides, selected from a previously reported protein panel,2 were selected for analysis. Parameters for a classification function were obtained by linear discriminant analysis of relative 2-DE amounts and applied to the MRM results.

Results and Discussion

MRM transitions were designed iteratively starting with in silico prediction, followed by experimental validation and comprehensive MRM testing of all of the candidate peptides. In short, Cys, Met, and RP/KP containing peptides were excluded, as well as missed cleaved and modified peptides. The minimum and maximum amino acid lengths were 8 and 25 amino acids, respectively. VerifyE Software was employed as a filter to exclude non-proteotypic, interfered transitions using 2 Th precursor and product ion tolerances and a 2-min retention time window. A pooled sample comprising equal amounts of all patient and control subject samples was used to examine the usability of the predicted final transitions in terms of response and interference. The retained transitions were manually inspected and curated using TargetLynx, and analyzed and scored with mProphet.

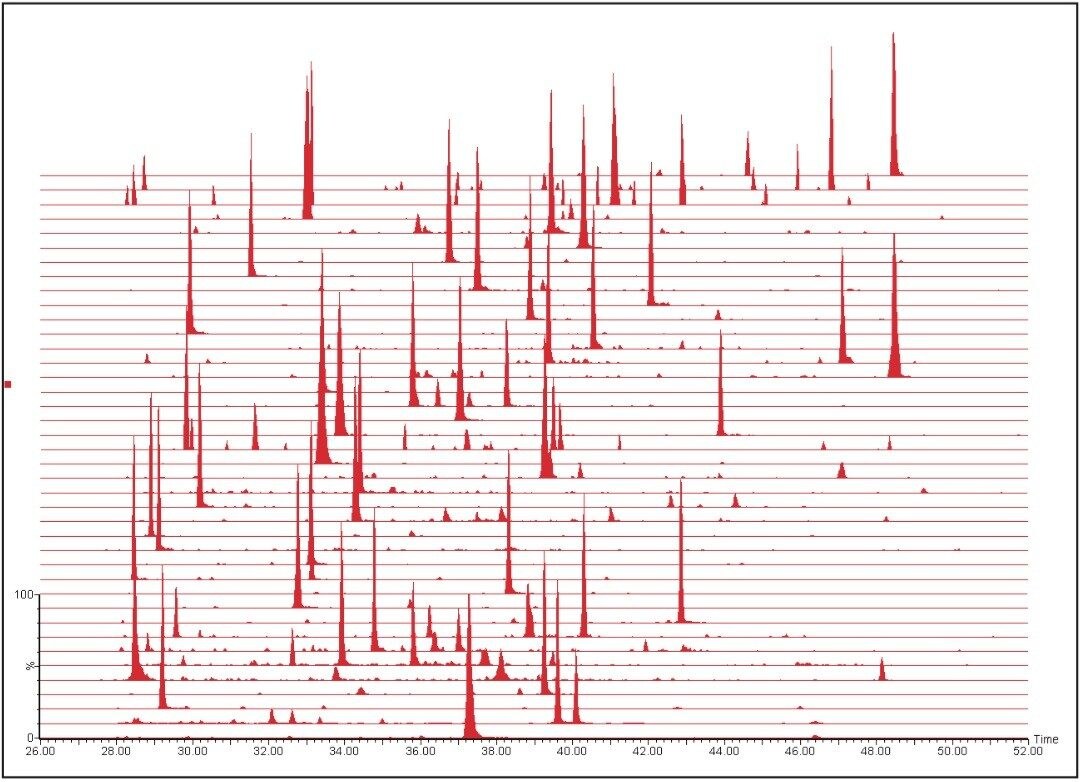
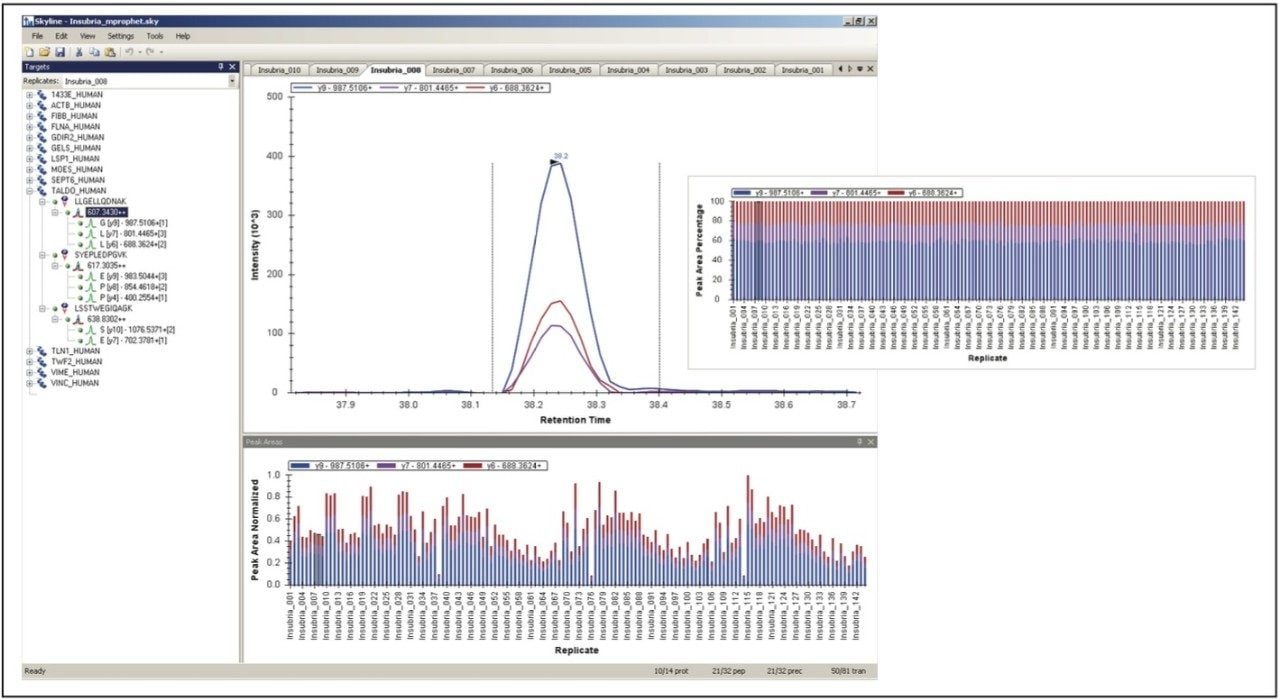
The resulting MRM chromatograms are shown in Figure 1, illustrating both good chromatographic performance and separation, as well as adequate MRM quantitation response for the majority of the proteins from the signature panel with a mere 100 ng of material loaded on-column. The relative intensities of the individual MRM transitions for one of the peptides of interest are illustrated in Figure 2. Throughout the complete experiment, comprising 147 LC-MS runs in total, including blanks and calibration standard runs, the relative areas of the individual transitions were constant, as shown by the inset of Figure 2 for LLGELLQDNAK. The average relative areas were 0.59 ± 0.01, 0.18 ± 0.02, and 0.23 ± 0.01 for y9, y7, and y6, respectively.

Figure 1. MRM chromatograms.
Figure 2. Relative and normalized intensities of individual MRM transitions.

The transitions were manually inspected and curated using Skyline and TargetLynx and analyzed and scored with mProphet. An example of the manual evaluation/curation process and analysis of the MRM transitions is shown in Figure 3. The left-hand panel of Figure 3 illustrates the tree transitions of LLGELLQDNAK, corresponding to the earlier mentioned fragments, respectively, illustrating similar chromatographic properties, i.e., retention time and peak shape/profile, and negligible apparent interference. The right-hand panel graphically overviews the mProphet result, which calculated error rates for the identification and provides scoring of the targeted peptides. The computational analysis confirmed manual curation in all instances, excluding objective or incorrect transition selection for the peptides of the protein signature.

Figure 3. Use of TargetLynx and mProphet for the evaluation and curation of the MRM transitions.

Selected peptides were used to quantify the signature proteins and classify the samples. Prior to relative quantification, the complete data set was normalized to a peptide of a housekeeping protein from one of the control samples.7 In the instance of transaldolase, three peptides were measured by means of MRM. The results shown in Figure 4 contrast the relative abundances of the peptides for the control (CO) and PD group samples. As can be seen, the regulation trend was in agreement for all peptides measured; moreover, the magnitude of the relative fold change was similar and the difference statistically significant in all instances. A subset of the measured peptides was used for classification.

Figure 4. Relative abundances of peptides for the control (CO) and Parkinson’s disease (PD) group samples.

The procedure afforded PD likelihood scores, which are summarized in Figure 5. As shown, the scores do not significantly overlap, illustrating that MRM quantification of the selected transitions provides a robust tool for the classification of subjects based on a protein signature identified from the analysis of proteomics discovery data obtained by a different technique such as two-dimensional electrophoresis.

Figure 5. Scoring and distinct classification of subjects based on the protein signature.

Conclusion

  • Manual and computational validation of protein signature MRM transitions were complementary and in agreement
  • Accurate determination of relative peptide and protein abundances using nanoscale LC-MS and MRM analysis
  • Statistical analysis of MRM determined peptide abundances allowed for the differentiation of Parkinson’s disease patients and control subjects

References

  1. Parkinson’s disease: genetics and pathogenesis. Shulman et al. Annu Rev Pathol. 2011; 6:193-222.
  2. Discovery and verification of panels of T-lymphocyte proteins as biomarkers of Parkinson’s disease. Alberio et al. Sci Rep. 2012; 2:953.
  3. Method for the in vitro diagnosis of Parkinson’s disease, Alberio et al. WIPO Patent No. 2013098786, 2013, July 4.
  4. A new conjoined RF ion guide for enhanced ion transmission, Giles and Gordon, ASMS 2010 poster (described in Travelling wave ion mobility, Giles, Int J Ion Mobility Spectrom, 2013; 16(1):1-3).
  5. Skyline: an open source document editor for creating and analyzing targeted proteomics experiments. MacLean et al. Bioinformatics. 2010 Apr 1;26(7):966-8.
  6. mProphet: automated data processing and statistical validation for large-scale SRM experiments. Reiter et al. Nat Methods. 2011 May; 8(5):430-5.
  7. Multiple-reaction monitoring-mass spectrometric assays can accurately measure the relative protein abundance in complex mixtures. Hoofnagle et al. Clin Chem. 2012 Apr; 58(4):777-81

Acknowledgement

The authors kindly acknowledge the volunteers who donated blood for the present study.

720004880, December 2013

Back To Top Back To Top