The application targeted the analysis glyphosate, glufosinate, and AMPA in tap and surface water. The limit of quantification in this study was measured at 1.0 ppb. EPA regulations have an MRL in water set at 700 ppb; the 1.0 ppb quantification limit clearly meets these regulations.
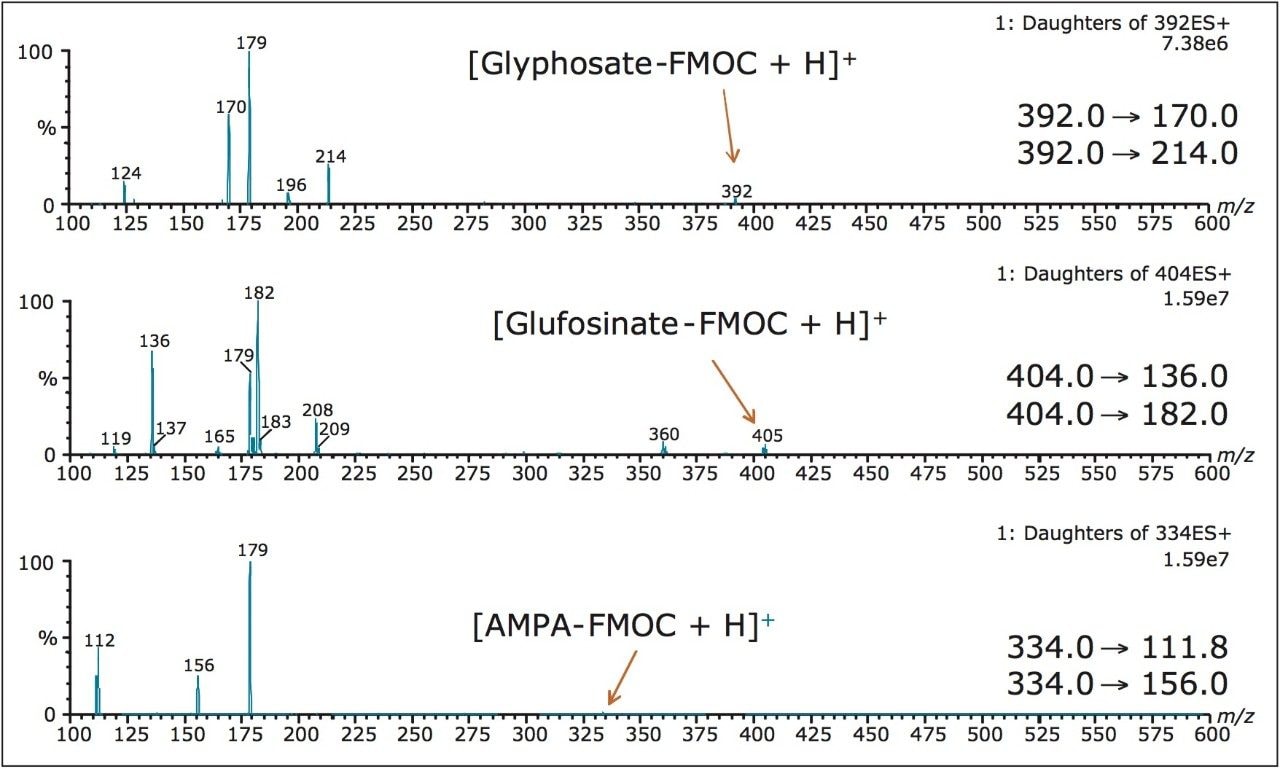
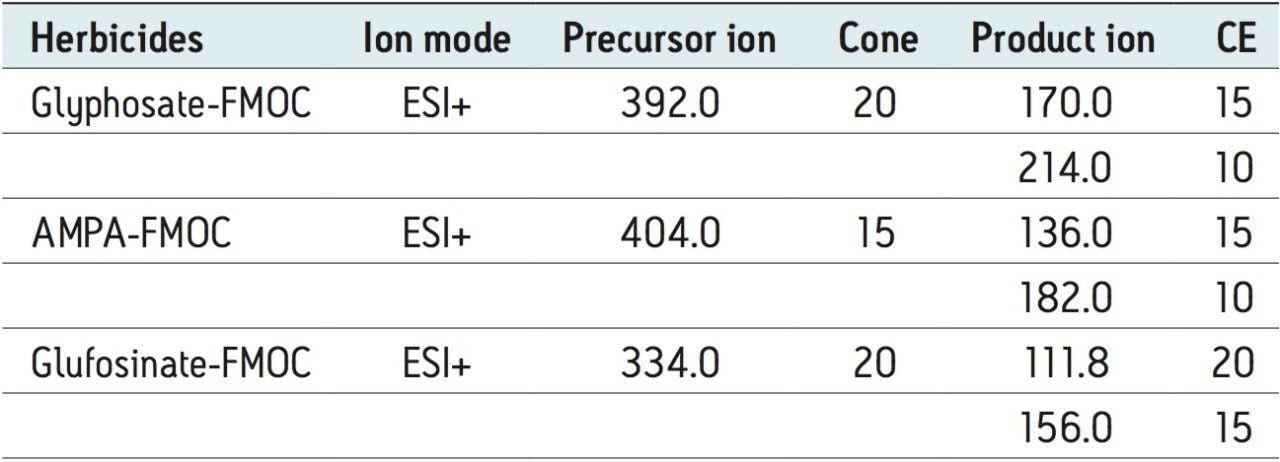
The popularity of glyphosate as a weed killer for crop protection is mainly due to its effectiveness against broadleaf plants. This herbicide acts as an enzyme inhibitor and is only active on growing plants. After absorption in soil, glyphosate is rapidly converted to its main metabolite (aminomethylphosphonic acid or AMPA). Due to its strong retention characteristic, it is not typically found in ground water, but can potentially contaminate surface waters through soil erosion and run-offs. Glyphosate’s toxicity is classified at Level III by the EPA; as such, the herbicide is regulated to protect public health. Due to its ionic structure, poor volatility, and low molecule mass, the analysis of glyphosate in water at low ppb is very difficult.1 Furthermore, the high polar nature, low volatility, and absence of chromaphores are the prime reasons for the analysis and detection using a derivatized format2 for herbicides. Several derivatization options have been evaluated and the ease-of-use approach of 9-fluorenylmethyl chloroformate (FMOC-Cl) for primary and secondary amines leads to a single multi-residue method for glyphosate and AMPA.3,4,5
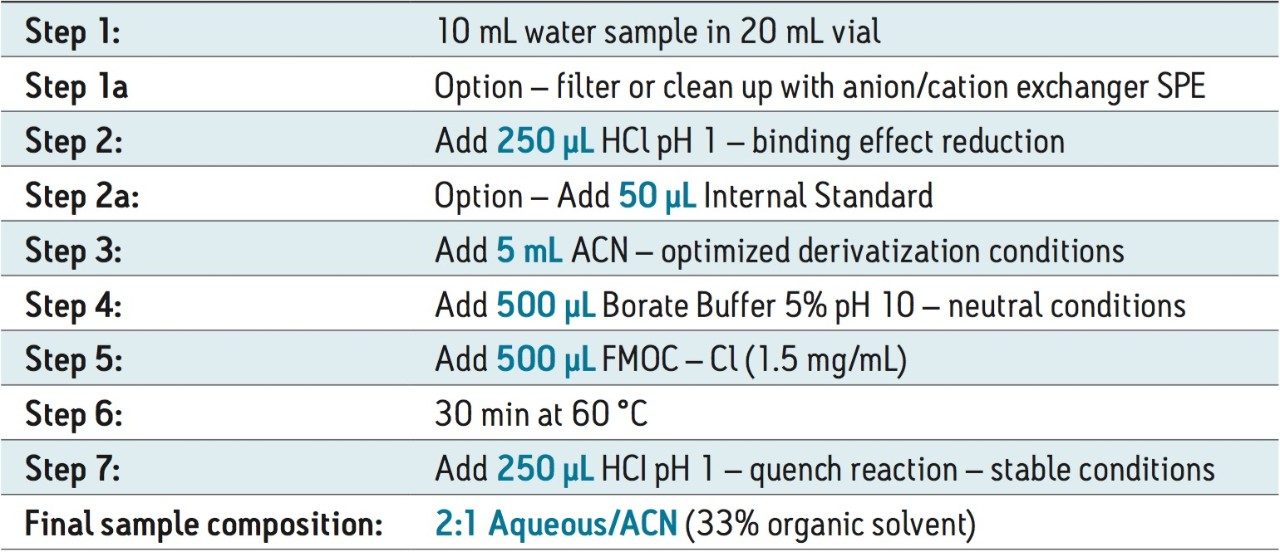
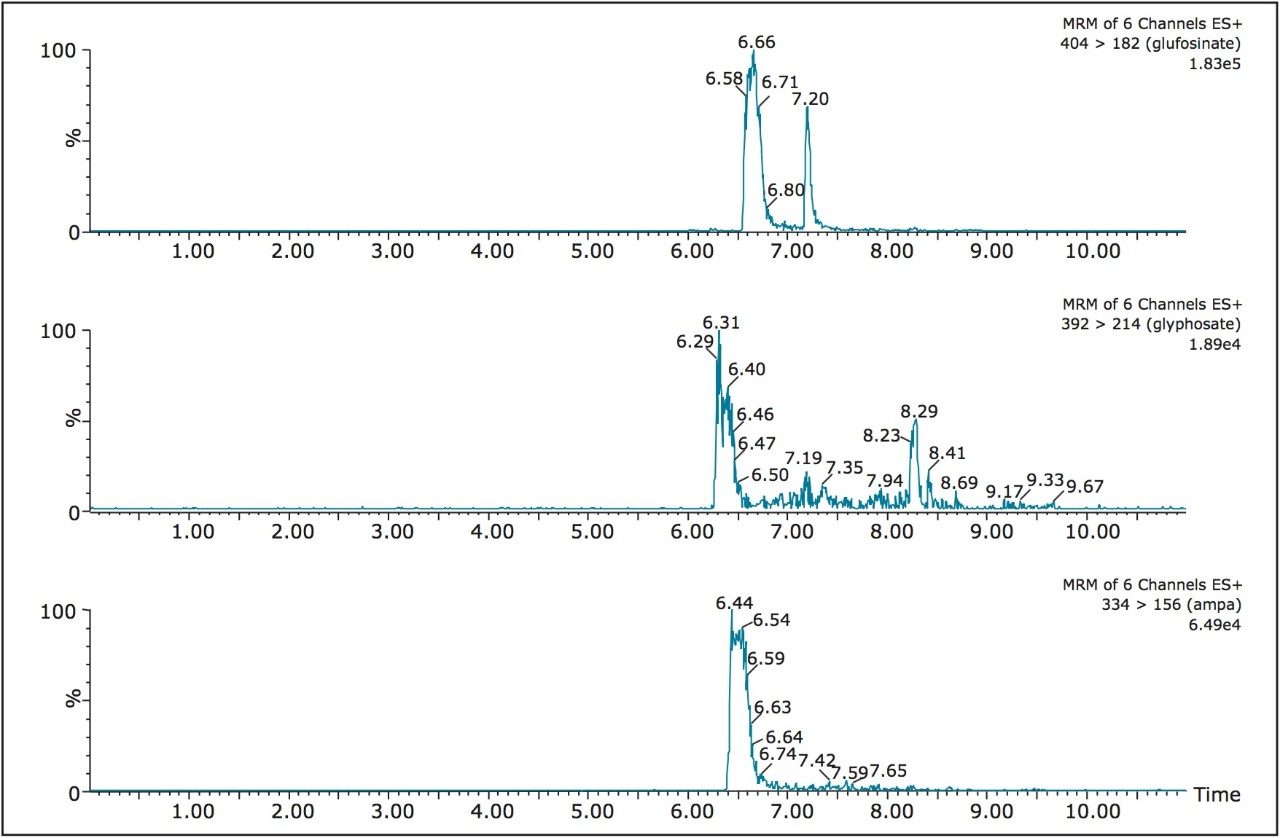
The analysis of glyphosate in drinking water usually requires elaborate sample extraction and clean up protocol to minimize matrix effects. One major drawback is the high amount of manual labor required to produce a clean extract, leading to increased operator-induced error. Since glyphosate is highly soluble in water, a weak reversed-phase sorbent is usually used for enrichment purpose. Another drawback is the insolubility of glyphosate in other solvents (MeOH, IPA, ACN, acetone, etc). The analysis of glyphosate is further complicated by the low solubility of FMOC in water. From this point, the main challenge is to bring the water-soluble analyte in contact with the organic-soluble (acetonitrile) derivatization agent (FMOC-Cl). This ultimately leads to a level of complexity regarding the ratio of water to organic solvent for optimum yield without causing a salting-out (glyphosate) or precipitation effect (FMOC). Also, with a high acetonitrile level present in the sample, potential breakthrough or peak distortion effect can be expected during separation.
LC-MS/MS and GC-MS/MS have been utilized for routine analysis since the introduction of hyphenated instrumentations in the 1970’s. By improving the level of automation, the next generation of hyphenated solutions are even better equipped to bring a measurable cost reduction to the overall analytical process (time, resources, and consumables). Time de-coupled chromatography6 offers automated sample handling and micro-extraction capabilities.
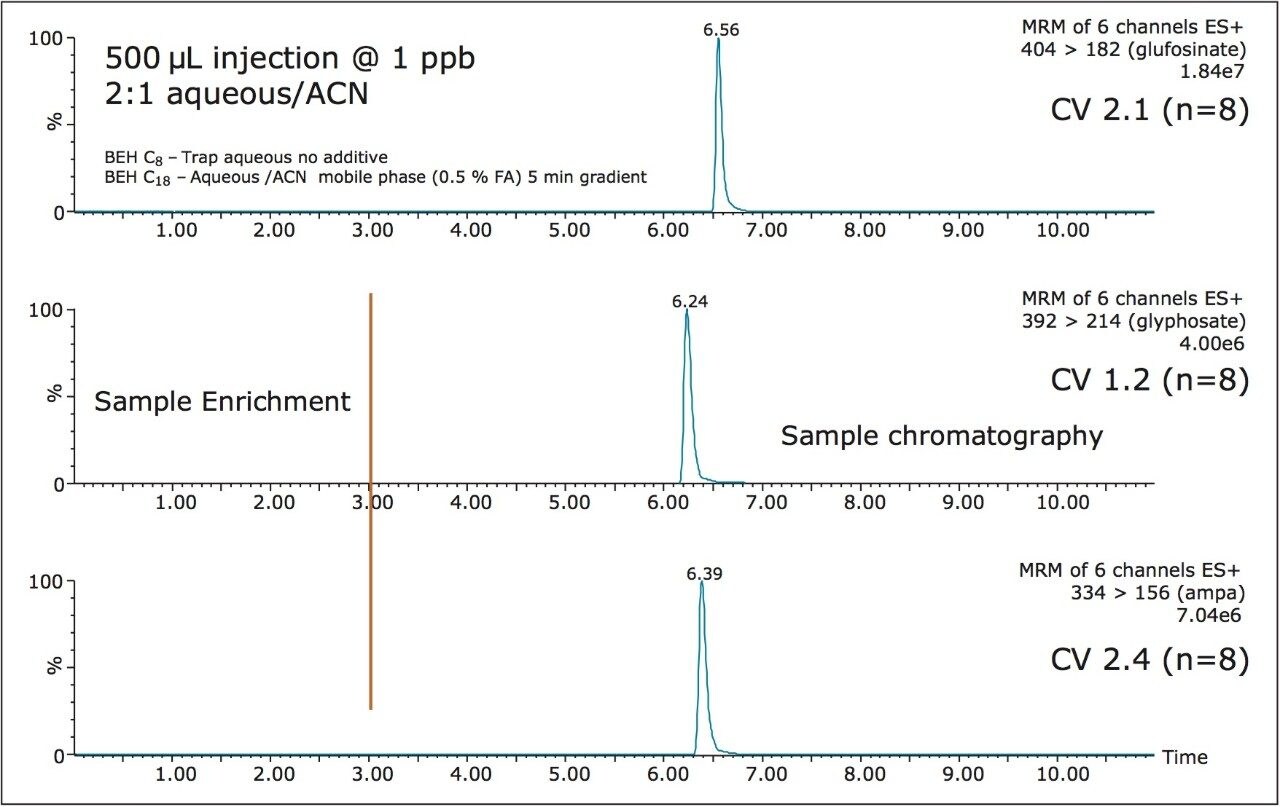
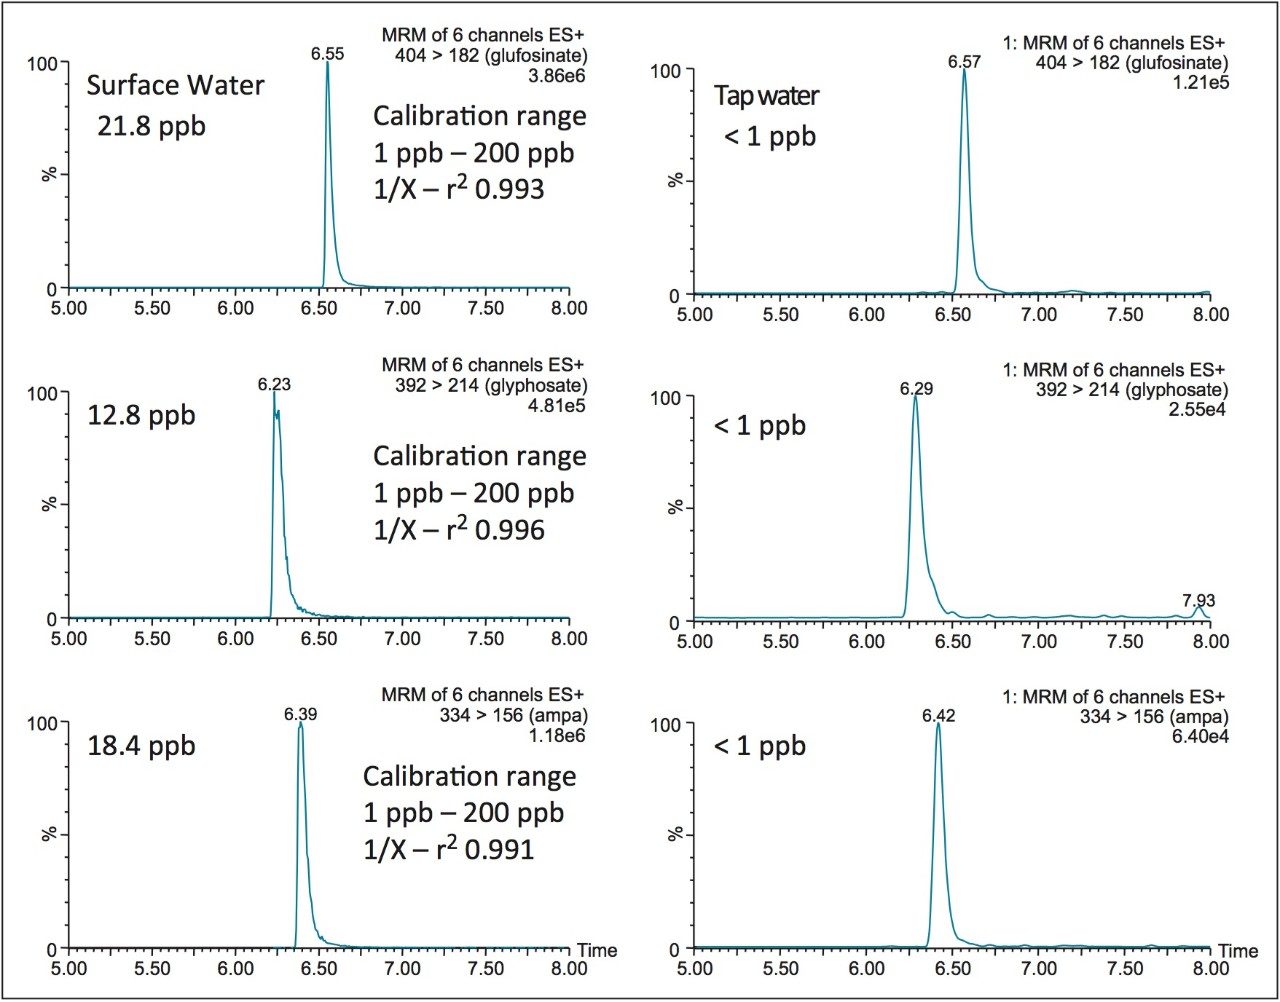
In this application, the analysis of glyphosate, glyfosinate, and AMPA in water was performed using three automated sequences for the derivatization and separation. The first part of the analysis performed the conversion of glyphosate and AMPA with the FMOC derivative. The second part of the analysis used an automated sequence for quenching the reaction. The final part of the analysis used an at-column dilution function for high-volume injection of the water:acetonitrile (66:33) sample. Up to 0.5 mL of derivatized sample was loaded onto a trap column. Several trapping sorbents were evaluated for trapping efficiencies. A weak reversed-phase sorbent gave the best performance. The trapped analytes were analyzed on a high resolution column using a back flush gradient. With this automated solution, glyphosate, glufosinate, and AMPA were detected at 1 ppb level (ug/L).
Loading Conditions |
|
---|---|
Column: |
Oasis HLB 20 μm |
Loading: |
Water pH 7 no additives |
Flow rate: |
2 mL/min |
At-column dilution: |
5% (0.1 mL/min pump A and 2 mL/min pump B) |
UPLC system: |
Open-Architecture UPLC 2D with at-column dilution |
Runtime: |
10 min |
Column: |
ACQUITY UPLC BEH C18, 2.1 x 50 mm, 1.7 μm |
Column temp.: |
60 °C |
Mobile phase A: |
Water + 0.5% formic acid |
Mobile phase B: |
Acetonitrile + 0.5% formic acid |
Elution: |
5 min linear gradient from 5% (B) to 95% (B) |
Flow rate: |
0.5 mL/min (pump C) |
Injection volume: |
500 μL |
MS System: |
Xevo TQ MS |
Ionization mode: |
ESI Positive |
Capillary voltage: |
3.0 kV |
Cone voltage: |
30.0 V |
Source temp.: |
150 °C |
Desolvation temp.: |
550 °C |
Desolvation gas: |
1100 L/hr |
Cone gas: |
50 L/hr |
Two MRM transitions (quantification and confirmation) for glyphosate, glufosinate, and AMPA were selected and optimized. The MRM conditions are listed in Table 1 and the corresponding spectrums are shown in Figure 1. For this application, finding the optimum chromatographic condition for this multi-residue analysis poses a difficult challenge due to the chemical diversity. The chromatographic conditions were tested on several trapping chemistries (Oasis HLB, XBridge C18, and XBridge C8) and separation chemistries (BEH C18 and HSS T3). The loading (low pH, high pH, and neutral pH) and eluting mobile phase (MeOH + 0.5% Formic acid; ACN + 0.5% Formic acid) were also optimized using an automated process. The derivatization protocol is listed in Table 2. Potassium borate and 9-fluorenylmethyl chloroformate (FMOC-Cl) were purchased from Sigma Aldrich. A 1-L pH 10 borate buffer (5%) was prepared and pH adjusted with ammonium hydroxide. The derivatization agent (FMOC-Cl) was prepared in 10 mL acetonitrile at 1.5 mg/mL concentration. Stock solutions of glyphosate, glufosinate, and AMPA were prepared in water at 1 mg/mL.
The step-by-step derivatization protocol is shown in Figure 2. The procedure begins with 10 mL of filtered water sample. The first step starts with the addition of 250 μL of hydrochloric acid (1N) to release any binding effect. Next, the automated protocol aspirate 5 mL of acetonitrile and dispense the entire volume in the sample vial. At this point in the protocol, an internal standard can be added to the sample vial. The next sequence deals with the addition of the borate buffer and the derivative agent. This sequence used a high pH buffer (0.5 mL borate buffer pH 9) to neutralize the amine functionality, followed by the addition of the FMOC derivative (0.5 mL). The reaction gave an optimum yield after 30 minutes at 60 °C temperature. The reaction is quenched and stabilized with the addition of 250 μL of hydrochloric acid (1N). At this point, the final sample composition is 2:1 aqueous:acetonitrile.
The starting point of any analytical protocol is the selection of chromatographic parameters to achieve well-resolved peaks for qualitative and/or quantitative analysis. Method development is typically performed with a trial-and-error approach, which ultimately leads to an optimized chromatographic method in a relatively short time. Another current practice is to select the most successful conditions in a systematic screening approach with the goal of quickly reaching optimized conditions. When utilizing multidimensional chromatography, the task of selecting optimized conditions can be quite difficult. However, with automation and a selection of key parameters, a large number of methods can be screened in a short time frame.6
For example, Figures 2 and 3 show the at-column dilution effect (ON and OFF) with optimized loading conditions, elution conditions, trapping chemistries, and separation chemistries. As shown, with the at-column dilution inactive, the chromatography shows a wide peak shape for all three herbicides (Figure 2). The distorted peak shape for glyphosate, glufosinate, and AMPA are properly re-focused using a 5% at-column dilution, as seen in Figure 3. The derivatization process followed by an immediate analysis produced excellent reproducibility values in the 2% range (N=8). The FMOC derivative was found to be stable for 24 hrs. No further evaluation was performed to determine the stability limit, since the derivatization and analysis of 50 water samples can be process during an overnight run (15 hrs).
The linearity of the FMOC derivative for glyphosate, glufosinate, and AMPA was measured between 1 ppb and 200 ppb with a 1/x weight and showed an r2 value of 0.996, 0.993, and 0.991, respectively. The quantification of tap and surface water sample were measured against a MilliQ filtered water calibration curve. The tap and surface water samples were pre-filtered with a 0.45 μm nylon filter with no further treatment. The tap water samples gave a positive signal below 1 ppb (LLOQ), thus giving indication of sub-ppb detection limit capability with this protocol. The surface water samples gave quantified values of 21.8 ppb, 12.8 ppb, and 18.4 ppb for glufosinate, glyphosate, and AMPA, respectively.
The application targeted the analysis glyphosate, glufosinate, and AMPA in tap and surface water. The limit of quantification in this study was measured at 1.0 ppb. EPA regulations have an MRL in water set at 700 ppb; the 1.0 ppb quantification limit clearly meets these regulations. Since FMOC has UV absorbance properties, similar detection limits could be reached with a photodiode array detector (PDA), thus offering a cost effective solution.
720005169, October 2014