In this study, which employs the Waters SYNAPT G2-S mass spectrometer, we determine and compare the quantification attributes of detection limit (LOD), quantification limit (LOQ), and linear dynamic range for three data-acquisition modes: full-scan MS, MSE and Tof-MRM.
High resolution mass spectrometry (HRMS) has been widely adopted in drug discovery and development organizations. In medicinal chemistry, drug metabolism and pharmacokinetics, and impurity identification, the use of HRMS has revolutionized qualitative screening and structure confirmation. Although triple quadrupole mass spectrometry (MS) remains the gold standard for quantitation, advances in the technology of HRMS platforms have led to improved selectivity, dynamic range, linearity, sensitivity, and a consequent increased usage and interest in HRMS for quantitative studies. In the presence of complex matrix interferences that might prove challenging for triple quadrupole MS approaches, the markedly different nature of HRMS data acquisition can achieve the selectivity and sensitivity for successful quantitation.
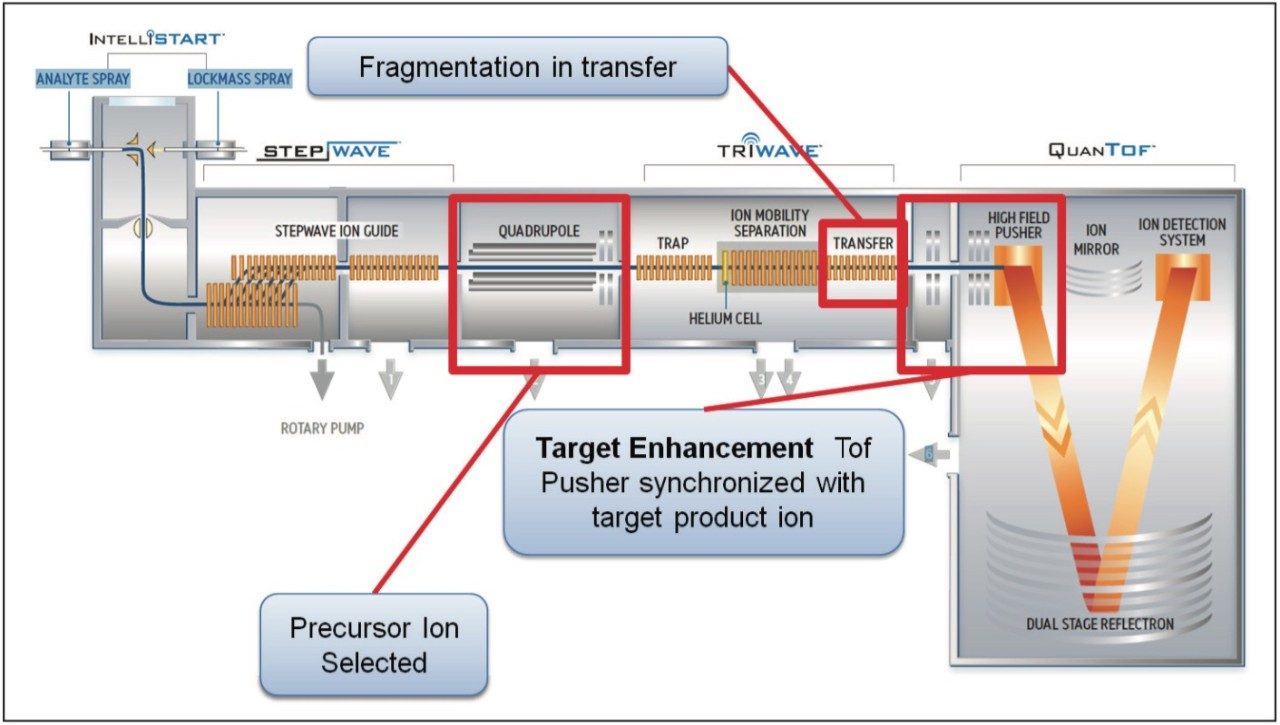
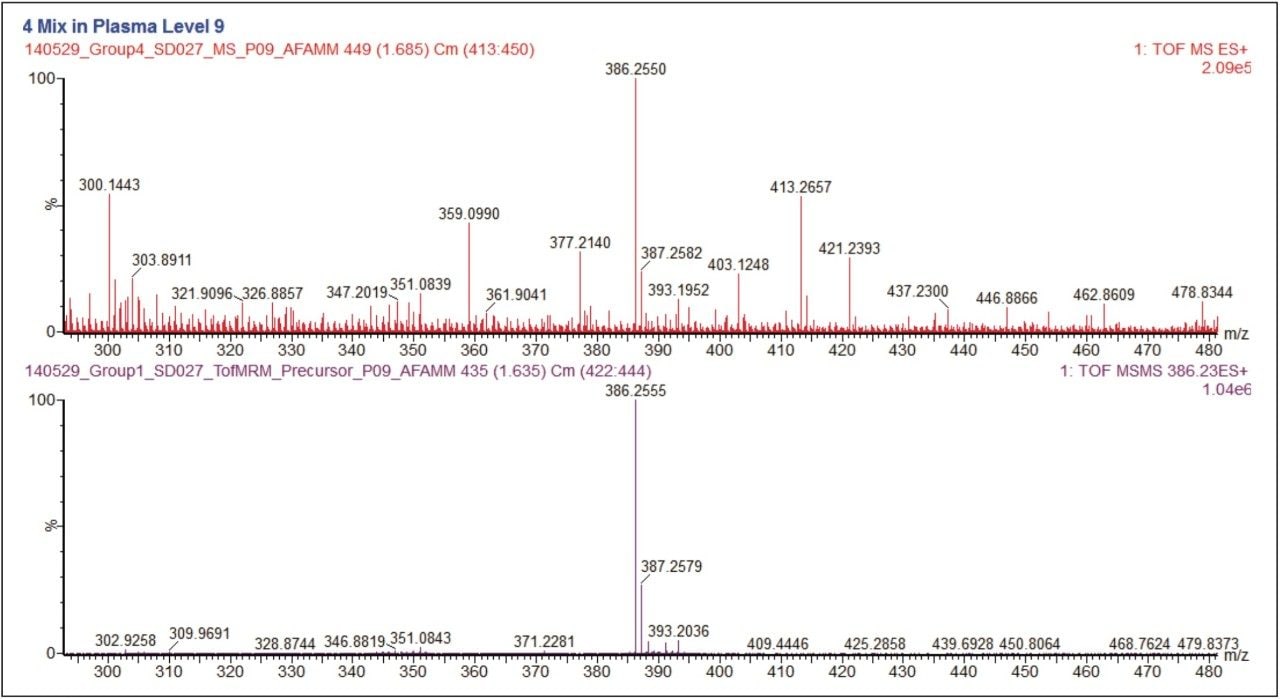
Recently, for quantitative analysis, Waters introduced a new targetenhancement mode of data acquisition, Tof-MRM, on the SYNAPT G2-S HDMS and Xevo G2-XS systems. In this mode, a precursor ion is selected by the quadrupole and, optionally, fragmented in the collision cell. The Tof pusher is then synchronized with the m/z of the precursor or a product ion, maximizing the duty cycle for a target m/z range and effecting an increase in response and selectivity.1 With the addition of the Tof-MRM mode of acquisition, these platforms receive a boost in selectivity and sensitivity, which can be exploited for enhanced HRMS quantitation.
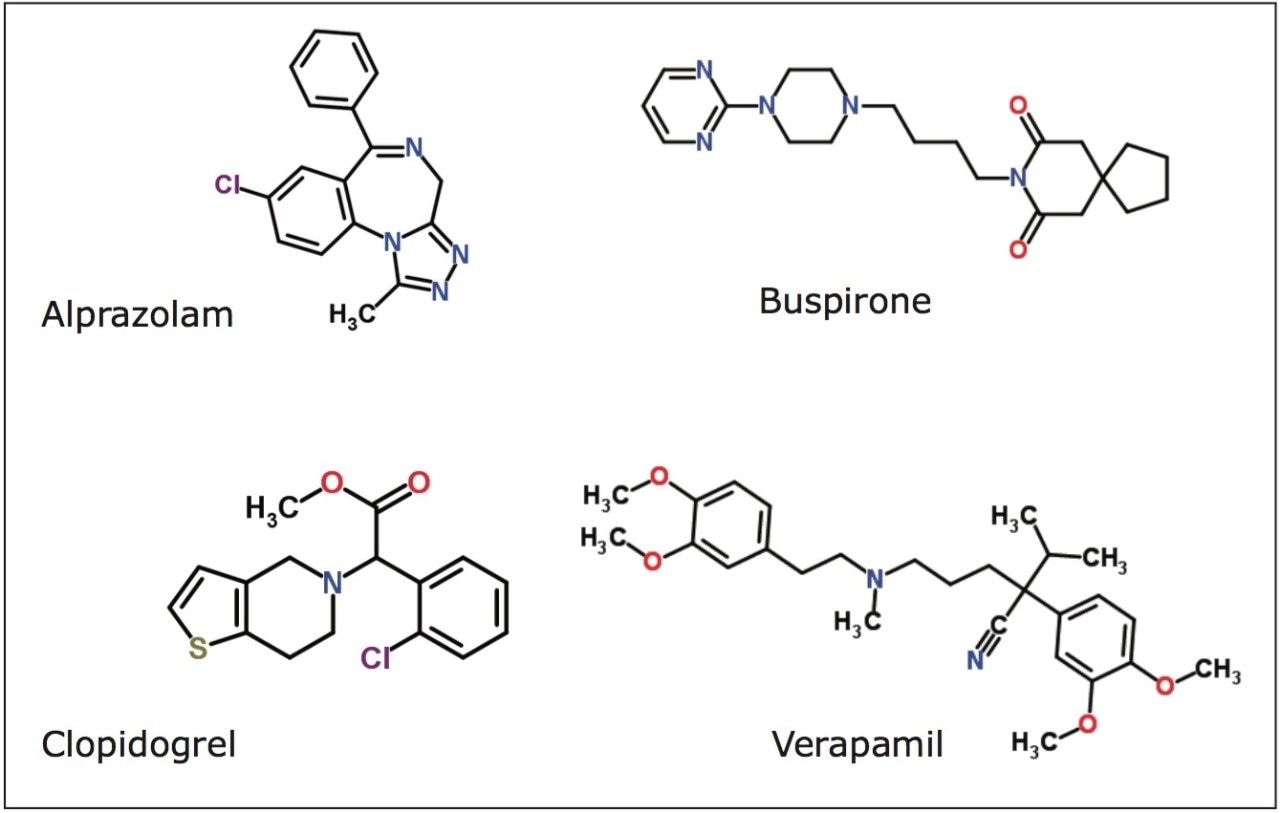
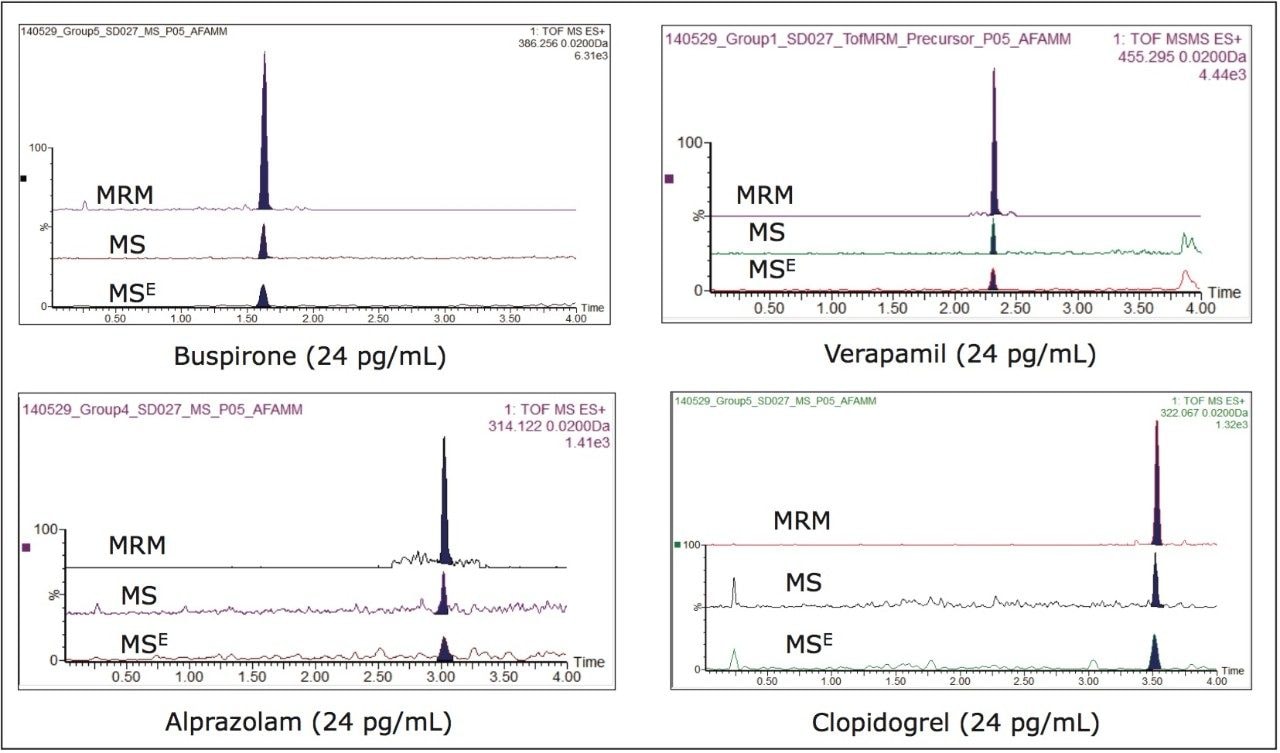
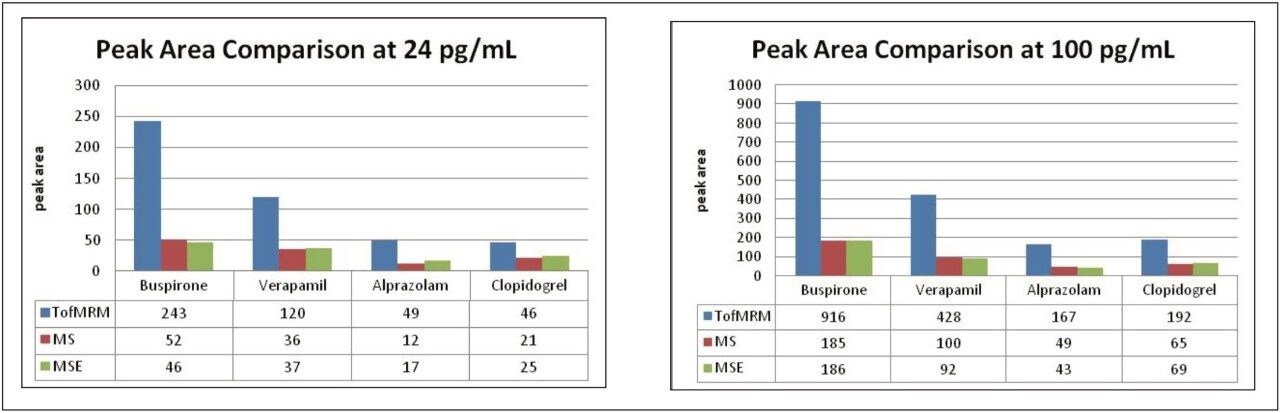
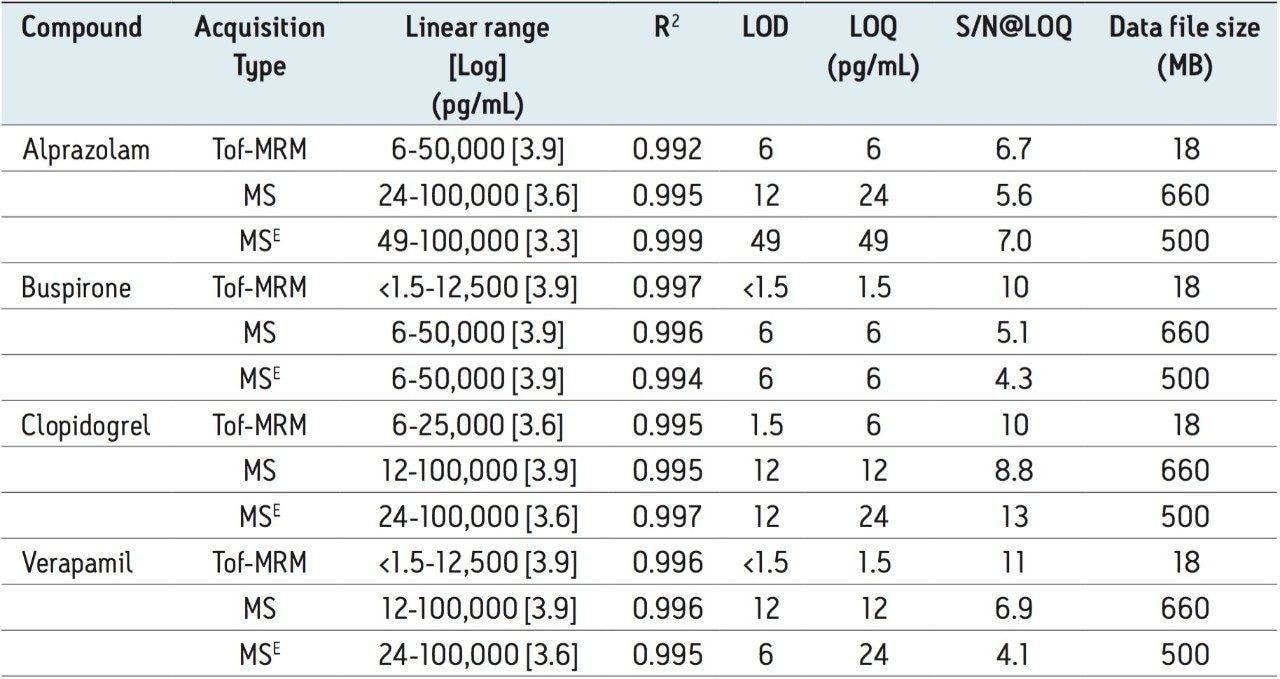
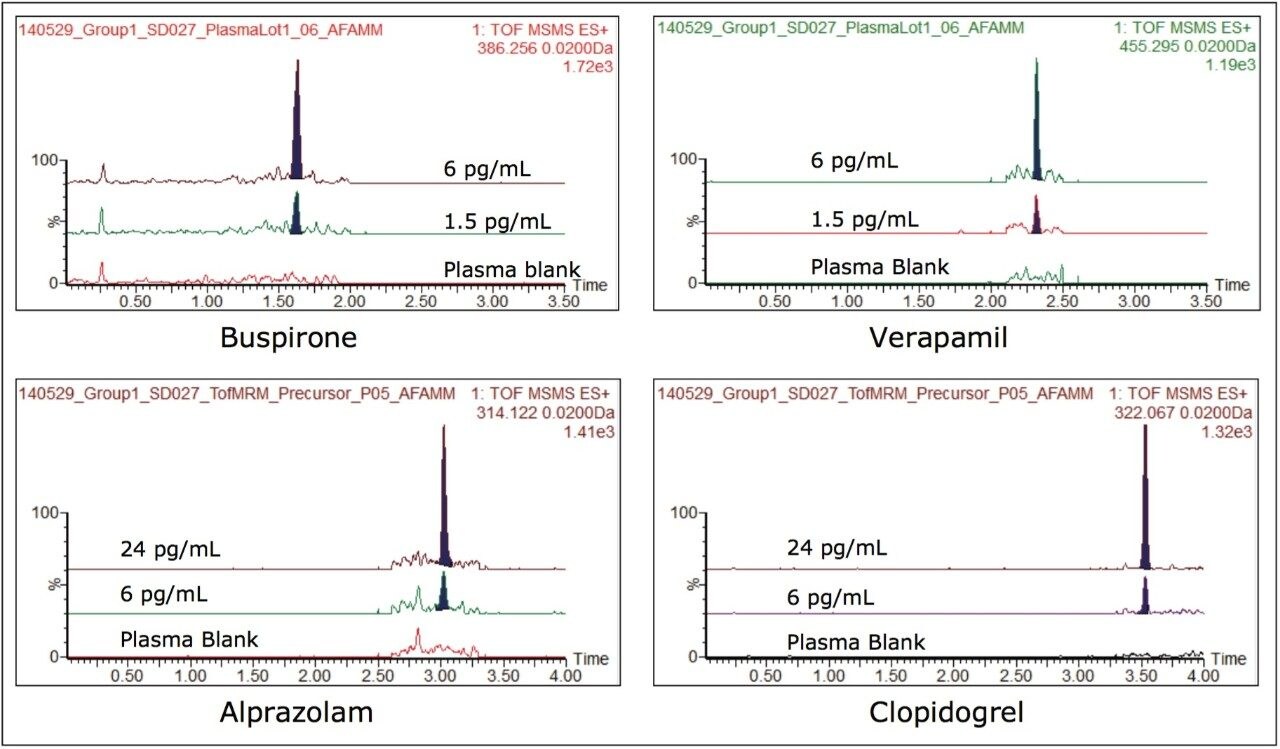
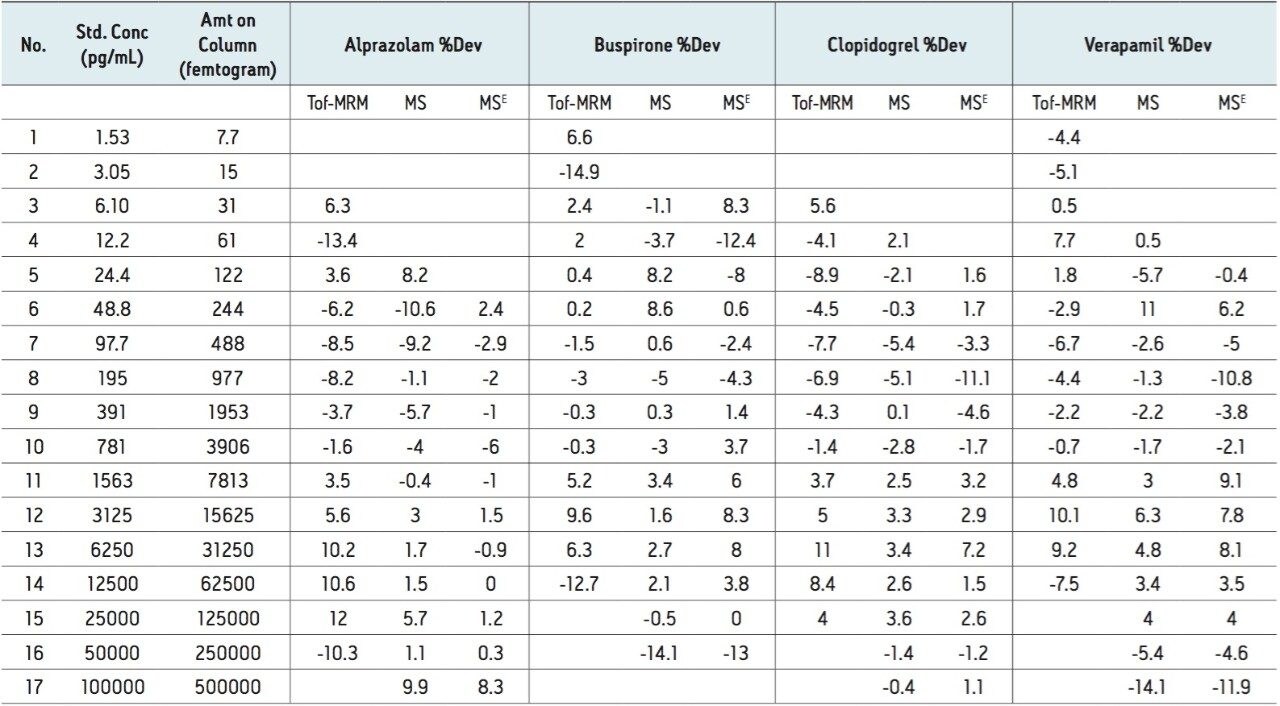
In this study, which employs a SYNAPT G2-S instrument, we determine and compare the quantification attributes of detection limit (LOD), quantification limit (LOQ), and linear dynamic range for three data-acquisition modes: full-scan MS, MS,E and Tof-MRM.
LC system: |
ACQUITY UPLC I-Class |
Column: |
ACQUITY BEH C18 2.1 x 50 mm, 1.7 μm |
Column temp.: |
60° C |
Sample temp.: |
10° C |
Injection volume: |
5 μL |
Flow rate: |
0.6 mL/min |
Mobile phase A: |
water with 0.1% formic acid |
Mobile phase B: |
90% acetonitrile/ 10% methanol with 0.1% formic acid |
Gradient: |
2–60% B in 4 minutes, 60-95% in 1 minute, held at 95% B for 1 minute before reverting to initial conditions. The total run time was 7 minutes. |
MS system: |
SYNAPT G2-S HDMS |
Ionization mode: |
ESI+, resolution mode(>20,000 FWHM) |
Acquisition range: |
50-1000 m/z |
Capillary voltage: |
1 kV |
Cone voltage: |
30 V |
Source temperature: |
120 °C |
Desolvation gas temp.: |
500 °C |
Cone gas flow: |
20 L/h |
Desolvation gas flow: |
800 L/h |
Scan time: |
0.2 s, continuum |
MS settings: |
precursor mass |
MSE collision energy (CE) settings: |
low CE, 2.0 eV; high CE, ramp 10-30 eV |
Tof-MRM settings: |
precursor mass (see “Results and Discussion” section for details) |
Quenched and diluted human plasma was prepared by adding three volumes of acetonitrile to human plasma. After centrifugation, the supernatant was transferred to a new vial and diluted 1:1 with H2O. The test compounds (alprazolam, verapamil, buspirone, and clopidogrel) were combined as 100 ng/mL for each in a solution containing quenched and diluted human plasma, prepared as stated above. The mixture was then serially diluted 1:1 using quenched and diluted human plasma to achieve a concentration range from 100 ng/mL to ~1 pg/mL.
The analytical LC/MS experiments were performed on a Waters ACQUITY UPLC I-Class System coupled with a SYNAPT G2-S QTof Mass Spectrometer. Waters MassLynx Software was used for data acquisition, and TargetLynx Software was used for data processing.
Four compounds – alprazolam, verapamil, buspirone, and clopidogrel (Figure 1) – were quantified as a mixture using the ACQUITY UPLC I-Class System and SYNAPT G2-S HDMS. Data were collected using positive electrospray ionization and three acquisition modes: MS, MS,E and Tof-MRM (resolution mode). The MS mode collects full-scan data over a wide mass range for precursor ions. The MSE mode collects full-scan data of both precursor and product ions by alternating low CE and high CE scans in the same experiment. This all-the-dataall- the-time mode provides spectral information about target compounds, as well as fragmentation patterns, to aid in structural elucidation. As such, the MSE approach is frequently used for Quan-Qual screening workflows. For pure quantitation, we acquired data using the Tof-MRM mode with target enhancement. In the Tof-MRM mode, the precursor ion is selected in the quadrupole (MSMS). The Tof pusher at the detector entrance is then synchronized with the targeted masses using the instrument’s Target Enhancement function, which significantly increases the duty cycle for ions of interest. Tof-MRM can be used to analyze intact ions (parent > parent, no CE applied) or fragment ions (parent > fragment, CE applied) transitions. Tof-MRM-enhanced transmission mode dramatically enhances ion counts for targeted ions versus generic full-scan modes, which is then coupled with selectivity afforded through quadrupole precursor selection1 and accurate HRMS monitoring of the target ion. A schematic of the target-enhancement mode of data acquisition on the SYNAPT G2-S is shown in Figure 2.
In this study, the same LC conditions, cone voltage, source settings, data acquisition speed and the same data-processing parameters (data smoothing and integration) were used for the data collected in each of the three acquisition modes. Generic LC and MS conditions were used with no compound-specific optimization.
Figure 3 shows the extracted mass chromatogram for each compound, comparing all three modes of data acquisition using the 24 pg/mL sample as an example. Figure 4 shows the measured peak area, comparing the modes at a low concentration of 24 pg/mL and a mid-range concentration of 100 pg/mL. These plots indicate that the responses from Tof-MRM are 2–8 times higher than those of either of the scanning modes of data acquisition. The responses for MS and MSE modes were of comparable magnitude. Mass spectral differences between fullrange MS and Tof-MRM scan modes are illustrated for buspirone in Figure 5. Compared with MS full-scan data, the Tof-MRM mass spectrum shows a higher signal intensity and less baseline noise, leading to enhanced sensitivity and selectivity. Points across the peak were measured for the Tof-MRM mode of acquisition using representative samples for all four compounds: 49 pg/mL as the low concentration and 12,500 pg/mL levels as the high concentration. All peaks contained between 13 and 19 points (base to base), indicating Tof-MRM data sampling is fast enough for quantitation purposes when coupled with UPLC chromatography.
Determination of the detection limit and linear dynamic range was based on the regulated bioanalysis method of validation criteria. The limit of detection was determined according to a signal-to-noise ratio of greater than 3. The linear range was determined using values that met the standard bioanalysis criteria of less than 15% deviation across the concentration range. A weighting of 1/X2 was used for the calibration curve fitting. Table 1 shows the compiled results for all four compounds using these three data-acquisition modes.
Results indicate that, in the presence of human plasma, all three modes–particularly the Tof MRM mode–produced an excellent, linear dynamic range. That range, from 3.6 to 3.9 log units, enabled routine quantitation studies. When compared with MS and MS,E Tof-MRM demonstrated an enhancement factor of 4 – 8 in LOD and 4 – 12 in LOQ. For three of the four compounds, the SYNAPT G2-S instrument attained 1.5 pg/mL, or 7.5 femtograms on-column sensitivity, and a signal-to-noise ratio of 10 or greater using data acquired using the Tof-MRM mode. Figure 6 shows the Tof-MRM, extracted-mass chromatograms of the four compounds, including the plasma blank, at LOQ concentration and at LOQ concentration x 4. Table 2 presents a summary of the percent deviation of all data points used in calculating LOD, LOQ, and linear dynamic range.
The last column in Table 1 is the data file size per injection for each mode of data acquisition. The file size for Tof-MRM is approximately 20 MB, representing a more than 95% reduction compared with MS and MS.E Such a reduction in file size enables quicker data processing, less demand on data storage, and ease of use for quantitative applications.
The powerful modes of data acquisition, flexibility, and the superior acquisition speed of the Tof platform2 have aided scientists in their various research activities. Building on this progress, we have shown that, in the presence of human plasma, the Tof-MRM mode of data acquisition can achieve on-column limits of detection that are in the low-femtogram range. It does so, moreover, with an excellent signal-to-noise ratio, fit for purpose linear dynamic range, and with high bioanalytical performance. These excellent quantitation attributes will enable scientists to adopt MRM-like workflows, which have been successful for triple quadrupole MS. Quantitation on HRMS platforms can further close the sensitivity gap between these instrument types and provides a unique opportunity to attain high MRM assay performance through selectivity which is different and complementary to conventional tandem MRM technologies. We expect to witness an extended involvement of HRMS platforms in applications where both quantitative and/or qualitative end points are desired. The mixed capability of qualitative modes to support screening applications combined with focused modes to support throughput and routine assay will further increase the use of HRMS platforms in pharmaceutical applications. Tof-MRM has direct applicability for bioanalysis, targeted metabolism, stability, and PK/PD profiling studies with low detection limits.
720005182, September 2014