• Application Note

Rapid Analysis of Sudan and Other Prohibited Dyes in Chili Powder Using the ACQUITY UPLC H-Class System with Xevo TQD

Rapid Analysis of Sudan and Other Prohibited Dyes in Chili Powder Using the ACQUITY UPLC H-Class System with Xevo TQD

  • Dimple D. Shah
  • Evelyn Goh
  • Jennifer A. Burgess
  • Waters Corporation

Abstract

In this application note, a fast and sensitive method utilizing a simple QuEChERS extraction procedure, UPLC separation with MS/MS for the detection and quantification of 11 Sudan and azo-dyes is presented. Separation and detection of all listed dyes was achieved in 12 minutes.

Benefits

  • Separation and detection of all listed dyes in 12 minutes.
  • Simple sample preparation using QuEChERS and a rapid detection method for routine applications where high sample throughput is required.
  • Low limits of quantification using the ACQUITY UPLC H-Class System and Xevo TQD
  • TargetLynx Application Manager rapidly identifies, quantifies, and highlights all samples that exceed the required action limit

Introduction

Sudan dyes are synthetic dyes frequently used for coloring plastics and other synthetic materials. Due to their intense color, these dyes have been fraudulently used to enhance the color of various food products such as spices, mixtures of spices, and sauces. According to the International Agency for Research on Cancer (IARC), the Sudan and azo-dyes have both been classified as potential genotoxic and/or carcinogenic substances. Their degradation products are also considered to be carcinogenic. Because of this, the European Union (EU) Commission Decision 2003/460/EC mandates testing for Sudan I in chili powder, or for products containing chili powder. In 2004, the decision was expanded to include Sudan II, III, and IV (2004/92/EC).

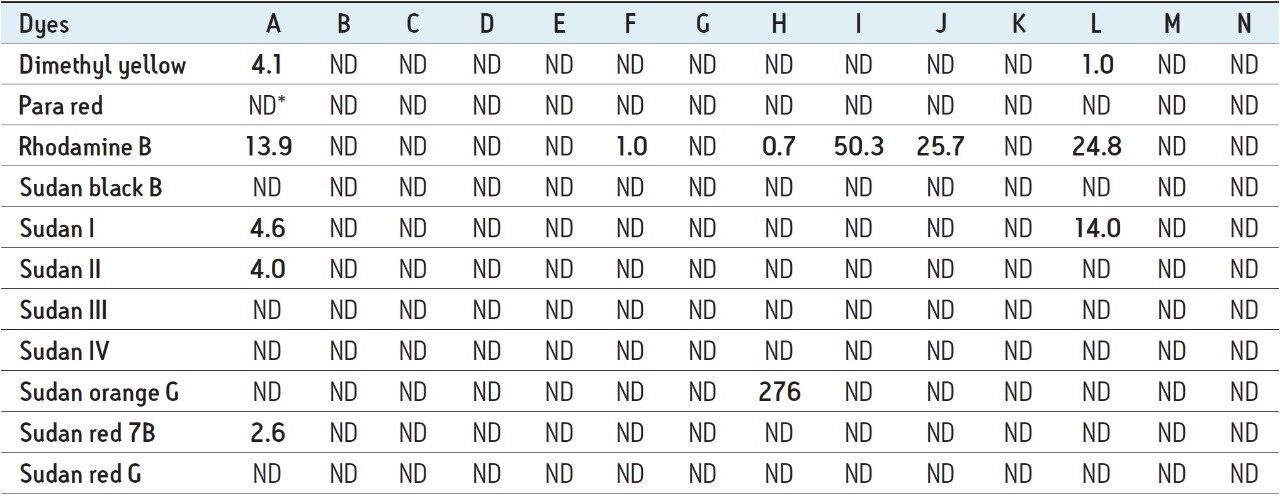
Despite the prohibition on using Sudan dyes as food additives, RASFF (Rapid Alert System for Food and Feed) made a number of positive identifications in 2011 and 2012 with the detection of Sudan dyes in different food products.1

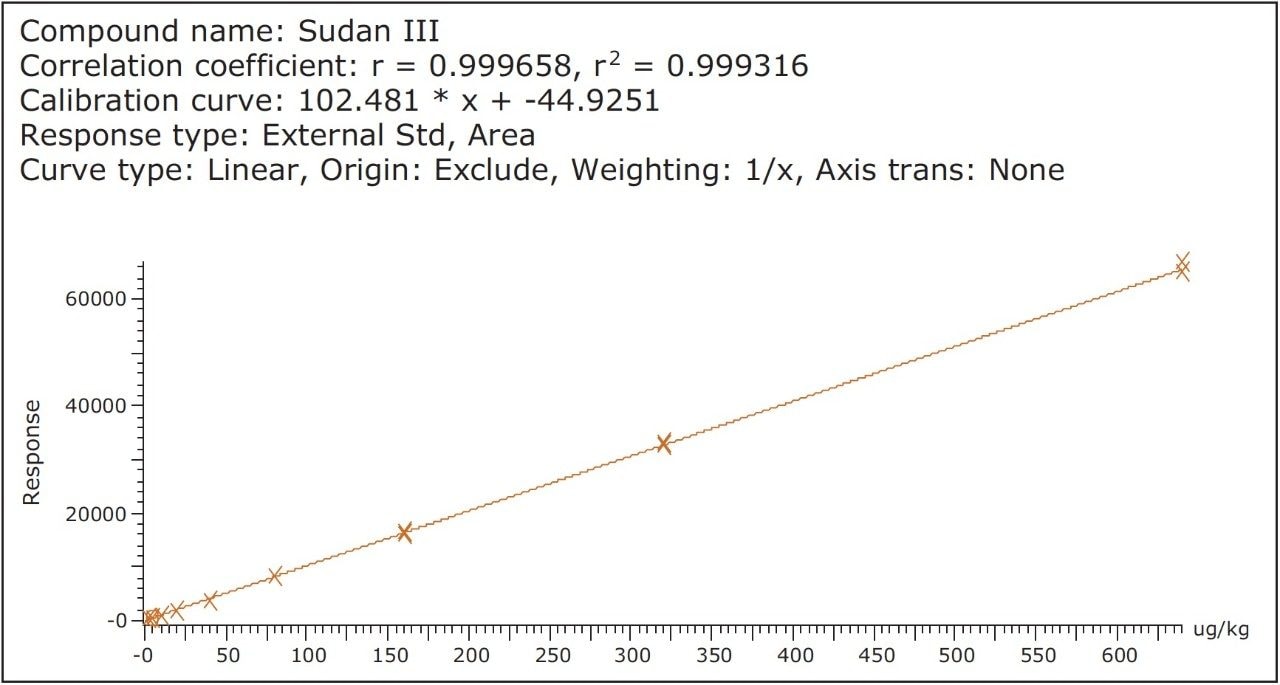
Since the illegal use of these dyes constitutes a risk to public health, detection using simple, sensitive, and reliable analytical methods is extremely important. According to food testing laboratories in Europe, the typical reporting limits are between 10 to 50 μg/kg for the Sudan and azo-dyes in spices.

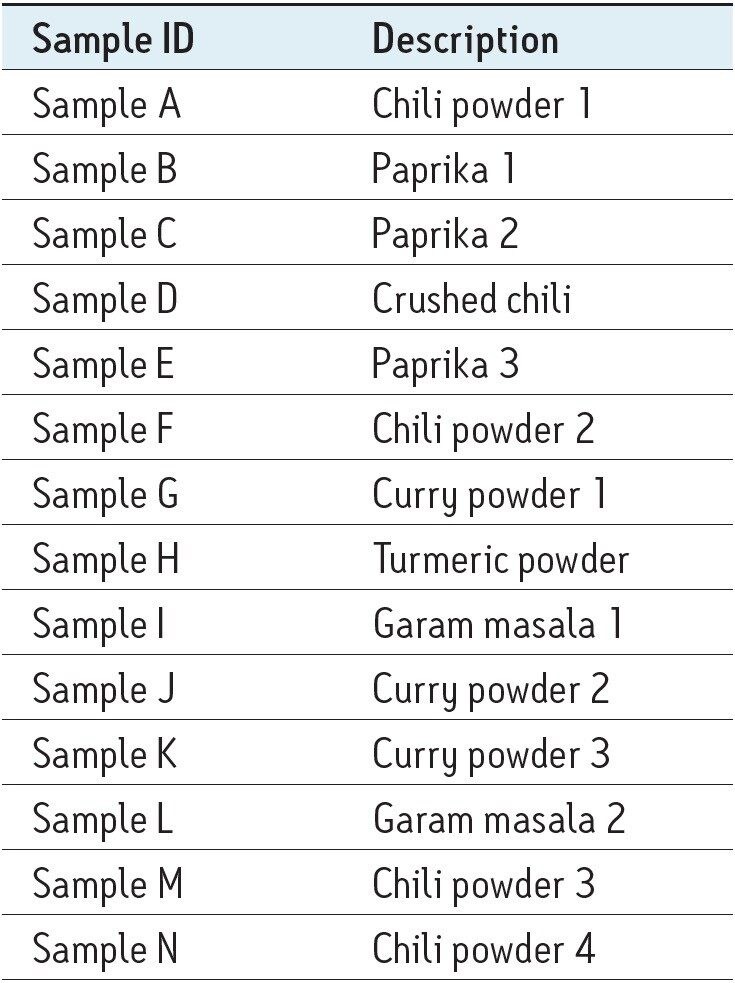
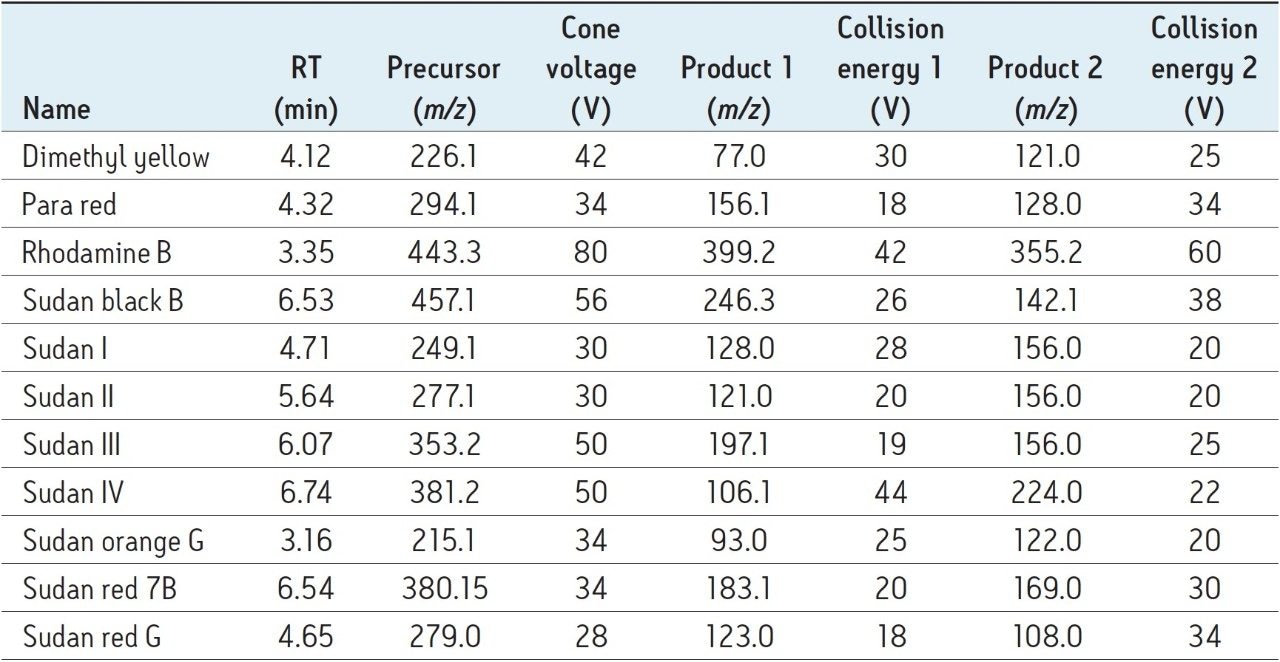
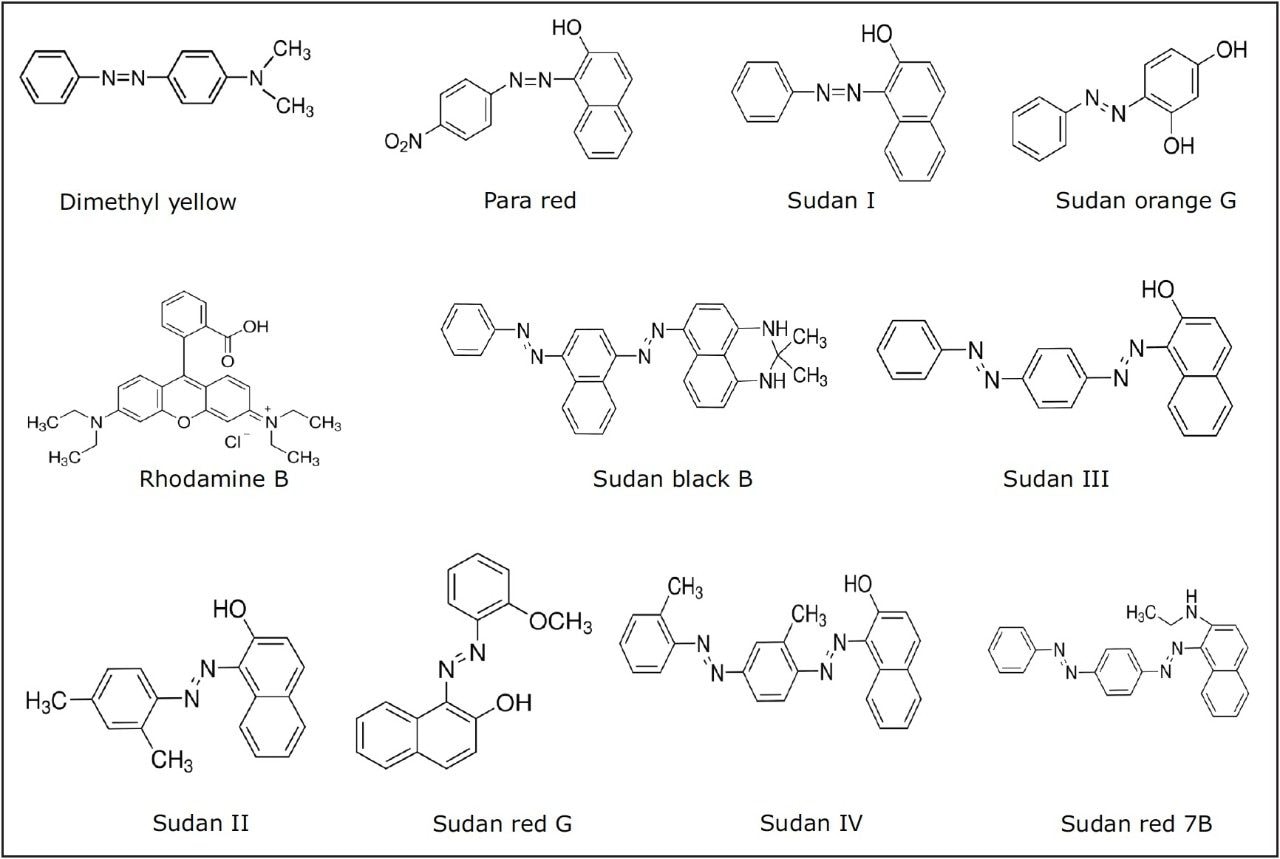
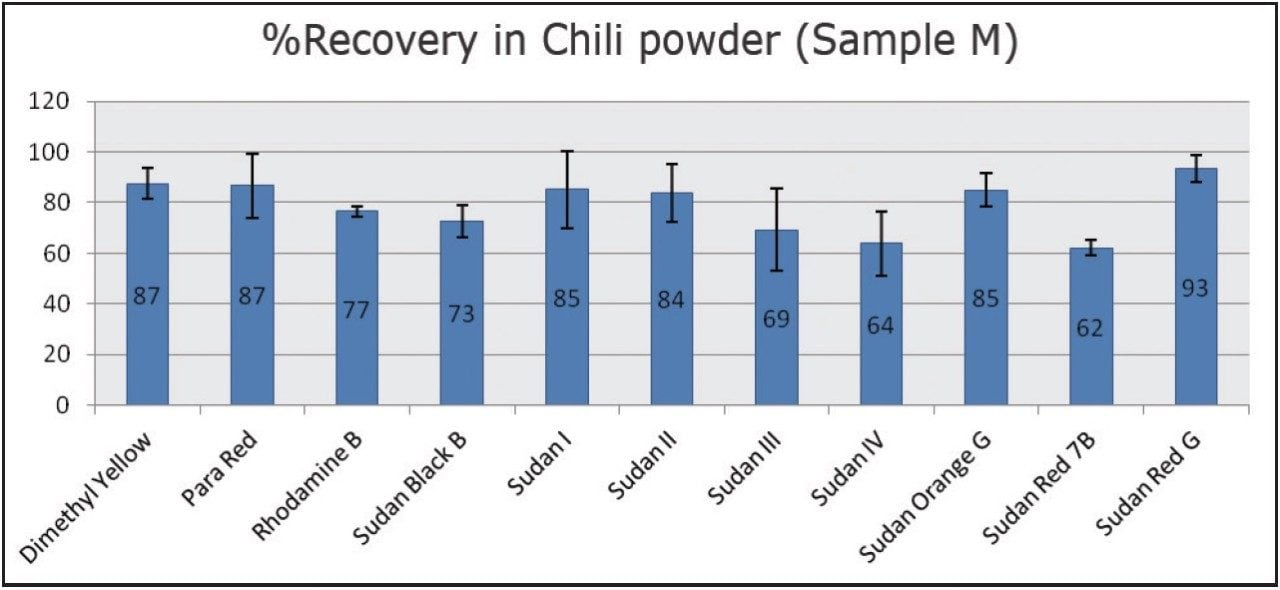
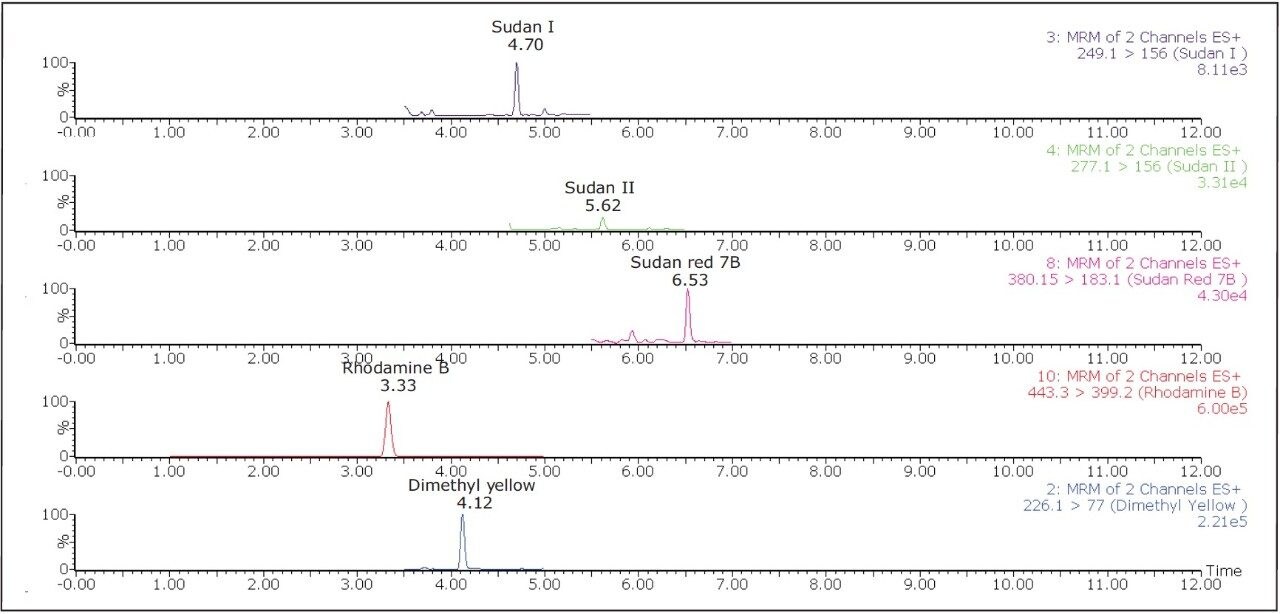
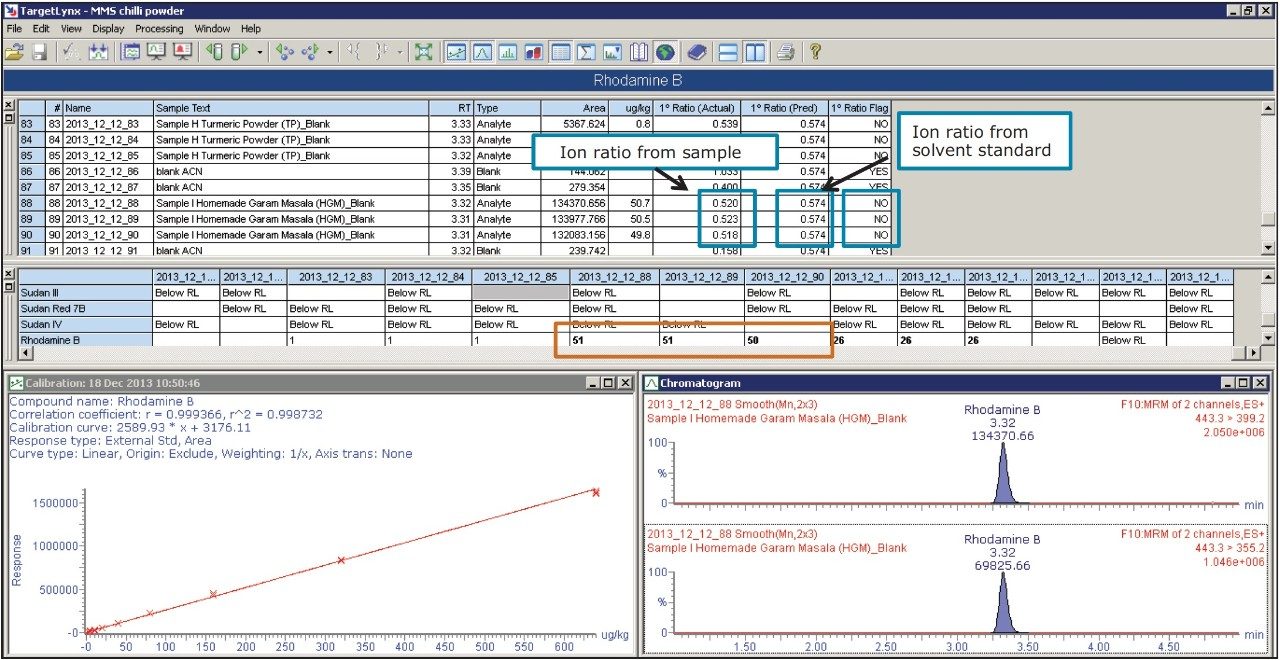
In this application note, a fast and sensitive method utilizing a QuEChERS extraction procedure, UPLC separation with MS/MS for the detection and quantification of 11 Sudan and azo-dyes is presented.

Experimental

UPLC conditions

LC system:

ACQUITY UPLC H-Class

Mobile phase A:

Water + 0.1% formic acid

Mobile phase B:

Methanol + 0.1% formic acid

Mobile phase C:

Acetonitrile + 0.1% formic acid

Column:

ACQUITY UPLC BEH C18 2.1 x 100 mm, 1.7 μm

Column temp.:

45 °C

Injection volume:

5 μL

Flow rate:

0.4 mL/min

Total run time:

12.0 min

Wash solvent:

Acetonitrile

Purge solvent:

10% Methanol

Gradient:

Time(min)

%A

%B

%C

Initial

80

10

10

0.5

40

30

30

5.0

0

50

50

9.0

0

50

50

9.1

80

10

10

12.0

80

10

10

MS conditions

MS system:

Xevo TQD

Ionization mode:

ESI +

Capillary voltage:

1.5 kV

Source temp.:

150 °C

Desolvation temp.:

500 °C

Desolvation gas:

1000 L/hr

Acquisition:

Multiple Reaction Monitoring (MRM)

Standards

Sudan I, III, IV, Sudan red G, Sudan red 7B, Sudan black B, Dimethyl yellow, and Rhodamine B were purchased from Sigma-Aldrich. Sudan orange G and Para red were purchased from AccuStandard , and Sudan II red was purchased from Fisher Scientific. The stock solutions for each dye were prepared at 1 mg/mL in acetonitrile. The working solutions were also prepared in acetonitrile.

Samples

The samples analyzed in this application note included contaminated and non contaminated chili and curry powders. The sample type for each of the 14 samples is listed in Table 1.

Table 1. List of sample identifier codes and descriptions

Sample preparation

The Waters DisQuE QuEChERS (CEN method 15662)2 was used to prepare all samples. Briefly, two grams of powder (chili/curry/turmeric) was weighed into a centrifuge tube. The sample was mixed with 8 mL of water and vortexed for 30 seconds. The mixture was extracted with 10 mL of acetonitrile followed by the addition of QuEChERS CEN material (4 g MgSO4, 1 g NaCl, and 1.5 g sodium citrate). The resulting mixture was shaken for one minute. The tube was then centrifuged at 4000 rpm for five minutes. The supernatant was placed into vials for analysis.

Acquisition and processing methods

For all compounds, two MRM transitions were obtained from the Quanpedia Database.

The most intense transition was used for quantification (quantifier ion), and the second most intense transition was used for confirmation (qualifier ion). The dwell times for the transitions were automatically optimized to give a minimum of 12 points across each chromatographic peak. The MRM transitions, cone voltages, and collision energies for all compounds along with expected retention times are shown in Table 2.

The data were acquired using MassLynx Software, v. 4.1, and processed using the TargetLynx Application Manager.

Results and Discussion

The chemical structures of all 11 dyes are shown in Figure 1. The separation of these dyes was achieved using the ACQUITY UPLC H-Class System in 12 minutes. Figure 2 shows an overlay of the MRMs for each of the dyes in a solvent standard at 2 μg/L (equivalent to 10 μg/kg in spice sample) for all of the dyes except Para red which is at 10 μg/L (equivalent to 50 μg/kg in spice sample).

Figure 1. Dye structures.
Figure 2. Overlay of MRMs for the 10 dyes at 2 μg/L (equivalent to 10 μg/kg in the spice sample) and Para red at 10 μg/L (equivalent to 50 μg/kg in the spice sample) in solvent.

Linearity

Chili powder 3 (Sample M) was screened for all of the dyes listed in Table 2 and it was found to be free from those dyes. Hence it was selected to evaluate the method recovery. Solvent and matrix match spiked calibration (MMS) curves were spiked with the 10 dyes at concentrations of 0.5, 1, 2, 4, 8, 16, 32, 64, and 128 μg/L (equivalent to 2.5 to 640 μg/kg in spice sample), while Para red was spiked five times higher than the other dyes and injected in triplicate. Linearity was checked by calculating the co efficient of determination (r2) of the calibration curve and was found to be above 0.99 for all of the dyes in sample M and the solvent calibration curve. Figure 3 shows an example of MMS curve for Sudan III in Sample M.

Figure 3. Matrix match spiked calibration curve of Sudan III from 0.5 ppb to 128 μg/L ppb (equivalent to 2.5 to 640 μg/kg in Sample M).

Recovery

To calculate method recovery, Sample M was pre-spiked (n=3) at 10 μg/kg with 10 dyes and 50 μg/kg for Para red and subjected to the sample preparation steps described above. The pre-spiked samples were quantified against the MMS curves and recoveries were calculated for dyes in Sample M. The percentage recoveries are shown in Figure 4 and ranged from 60% to 95%. In order to account for the high matrix complexity and improve recoveries of some of the analytes, one or more internal standards could be added to the method.

Figure 4. %Recovery of 10 dyes at 10 μg/kg and Para red at 50 μg/kg in chili powder 3 (Sample M).

Sample analysis

14 samples of the various spices listed in Table 2 were extracted as previously described and were then analyzed in triplicate. All of the samples were quantified against the matrix match spiked calibration curve of Sample M. Table 3 shows the concentrations measured in the 14 samples.

Table 3 Detected concentration of the dyes in the 14 samples (concentration in μg/kg).
*ND = Not detected

Out of the 14 samples, six samples were found to contain Sudan and azo-dyes. Sample A contained five of the banned dyes, out of which Rhodamine B (13.9 μg/kg) was detected above the action limit. Sudan orange G was found at a moderately high level (276 μg/kg) in curry powder (Sample H). Rhodamine B was detected above the 10 μg/kg action limit in Samples I, J, and L. Sudan I was found in Sample A (4.6 μg/kg) and in Sample L (14.03 μg/kg). These detection results demonstrate the applicability of this method as a sensitive and selective method for the determination of illegal dyes in various spices. Hence, this method could be validated further for accurate quantification.

Figure 5 shows chromatograms of all of the compounds that were detected in Sample A.

Figure 5. Chromatograms of all of the detected dyes in chili powder 1 (Sample A).

In this survey, one of the chili powders that was found to be free from all targeted dyes was used as a matrix match spiked calibration curve. It should be noted, however, that in some samples, the matrix effects could be quite different from one matrix to another. In order to ensure accurate quantification when dealing with such complex matrices, the use of isotopically labeled internal standards or the standard addition method is recommended.

TargetLynx Application Manager offers the ability to quickly identify samples that contain analytes of interest, or it can be used to highlight any parameters that fall outside a set of analytical quality control criteria. Figure 6 shows the results from Sample I, where Rhodamine B was found above 10 μg/kg. As shown in Figure 6, TargetLynx rapidly identified the compounds above the recommended action limit and highlighted the concentrations (shown in the red box, Figure 6). Along with quantification, the TargetLynx report also showed confirmation of the compound using the expected ion ratios. If the ion ratios of the samples were outside the tolerance limit specified by EU Commission Decision 2002/657/EC, they would be automatically flagged.

Figure 6. TargetLynx identified the compounds that exceeded the concentrations of dyes in Sample I that were above the required action limit.

Matrix effects

Matrix effects were investigated by comparing the slopes of the matrix-matched calibration curves with the slopes of the solvent calibration curves. Table 4 shows the matrix effects in Chili powder 3 (Sample M). A slope ratio value of 1 indicates no matrix effects, a matrix factor of less than 1 indicates ion suppression, and a matrix factor of greater than 1 indicates ion enhancement.

Table 4. Matrix effects in Chili powder 3 (Sample M).

In Sample M, Sudan I, IV, and Rhodamine B showed very little or no matrix effect, while an ion suppression effect was observed for Sudan orange G, Dimethyl yellow, Sudan II, Sudan red G, Sudan red 7B, and Para red. Sudan black B and Sudan III showed an ion enhancement effect in Sample M. Despite the vast differences in matrix effect, this method can detect and quantify all the above listed dyes in various spices tested. In order to further reduce matrix effects, additional sample preparation could be employed.

Conclusion

This method combines an easy sample preparation procedure with QuEChERS and UPLC-MS/MS detection for the analysis of 11 Sudan and azo-dyes in various spices.

Even with significant matrix effects, the ACQUITY UPLC H-Class System with the Xevo TQD provided the detection levels required for the analysis of Sudan and azo dyes in contaminated samples.

Automated peak processing, quantification, and flagging using the TargetLynx Application Manager allows users to quickly identify non-compliant samples.

References

  1. https://webgate.ec.europa.eu/rasff-window/portal/
  2. http://www.waters.com/webassets/cms/library/docs/720003048en.pdf

720004975, March 2014

Back To Top Back To Top