In previous work, it was shown that the ACQUITY QDa Detector provides a complementary detection technique to optical detection for monitoring biotherapeutics, and how it can improve the productivity of a single workflow. Cost effective techniques that add value and can be implemented into existing workflows with minimal effort are highly desirable in the pharmaceutical industry. A natural extension of this work was to evaluate the performance of the ACQUITY QDa Detector using a representative biotherapeutic drug.
In this work we demonstrate that the ACQUITY QDa Detector is compatible with conventional LC mobile phases and is able to detect and accurately report mass information for peptides over a wide molecular weight range typical of biotherapeutic peptide maps. These results establish the ACQUITY QDa Detector as an ideal addition for the biopharmaceutical analyst’s lab that will afford increases in productivity and the confidence of data analysis for routine peptide analysis assays.
Recently it was shown that the Waters ACQUITY QDa Detector, as a complementary orthogonal detection technique, provides a cost effective means of obtaining mass spectral data for peptides within an existing optically based LC workflow.1
This proof-of-principle work, while compelling, was confined to a reference set of seven peptides that ranged in molecular weight from 899 to 2,848 Da. In contrast, biotherapeutics, such as monoclonal antibodies, when enzymatically treated can produce peptides that span nearly three orders of magnitude in size (150 to 7,000 Da).2 In addition, ion pairing agents such as trifluoroacetic acid (TFA) are often used for peptide mapping. Given that TFA negatively impacts ionization efficiency, it can be rather challenging to obtain mass spectrometry (MS) based peptide maps.3,4 As previously established, orthogonal techniques that add value and can be employed with minimal cost and effort are highly desirable in the pharmaceutical industry.5
The objective of this application note is to demonstrate that the ACQUITY QDa Detector provides a simple and cost-effective solution for detecting peptides across a wide molecular weight range (one more typical of biotherapeutic peptide maps) and that this mass detection capability is fully compatible with traditional optically based LC peptide monitoring assays that incorporate TFA or formic acid (FA). To this end, we have employed an existing method for the monitoring of peptide maps of trastuzumab, a therapeutic monoclonal antibody (mAb), using the ACQUITY QDa Detector.
The ACQUITY UPLC CSH 130Å, C18 (2.1 x 100 mm, 1.7 μm) and ACQUITY UPLC BEH 300Å, C18 (2.1 x 100 mm, 1.7 μm) Columns were conditioned as outlined by the column care and use manual. Chemical reagents were purchased from Sigma Aldrich and used as received. Sequence grade modified trypsin from Promega was used to prepare a digest of trastuzumab (reduced and alkylated) at a concentration of 0.5 mg/mL as outlined by the manufacturers’ protocol.
LC system |
ACQUITY UPLC H-Class |
Detectors |
ACQUITY UPLC TUV ACQUITY Qda |
Absorption wavelength |
215 nm |
Vials |
Total Recovery vial 12 x 32 mm glass, screw neck, cap, nonslit |
Columns: |
ACQUITY UPLC Peptide CSH 130Å, C18, 1.7 μm, 2.1 x 100 mm ACQUITY UPLC BEH 300Å, C18, 1.7 μm, 2.1 x 100 mm |
Column temp. |
65 °C |
Sample temp. |
4 °C |
Injection vol. |
8 μL |
Mobile phase A |
H2O, 0.1% TFA |
Mobile phase B |
Acetonitrile, 0.1% TFA |
Mobile phase C |
H2O, 0.1 % FA |
Mobile phase D |
Acetonitrile, 0.1% FA |
Time (min) |
Flow (mL/min) |
%A |
%B |
%C |
%D |
---|---|---|---|---|---|
Initial |
0.2 |
97 |
3 |
0 |
0 |
3 |
0.2 |
97 |
3 |
0 |
0 |
120 |
0.2 |
65 |
35 |
0 |
0 |
127 |
0.2 |
20 |
80 |
0 |
6 |
130 |
0.2 |
20 |
80 |
0 |
0 |
131 |
0.2 |
97 |
3 |
0 |
0 |
140 |
0.2 |
97 |
3 |
0 |
0 |
Time (min) |
Flow (mL/min) |
%A |
%B |
%C |
%D |
---|---|---|---|---|---|
Initial |
0.2 |
0 |
0 |
99 |
1 |
3 |
0.2 |
0 |
0 |
99 |
1 |
120 |
0.2 |
0 |
0 |
67 |
33 |
127 |
0.2 |
0 |
0 |
20 |
80 |
130 |
0.2 |
0 |
0 |
20 |
80 |
131 |
0.2 |
0 |
0 |
99 |
1 |
140 |
0.2 |
0 |
0 |
99 |
1 |
Sample rate: |
2 points/sec |
Mass range: |
350 – 1250 Da. |
Cone voltage: |
10 V |
Capillary voltage: |
1.5 kV |
Probe temp.: |
500 °C |
Informatics for data collection and processing: |
Empower 3 Software, SR2 |
From our initial proof-of-principle work we established that the ACQUITY QDa Detector is well-suited for confirming the identity and purity of peptides across a wide molecular weight range.1 For that work, the TFA concentration in the mobile phases was kept relatively low, at 0.02%, in order to minimize ion supression.3,4 However, higher concentrations of TFA are often incorporated in optical based (UV) peptide analyses for improving the performance of conventional C18 columns.6
To demonstrate that the ACQUITY QDa Detector is compatible with such legacy methods, a peptide map of trastuzumab was acquired using conventional concentrations of TFA. For this experiment, a 0.5 mg/mL solution of trypsin digested, reduced, and alkylated trastuzumab was analyzed using mobile phases prepared with 0.1% TFA v/v. As shown in Figure 2A, a 120 minute gradient (see experimental) was used to generate an optical based peptide map using an ACQUITY UPLC BEH 300Å, C18, 1.7 μm Column. The corresponding mass detector response from the ACQUITY QDa, which was in-line post optical detector, is shown in Figure 2B. A high degree of correlation was observed for the peptides detected using the orthogonal detection configuration. From this data, it is evident the ACQUITY QDa Detector is capable of providing mass spectral data using legacy methods that incorporate ion pairing agents such as TFA.
As new columns are introduced to the market with improved performance with FA versus TFA,7 the question arises if legacy methods can be transferred to new columns more efficiently with the addition of a mass detector.
To test this, an ACQUITY UPLC Peptide CSH C18, 130Å, 1.7 μm Column was used to generate a peptide map using the same sample as shown in Figure 2. For this experiment, mobile phases were prepared with FA at a concentration of 0.1% v/v, and a 120-minute gradient was implemented to generate a peptide map.
As shown in Figure 3 and demonstrated in previous work,8 the unique surface chemistry of charged surface hybrid (CSH) columns facilitates the use of FA, resulting in increased detector response. Given that both columns offer the ability to monitor peptides with the ACQUITY QDa Detector, further interrogation of the data was performed to evaluate the use of different ion-pairing agents.
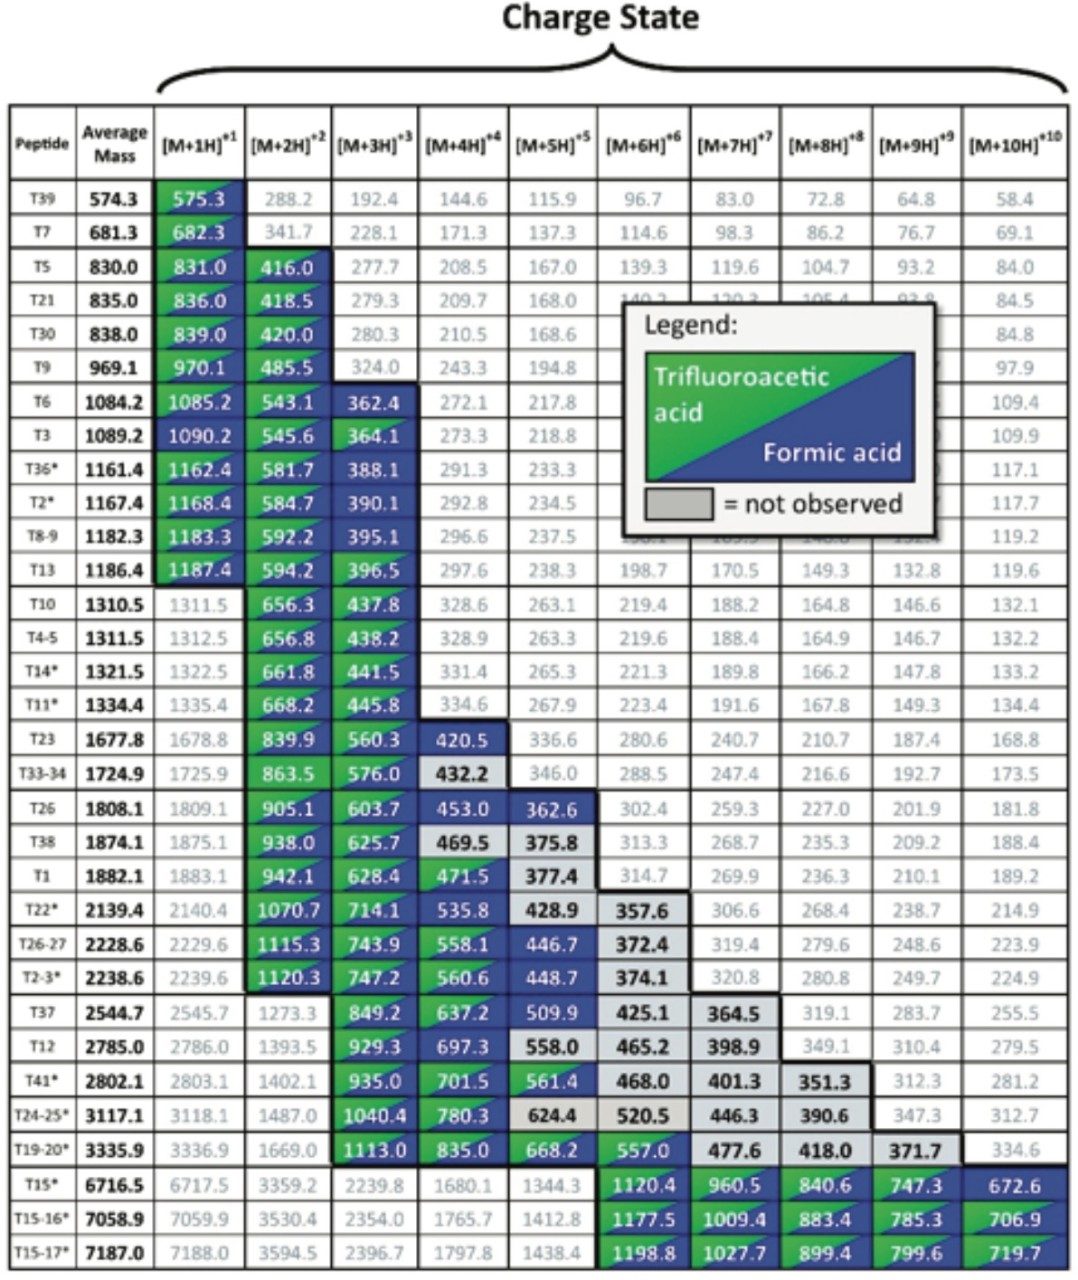
The volatility and acidic nature of the ion-pairing agent used in the mobile phase can impact the ionization and charge state distribution observed in multiply charged species such as peptides.3,4 To investigate the effect of TFA versus FA on the charge state distribution of the peptides resulting from the enzymatically treated trastuzumab sample, a charge state table comprised of the heavy chain peptides was constructed from a simulated tryptic digest of trastuzumab (Table 1).
For both the TFA and FA peptide map experiments, the ACQUITY QDa Detector was set to a scan from 350 m/z to 1250 m/z (maximum) and is highlighted by the thicker line traces inside Table 1. Green and blue highlights were used to indicate if the peptide charge state was observed with TFA or FA, respectively.
Both colors indicate the charge state was observed in both peptide map experiments whereas a grey box represents a charge state within the scan range, but not observed.
From Table 1, it is clear that with only one exception (peptide T12), all peptides were observed to have multiple charge states with either TFA or FA as an ion-pairing agent. In addition, the peptides observed represent 93% of the heavy chain of trastuzumab. Similarly, 92% of the light chain peptide fragments were observed with multiple charge states for the trastuzumab digest when using TFA or FA. Peptides not observed were either not retained or were in a charge state below the 350 m/z experimental setting.
From these data, it can be seen that the ACQUITY QDa Detector is compatible with both TFA and FA based methods, affording significant flexibility in method development of monitoring assays.
A natural question that arises from these results is: What is the accuracy with which we are detecting the charge states of the observed peptides?
An assessment of mass accuracy of the ACQUITY QDa was thus performed using the base peak ion (BPI) for the observed peptides. For this assessment, the difference between the observed and theoretical charge state m/z value was calculated for the BPI using the average molecular weight of each peptide.
A plot of the mass difference versus the theoretical average molecular weight was constructed as shown in Figure 4. It can be seen from Figure 4 that the BPI derived masses for the observed peptides are within the instrument specification of ± 0.2 Dalton (blue highlight), with a large portion of the peptides falling within ± 0.10 Dalton, demonstrating the ACQUITY QDa Detector is capable of providing accurate mass information for peptides over a broad molecular weight range in assays routinely employed during the analysis of biotherapeutics.
From previous work, it was shown that the ACQUITY QDa Detector provides a complementary detection technique to optical detection and can thereby improve the productivity of a single workflow. Cost effective techniques that add value and can be implemented into existing workflows with minimal effort are highly desirable in the pharmaceutical industry.
A natural extension of this work was to evaluate the performance of the ACQUITY QDa Detector using a representative biotherapeutic drug. From this work it has been demonstrated that the ACQUITY QDa Detector is compatible with conventional LC mobile phases and is able to detect and accurately report mass information for peptides over a wide molecular weight range typical of biotherapeutic peptide maps.
Collectively, these results establish the ACQUITY QDa Detector as an ideal addition for the biopharmaceutical analyst’s lab that will afford increases in productivity and the confidence of data analysis for routine peptide analysis assays.
720005266, January 2015