In this application note we describe the ease of use and efficacy of a non-targeted, data independent, analysis type (MSE and HDMSE), coupled with UNIFI, a state-of-the-art scientific information system for multi-analyte screening in food and environmental samples. Here, we focus on introducing the novel way a user in a routine environment can customize data review within the scientific information system to establish a concise, rapid, facile, and consistent approach to reviewing HRMS data. This is demonstrated with a case study involving an authentic sample analyses. The aim of these case studies is to show how a user can get from injection of a sample to submission of an accurate report in a fast, efficient, systematic, and reproducible way using the workflows, views, and filters in UNIFI.
Review complex high resolution, non-targeted MSE or HDMSE datasets using workflows, filters, and views within an integrated scientific information system that allows:
Multi-analyte screening methodologies are essential for monitoring food and environmental samples across the globe. The goal of these methods is to eliminate the compliant samples and identify the non-compliant samples for subsequent confirmation and quantification. Sensitivity must be in line with the relevant regulatory limits for residues in complex matrices. Also, a method must be validated in accordance with legislative requirements. This method would ideally be a rapid, cost effective, and streamlined process, from sample preparation to reporting results.
To date, LC-MS/MS or GC-MS/MS tandem quadrupole technologies meet the requirements above and currently exist as the de-facto technique used to perform these analyses. However, with a constantly increasing number of analytes being added to monitoring and watch lists, the scope of a typical screening method is being extended. In addition, requests to screen for compounds beyond a target list are becoming increasingly common. As a result, many laboratories are progressing towards High Resolution Mass Spectrometry (HRMS) screening techniques that, in theory, can monitor for an unlimited number of targets, and at the same time, provide information to help discover unknown compounds or metabolites of interest.
In this application note we describe the ease of use and efficacy of a non-targeted, data independent, analysis type (MSE and HDMSE),1 coupled with UNIFI, a state-of-the-art scientific information system for multi-analyte screening in food and environmental samples. Here, we focus on introducing the novel way a user in a routine environment can customize data review within the scientific information system to establish a concise, rapid, facile, and consistent approach to reviewing HRMS data. This is demonstrated with a case study involving an authentic sample analyses.
LC system: |
ACQUITY UPLC I-Class |
Column: |
ACQUITY UPLC BEH C18 1.7 μm, 2.1 x 100 mm |
Column temp.: |
45 °C |
Injection volume: |
5 μL |
Flow rate: |
0.45 mL/min |
Mobile phase A: |
10 mM ammonium acetate (pH 5) in water |
Mobile phase B: |
10 mM ammonium acetate (pH 5) in methanol |
Sample manager purge: |
90/10 water/methanol |
Sample manager wash: |
50/50 water/methanol |
Seal wash: |
90/10 water/methanol |
Time (min) |
Flow rate (mL /min) |
%A |
%B |
Curve |
---|---|---|---|---|
Initial |
0.45 |
98 |
2 |
6 |
0.25 |
0.45 |
98 |
2 |
6 |
12.25 |
0.45 |
1 |
99 |
6 |
13.00 |
0.45 |
1 |
99 |
6 |
13.01 |
0.45 |
98 |
2 |
6 |
17.00 |
0.45 |
98 |
2 |
6 |
MS system: |
Xevo G2-XS QTof |
Ionization mode: |
ESI + and - |
Capillary voltage: |
0.9 kV |
Desolvation temp.: |
550 °C |
Desolvation gas flow: |
1000 L/Hr |
Source temp.: |
120 °C |
Reference mass: |
Leucine enkephalin [M+H]+=556.2766 |
Acquisition range: |
50 to 1200 m/z |
Acquisition rate: |
4 spectra/s |
Low CE: |
4 eV |
High CE ramp: |
10 to 45 eV |
The aim of these case studies is to show how a user can get from injection of a sample to submission of an accurate report in a fast, efficient, systematic, and reproducible way using the workflows, views, and filters in UNIFI. This type of data collection, processing, and review is described in a previously published technical note2 by the same authors.
A sample was submitted for analysis using the Waters Pesticide Screening Application Solution (PSAS) with UNIFI to evaluate the performance of the system for qualitative pesticide screening. Criteria used to assess the performance of the system were the false positive and false negative rates, as well as the ease and speed of data review. In addition to providing details of the sample preparation technique used, the collaborators provided a list of the compounds that were previously detected using a tandem quadrupole LC-MS/MS prior to sample submission to Waters. See Table 1 for details of those compounds.
A vial containing 200 µL dried cherry extract at 2.5 g/mL matrix in 100% acetonitrile (ACN) prepared using QuEChERS was supplied by the collaborator. The sample was dried down and reconstituted in 500 µL of water:acetonitrile (75:25), resulting in a concentration of 1 g/mL matrix. A 10 µL injection was performed. A non-targeted, data independent analysis, (MSE)1 was collected and processed in UNIFI.
This analysis focuses on the qualitative accurate mass screening capabilities of the Waters Pesticide Screening Application Solution with UNIFI, attempting to answer the highlighted question in Figure 1.
The workflow used for this qualitative analysis is shown in Figure 2. Figure 3 shows the UNIFI report containing the list of pesticides that were confidently matched in the dried cherry sample using the Qualitative Screening Workflow in Figure 2. In total, 15 pesticides were reported to the collaborator, which was seven more than they had originally supplied with the sample submission. Following submission of the Waters report and demonstrating data review, the collaborator then provided the full list of pesticides present in the characterized sample, as shown in Table 2.
By comparing the results shown in Figure 3 and Table 2, it can be seen that all pesticides detected by tandem quadrupole LC-MS/MS were also detected using the Waters Pesticide Screening Application Solution (PSAS). This demonstrates the efficacy of truly non-targeted data acquisition using MSE in combination with data review via a UNIFI workflow.
With the exception of pyraclostrobin, at least one fragment ion was detected for each pesticide using the Waters PSAS. The detection of accurate mass fragments provides confirmatory evidence for presence of a pesticide residue and greatly reduces the number of false positives reported compared to detection by precursor mass accuracy alone. The specificity afforded by the use of fragment ion presence far exceeds any other identification parameter used during accurate mass screening. The use of UNIFI workflows, like the example shown in Figure 2, allows rapid review of all supporting evidence for compound identification including mass accuracy of precursor and fragment ions, retention time, the presence of multiple adducts and isotope scores.
This section highlights a specific workflow step to discuss in more detail.
The “Confident Matches-Details” workflow step is designed to filter and review confident matches made on any of the 529 compounds in the target list.
Immediately after collection, a data file is processed and componentized.3 An identified status is achieved for targets that satisfy the wide criteria set for retention time (1.5 minute window) and mass accuracy (10 ppm) in the analysis method. Making this identification tolerance wide in the analysis method results in never having to reprocess raw data during a routine screening analysis. Within data review we can narrow the tolerances, and add additional criteria, using filters. An example filter for the third workflow step used in this application note, is shown in Figure 4.
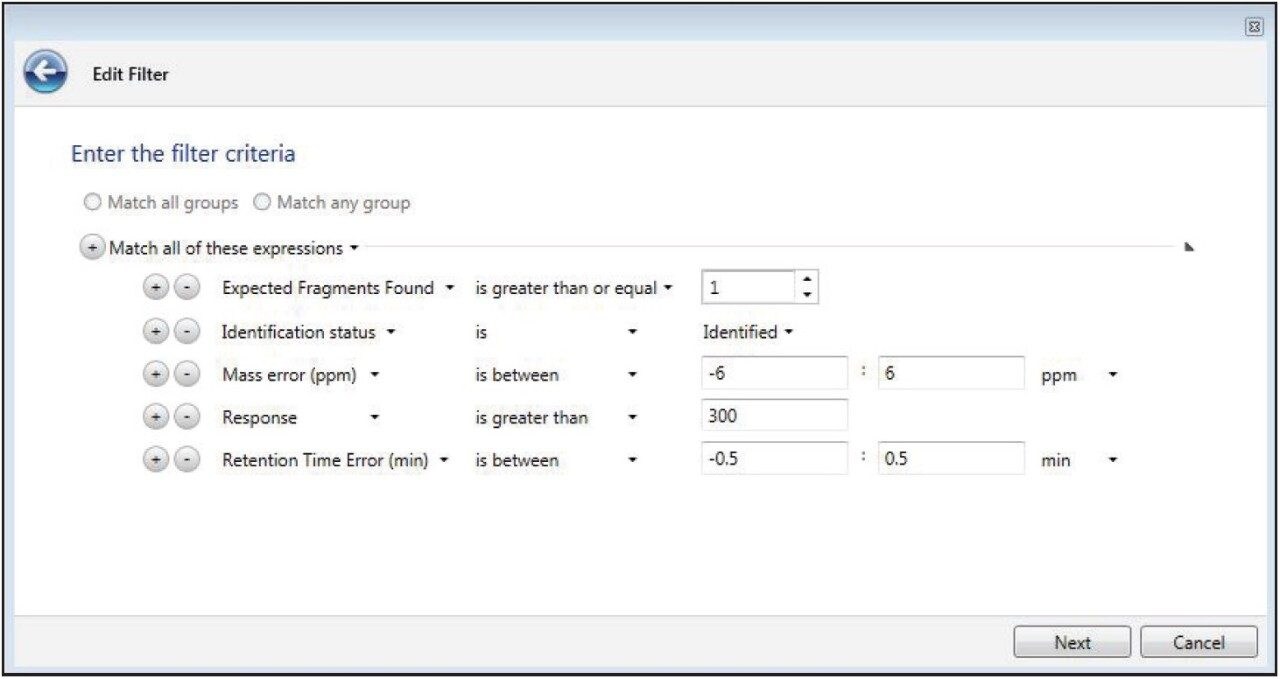
A filter represents a question and the customized view is designed to display information required to make a rapid yes/no answer to violations in the selected sample. The filter in Figure 4 ensures that only confident matches are displayed. This filter restricts the viewed target list matches to those that are within a retention time tolerance of ±0.5 minutes, that have a mass accuracy within ±6ppm, that have a response over 300 and that match at least one target fragment ion. False detections are avoided due to the specificity of requiring an accurate mass fragment ion in addition to matching the tighter criteria set for retention time, mass accuracy and intensity in the filter compared to the analysis method.
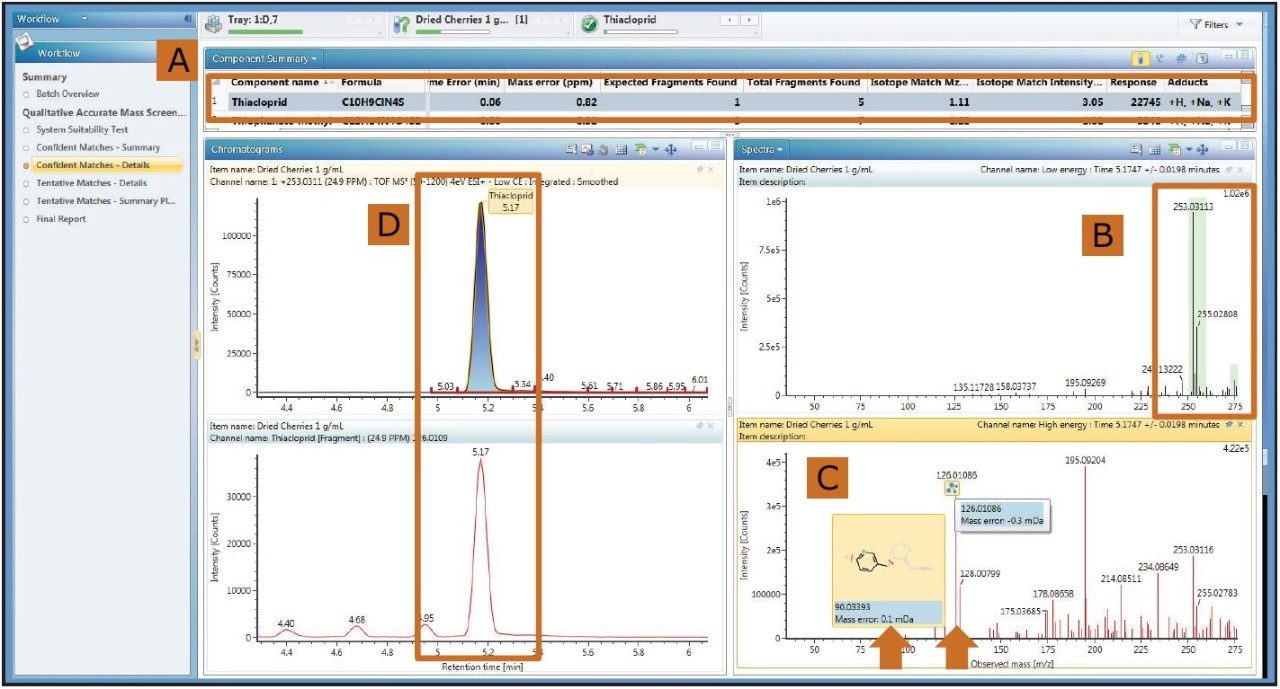
A “view” containing the component summary, mass spectra and extracted ion chromatograms was designed to display all of the information required to rapidly verify the confident matches in this workflow step. From Figure 5 we can see the wealth of information available for the match of thiacloprid in the dried cherry sample. In the component summary (Figure 5A) we see that the compound has been matched within 0.06 minutes of the expected retention time, a mass error of 0.82 ppm and an expected accurate mass fragment was matched from the target list. In addition, four accurate mass fragments have been identified by the Fragment Match tool, which automatically interrogates the high energy data once a target match is made. A low isotope score for m/z and intensity gives confidence that the component isotope pattern closely matches that of the compounds theoretical isotopic pattern.
Data componentization is key to the success of UNIFI data review since all of the mass spectral data displayed for a match are from a tight retention time band at the apex of the chromatographic peak. This also results in cleaner looking spectra compared to a conventional background subtracted spectra from an extracted ion chromatogram, as can be seen in figure 5B. The isotope scores in the component summary are based on the entire cluster in the green shaded area for the most intense adduct (H+ in this case).
The high energy data shows fragment ion information and two example fragment ion identifications are highlighted in figure 5C. The fragment ions matched from those in the Scientific Library are automatically annotated with the mass error. Fragment ions matched by the Fragment Match tool are automatically annotated with the proposed structure and mass error from the theoretically calculated mass. All isotopic information is obtained for fragments in addition to precursors, which is especially useful for atoms with characteristic isotopic patterns, such as the halogens. In the thiacloprid example, the expected fragment formula contains a chlorine atom. The measured isotopic pattern of the high energy fragment agrees with the theoretical distribution for the presence of a single chorine atom. This increases confidence in the compound match.
The final piece of evidence pointing to a confident match lies in the Chromatogram window. Extracted ion chromatograms (Figure 5D) are displayed for precursor ions and matched fragment ions. The peak shape and apex retention time should be identical for a precursor and its fragments, as can be seen for thiacloprid in Figure 5D.
Using the workflow step for confident matches, a user can verify these matches within seconds. Componentization of data makes all of this possible. Any false detects matched using a wide tolerance of retention time and mass error are automatically filtered out from this view, vastly improving efficiency of data interpretation without the risk of introducing false negatives in the data processing step.
720005437, July 2015