Time-of-flight instruments offer a unique approach for the quantitation of compounds, which is complementary to traditional workflows found on tandem quadrupole instruments. With many more modes of selectivity available, analysts can quickly address complex matrix background interference and isolate peaks of interest in complex samples to generate sensitive and accurate analyses.
UNIFI enables fast, rapid, and flexible quantitation of data obtained from a wide variety of HRMS acquisition modes. It supports the construction of quantitative methods for HRMS full scan MS, MS,E MS-MS, or Tof-MRM data sets (and supports additional channels such as PDA, UV, FLR, and eSatin input from third party detectors). Flexible quantitation of single or combined adducts, multiple charge state, isotope, and ion mobility filtered extracted ion chromatograms (XICs) is also possible.
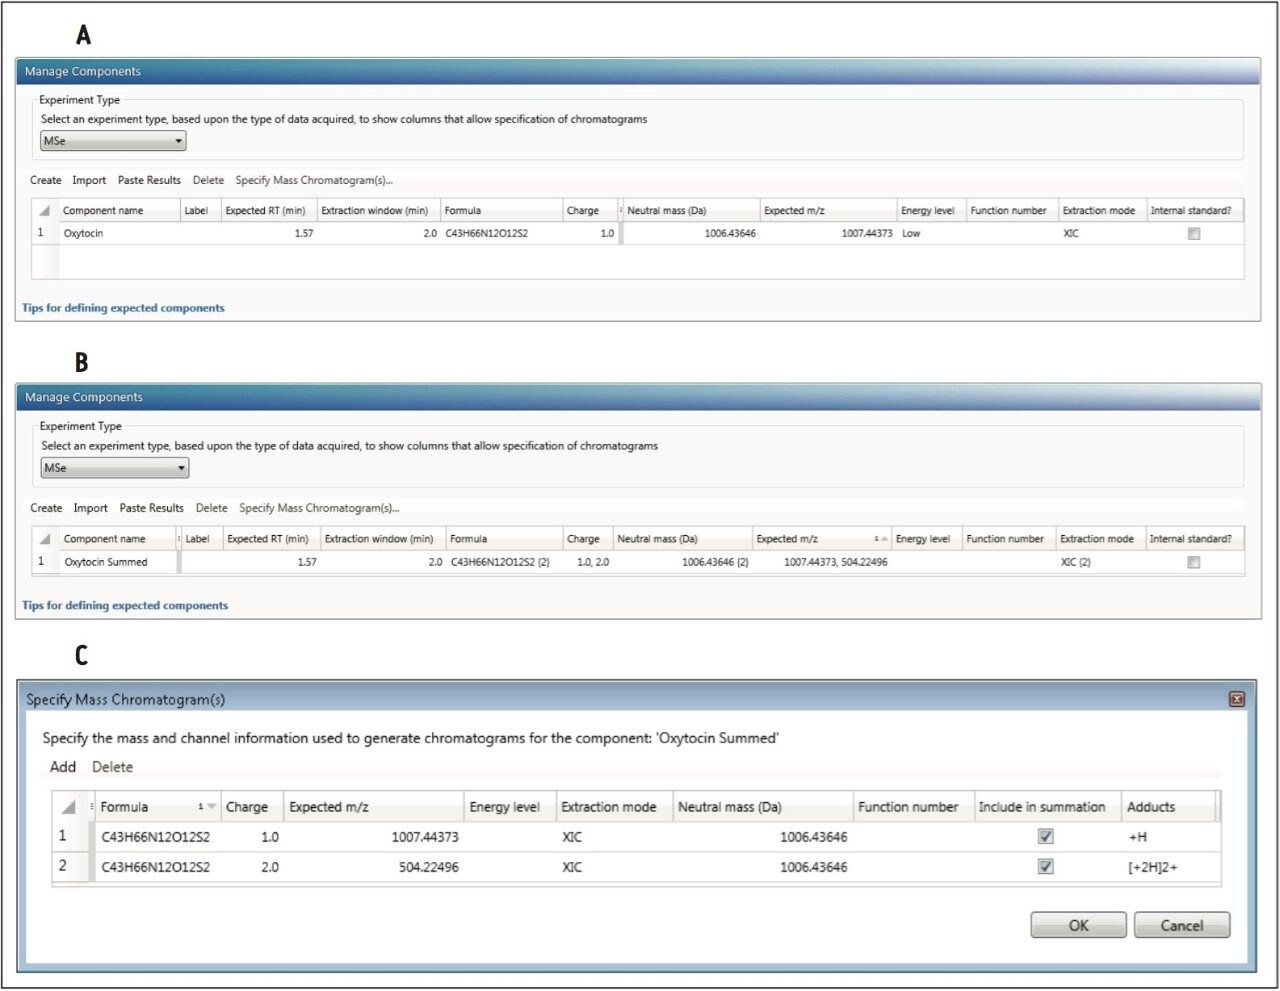
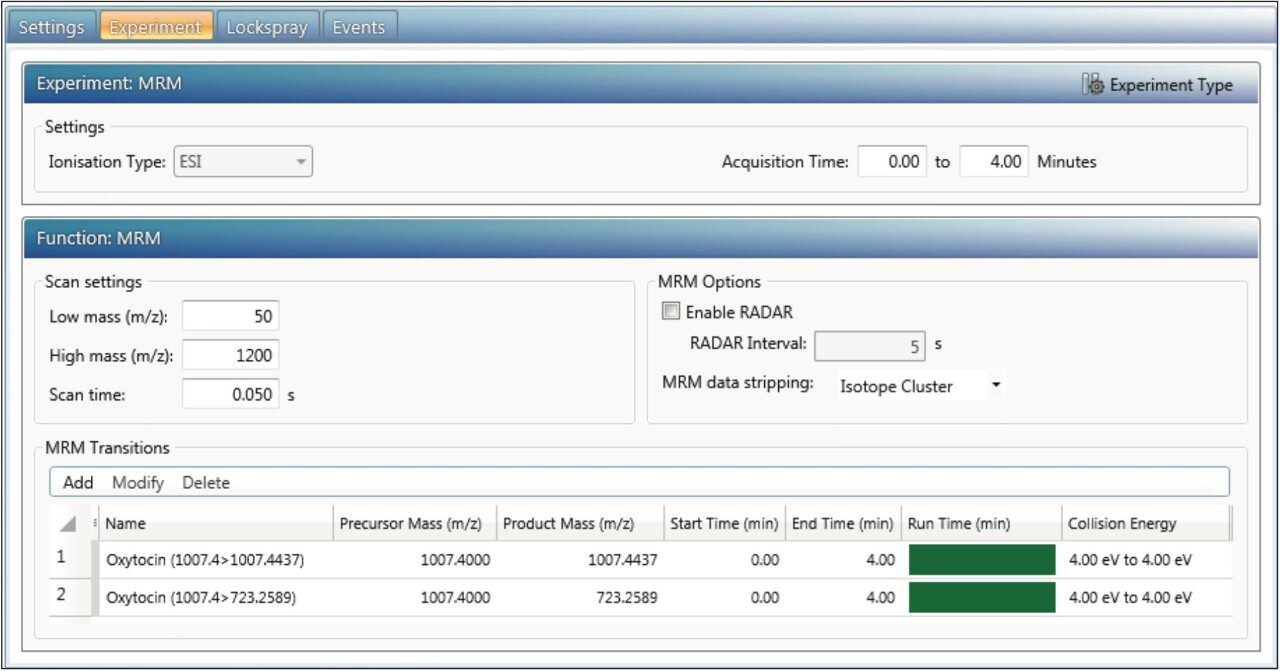
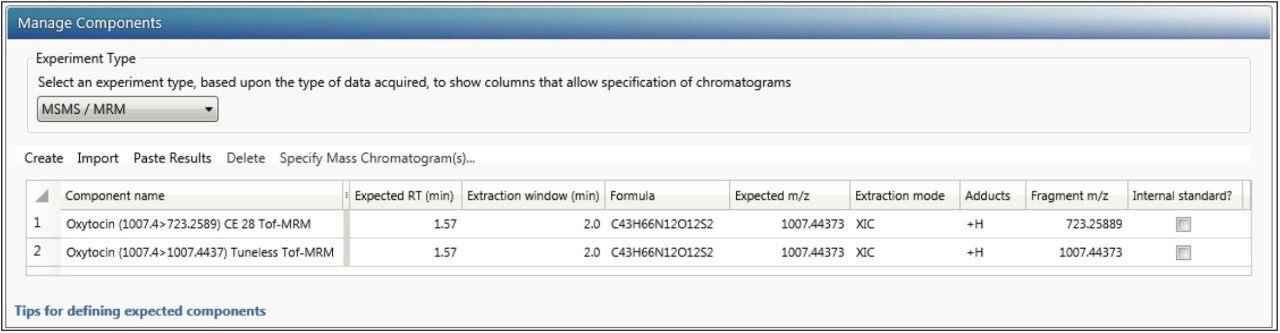
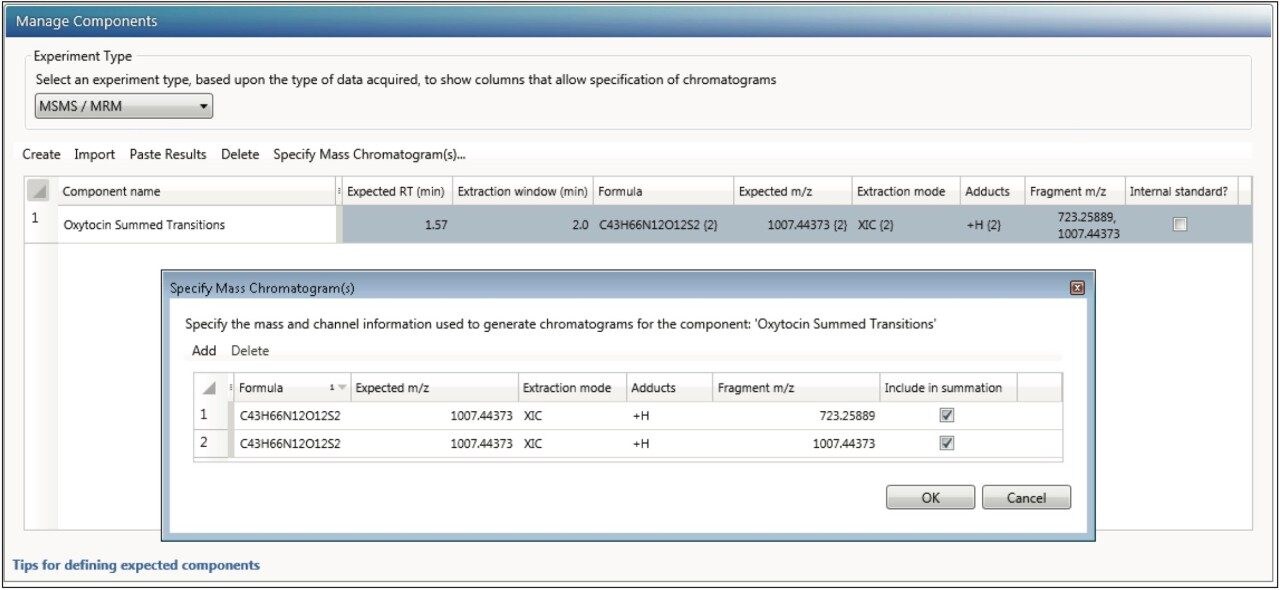
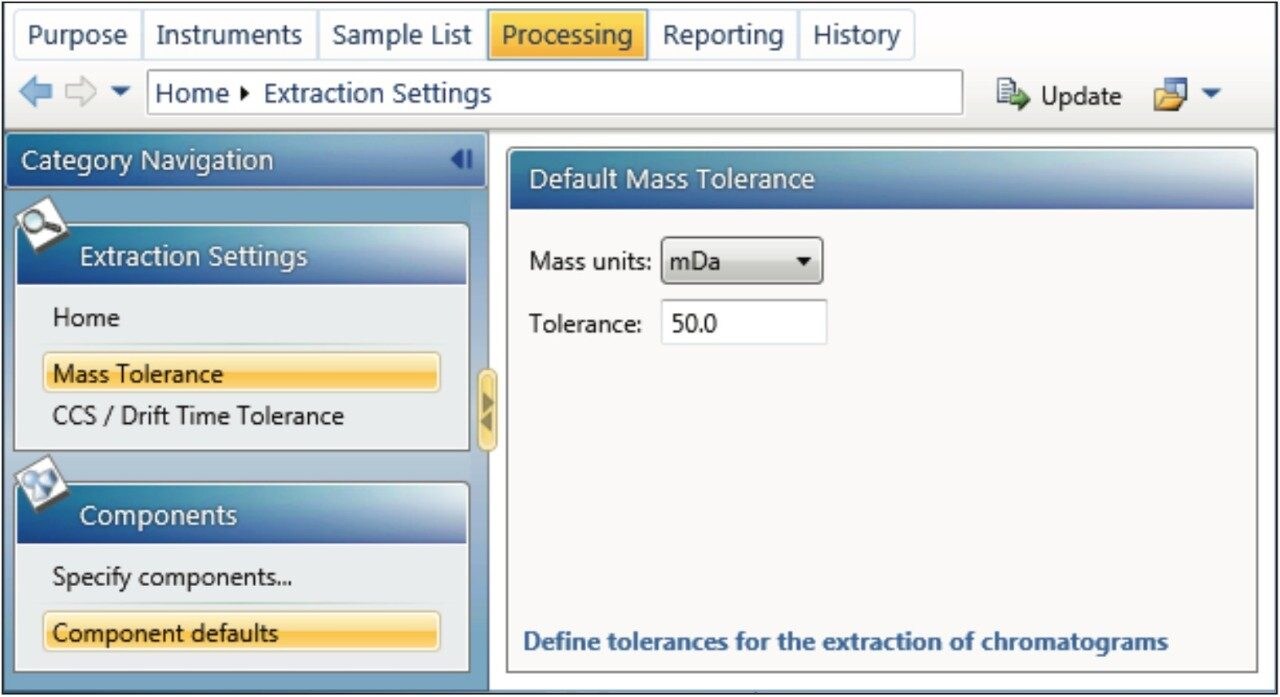
This application note enables the user to collect HRMS data for quantitation, set up a simple quantitative processing method, and review the results within UNIFI. Setup and processing for both full scan and targeted Tof-MRM modes are described. Advanced parameters such as managing multiple charge states, isotopes, fragments, summing transitions, and tools for use with ion mobility modes of acquisition are covered as well.
Many of the quantitative processing capabilities are available within the UNIFI Screening Analysis types, where a significant amount of characterization is desired (quan/qual type data). The solution and workflows described herein are comparable to many of the tools developed in TargetLynx (MassLynx) for high throughput quantitative assays.