Utilize streamlined multivariate analytical tools to determine compositional differences between AFFFs subject to environmental release.
Reviewing complex high resolution, nontargeted MSE datasets using workflows, filters, and views within an integrated scientific information system allows:
Aqueous film-forming foams (AFFFs) have been implemented in military and commercial fire-fighting activities to extinguish flammable liquid fuels. However, the use of these formulations has inadvertently resulted
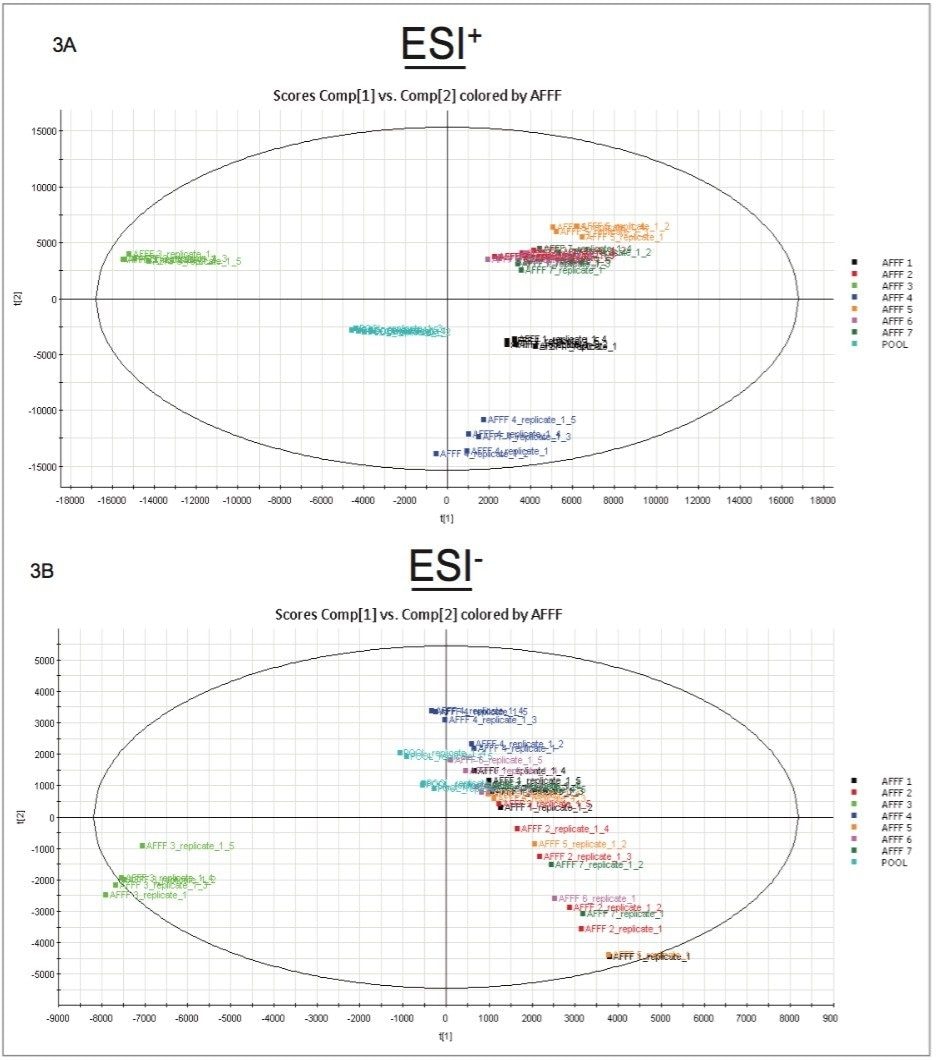
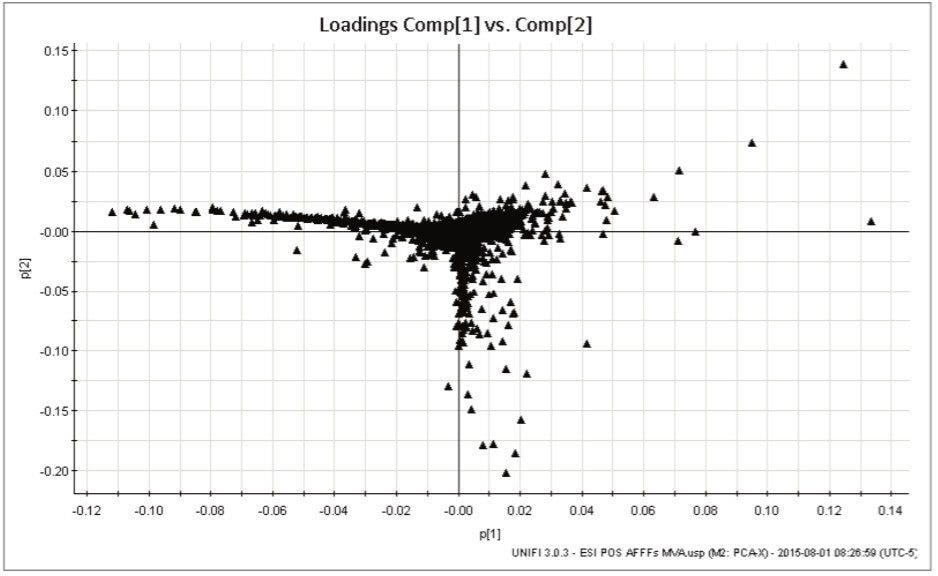
in the release of environmental contaminants due to migration from the site of application. The various formulations of AFFFs consist of numerous fluorocarbon and hydrocarbon compounds.1 Characterizing the common as well as unique components of AFFFs that are used is the starting point to tracking these constituents through various environmental and biological compartments. In this work, seven AFFF mixtures were analyzed with a data independent acquisition approach (MSE), using Waters Xevo G2-XS QTof in order to obtain full spectral accurate mass data from which a multivariate analysis (MVA) approach could be taken to identify unique components within the mixtures.
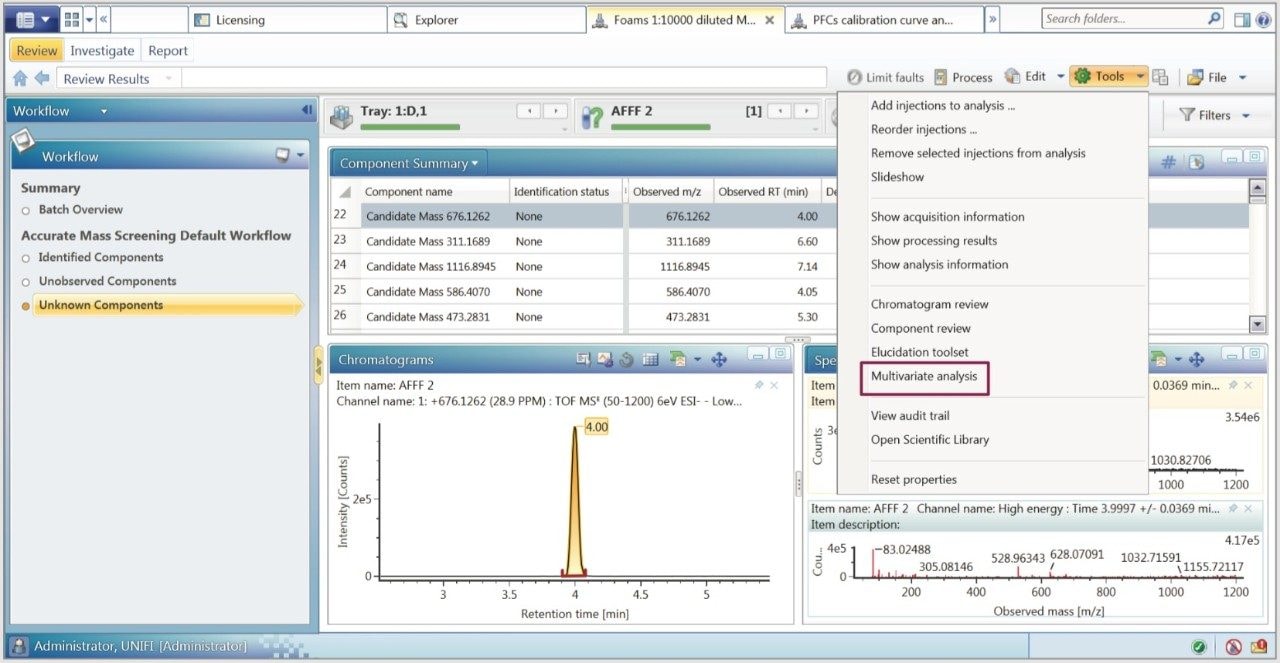
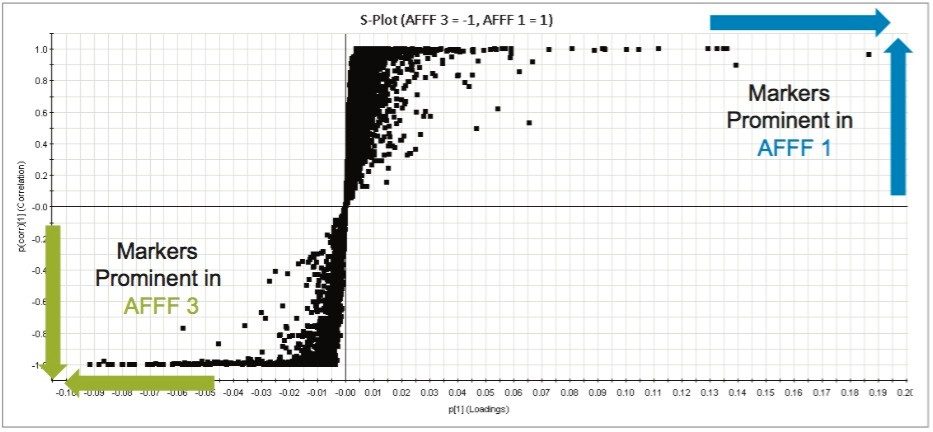
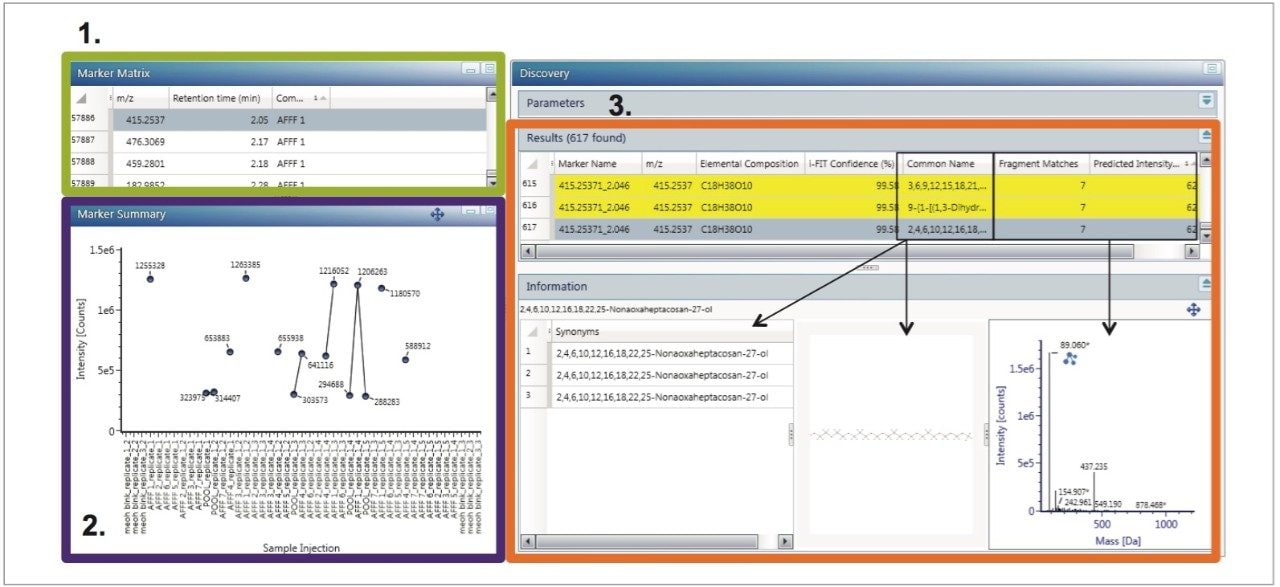
The aim of these case studies is to identify the markers of interest in an easy workflow through the use of UNIFI software tools. Here, the use of built-in MVA functionality with EZ Info 3.0 software takes componentized data and enables rapid identification of markers associated with a particular sample. Markers are then elucidated using the Discovery Toolset and proposed identifications can be made in a streamlined and organized manner, using the approach described here.
Samples of seven industrial grade AFFFs provided were diluted 1:10,000 in methanol and chromatographic separation was performed using the ACQUITY UPLC I-Class System. Data were acquired using alternating high and low collision energy settings (MSE) across the full analytical mass range, such that product ions were also generated on the Xevo G2-XS QTof. Instrumental performance with regards to mass accuracy (<5 ppm mass error), retention time conservation and repeatability of analyte response is particularly important in experiments involving non-targeted analysis, and the system was assessed using a solvent standard mixture of compounds. Electrospray positive (ESI+) and negative (ESI-) modes were acquired separately. Multiple injections of the seven AFFF mixtures were injected on the system, as well as composite sample. Injections were randomized to prevent bias due to carryover. Following analysis, data was subjected to principal component analysis (PCA). All data was acquired and processed using UNIFI Software with EZ Info 3.0.
LC System: |
ACQUITY I-Class |
Column: |
ACQUITY UPLC BEH C18 1.7 μm, 2.1 x 50 mm |
Column temp.: |
55 °C |
Sample temp.: |
4 °C |
Mobile phase A: |
98:2 water:MeOH 2mM ammonium acetate |
Mobile phase B: |
MeOH 2 mM ammonium acetate |
Min |
Flow rate (mL/min) |
%A |
%B |
---|---|---|---|
Initial |
0.65 |
90 |
10 |
0.5 |
0.65 |
90 |
10 |
5.1 |
0.65 |
0 |
100 |
6.6 |
0.65 |
0 |
100 |
6.7 |
0.65 |
90 |
10 |
8.5 |
0.65 |
90 |
10 |
MS system: |
Xevo G2-XS QTof |
Full scan range: |
50 to 1200 m/z |
Source temp.: |
120 °C |
Capillary voltage: |
1.0 μA |
Cone voltage: |
20 kV |
Cone gas flow: |
50 L/hr |
Auxiliary gas flow: |
1000 L/hr |
Scan time: |
0.2 min |
Low energy CE: |
4 eV High energy |
CE ramp: |
40 to 60 eV |
Lock mass: |
Leucine enkephalin 556.2766 (positive ion) 554.2610 (negative ion) |
To ensure method quality control parameters were met, QC injections of previously characterized pesticide and perfluoroalkyl standards were interrogated at the beginning and end of the sample analysis. Pivot tables within UNIFI enabled rapid visualization of the required parameters for quality assessment including mass error, retention time, and response. Figure 2 summarizes the data for ESI+ QC injections of the pesticide standards at 10 ppb.
The UNIFI componentized data was analyzed using principle component analysis (PCA). As can be seen in Figure 3A, a distinctive grouping was observed using positive ion MS for the AFFFs. Of the seven different AFFFs, three clustered very closely together, as seen in the top right quandrant of Figure 3A, AFFF1 and AFFF4 also fell on the right side of the scores plot, whereas AFFF3 was well separated from all other AFFFs. The composite samples were clustered appropriately towards the middle. The negative ion data scores plot is shown in Figure 3B. With the exception of AFFF3, the AFFFs grouped together. Both positive and negative ion datasets indicated that AFFF3 was quite different from the other AFFFs.
Another means of visualizing the differentiation in the samples is the Loadings Plot, which shows the markers (exact mass retention time pairs) placed in the quadrants as they appear in the samples. Figure 4 shows the loadings plot of all markers and their spatial association with specific foams for positive ion data. Markers in the far left of the plot are those which occurred only or most intensely in AFFF3.
In order to identify markers of interest, group to group comparisons were carried out with two foams at a time, resulting in the generation of S-Plots of which an example is shown in Figure 5. Markers strongly correlated with individual AFFF formulations were tagged with a label indicating that they were more highly concentrated in that particular sample. Investigation of the labeled markers strongly associated with specific groupings using structural elucidation tools resulted in the identification of multiple sulfate, hydrocarbon, and fluorinated compounds. Trend plots of these markers were used to assess the presence and abundance of these markers across all the injections of all AFFFs. Markers were either unique to specific formulations, or in some cases, common compounds across multiple AFFFs. For those constituents that had a proposed structure, product ion structures were assigned and used as a means to support identification. The aforementioned interrogation of markers of importance is carried out using the Discovery Toolset (Figure 6). Discovery Toolset, a feature within UNIFI Software, uses a combination of elemental composition proposals, theoretical isotopic distribution comparisons, ChemSpider searching, and fragment matching based on proposed structures. Markers were submitted as a batch and searched using this approach. Yellow highlighted hits (as well as the blue hit selected) have over 50% of their spectra explained by the proposed structure and associated fragments.
720005908, February 2017