Bisphenol A (BPA) is a chemical compound used in the processing of plastics and resins, as well as receipt paper. Recently, the use of BPA has been reduced due to the negative effects it has on both the environment and consumers. BPA is a known endocrine disruptor mimicking estradiol when introduced into a human’s metabolic cycle.1 The disruption of the endocrine system can lead to hormone imbalances, and estrogen disruptors, such as BPA, have been linked to infertility.2 Consumers regularly come into contact with products containing BPA or one of the many other bisphenol compounds.
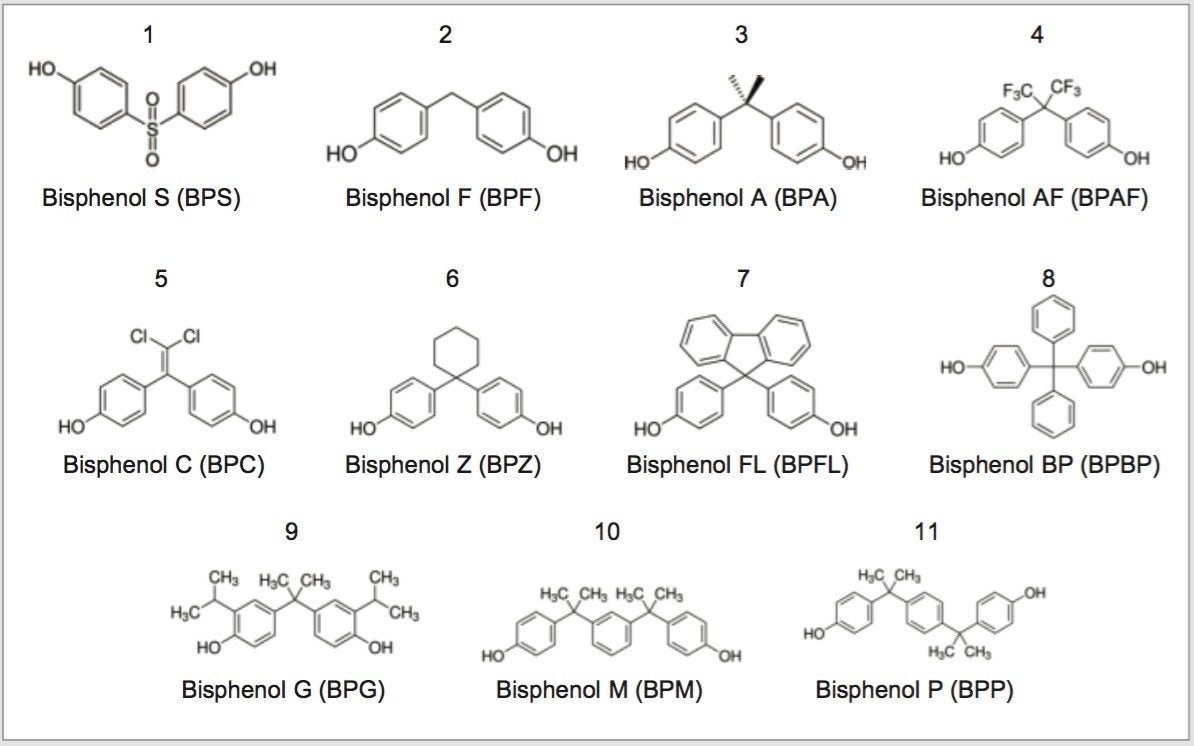
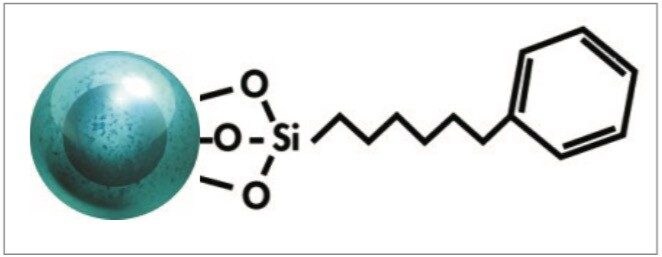
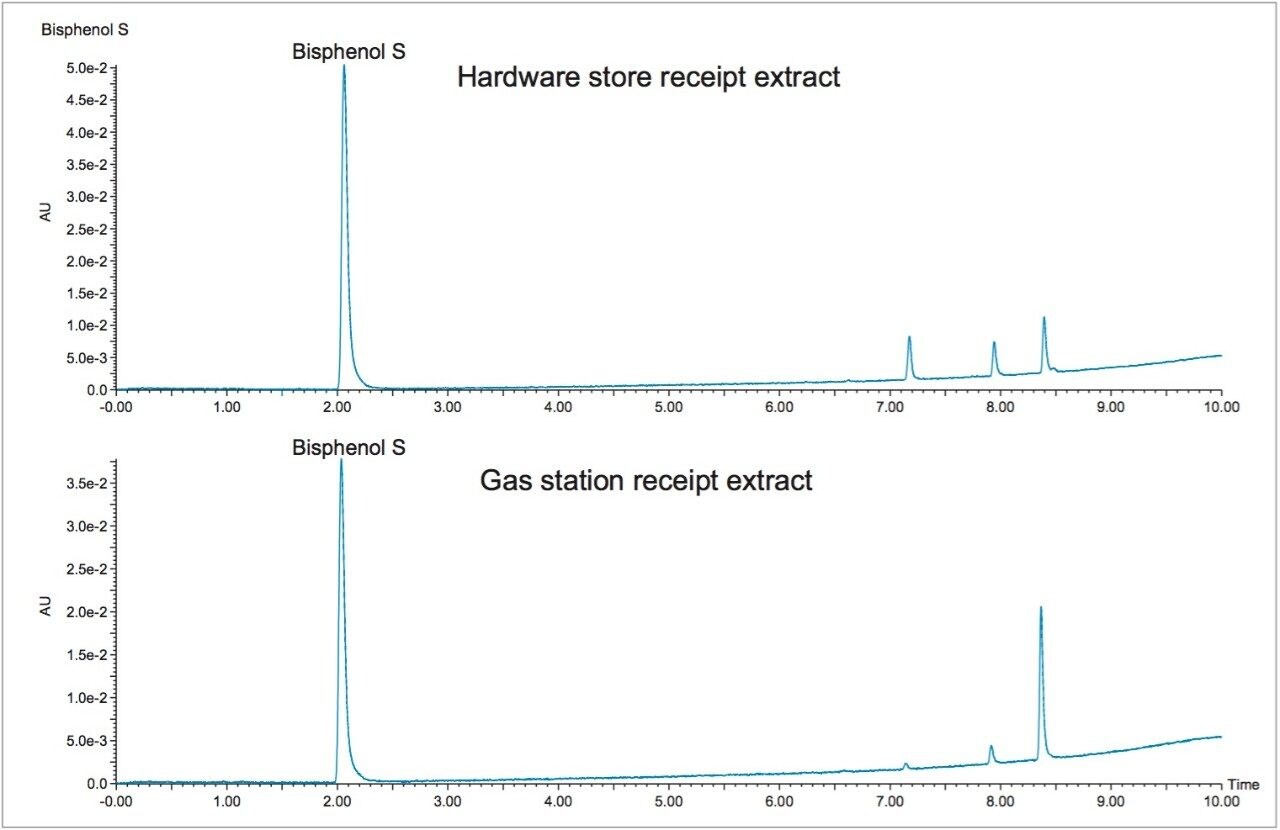
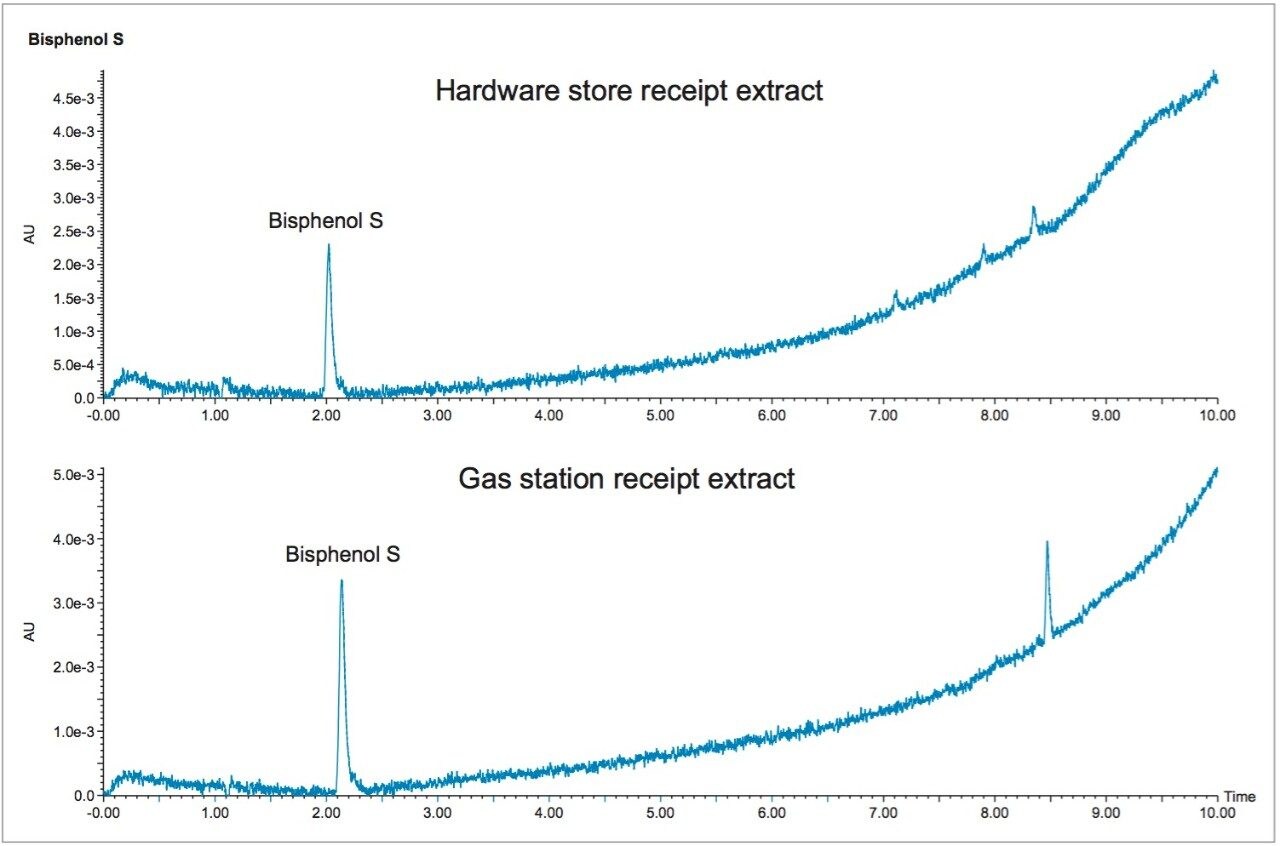
This application note shows the analysis of eleven bisphenol compounds, including BPA, using a CORTECS UPLC Phenyl Column on an ACQUITY UPLC H-Class System. Due to the concern over negative effects of BPA, manufacturers are beginning to replace it with other bisphenol compounds, such as Bisphenol S (BPS). However, recent studies indicate that BPS also displays signs of disrupting cell signaling and may not be a safe alternative.3 By using a simple screening technique, an analyst can determine if any of the bisphenols are present in their sample. After developing a baseline separation for all eleven compounds, readily available receipt papers were analyzed for BPA or any of the other bisphenols.