• Application Note

A Comprehensive Approach for HCP Identification

A Comprehensive Approach for HCP Identification, Quantification, and Monitoring Based on a Single Dimension (1D) LC Separation

  • Catalin E. Doneanu
  • Sarah Lennon
  • Malcolm Anderson
  • Ian Reah
  • Mal Ross
  • Steven Anderson
  • Ian Morns
  • Ying Qing Yu
  • Asish B. Chakraborty
  • Laetitia Denbigh
  • Weibin Chen
  • Waters Corporation

Abstract

This application note highlights the capabilities of a novel data independent acquisition mode recently implemented on a Waters Quadrupole/Time-of-Flight (QTof) Mass Spectrometer, namely SONAR data acquisition.

Benefits

  • SONAR data independent acquisition significantly reduces spectral complexity, enabling identification of low-abundant host cell proteins
  • SONAR MS/MS fragmentation spectra of HCP peptides can be assembled into spectral libraries, containing peptide precursor m/z, charge states, and retention times for improved confidence in the identifications
  • Progenesis QI for Proteomics software performs accurate HCP identification, quantification, and tracking

Introduction

Residual host cell proteins (HCPs) are low-level (1–100 ppm) process-related impurities that might be present in protein biopharmaceuticals even after extensive purification. HCPs could produce unwanted immunogenic responses in patients, they can reduce the efficacy or the stability of the drug, or they can be responsible for drug degradation. For these reasons, the regulatory agencies required that HCPs are identified and quantified prior to drug approval. The biopharmaceutical industry relies on ELISA assays for measuring the total HCP concentration expressed in ppm (or ng HCPs/mg biopharmaceutical). Mass spectrometry based HCP analysis has emerged in recent years as a powerful alternative to ELISA because it provides more extensive (proteome-wide) HCP coverage and is able to measure individual HCP levels.1-3 

HCPs are identified using LC-MS either via data-dependent (DDA) or by data-independent (DIA) acquisition. In comparison with DIA, the DDA acquisition methods are less reproducible and cannot provide adequate HCP quantification because most of the instrument time is spent in MS/MS mode. In this application note, DIA and MSE acronyms are used interchangeably. In MSE acquisition, an equal amount of instrument time is spent in both MS and MS/MS modes using an alternate scanning mode with low and high collision energy switching.

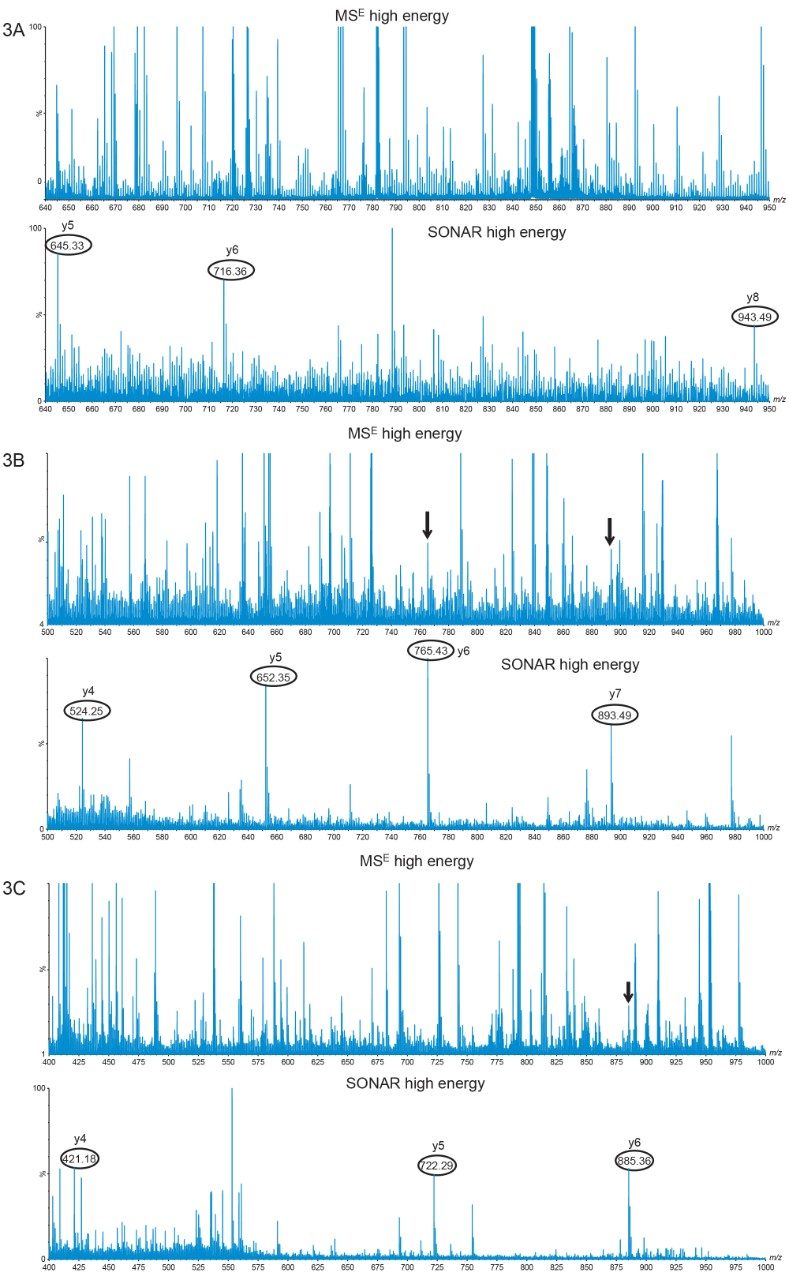
Here we investigated the capabilities of a novel data independent acquisition mode recently implemented on a Waters Quadrupole/Time-of-Flight (QTof) Mass Spectrometer, namely SONAR data acquisition. Instead of transmitting all peptide ions produced by electrospray ionization, in SONAR mode, the quadrupole scans over the mass range of interest during the time required for recording a single mass spectrum by the ToF analyzer. Co-eluting precursor ions with different m/z are separated during the rapid quadrupole scan and their corresponding fragmentation spectra are acquired using an identical quadrupole separation. In this way, SONAR offers additional selectivity, by producing cleaner MS/MS spectra with less interference. Two applications of this novel technology, in the area of lipid profiling,4 and Proteomics,5 have been recently described.

The first step of the HCP identification and quantification workflow described here and presented in Figure 1 is based on the HCP Discovery Assay performed in SONAR mode using extensive (90 min) peptide separations. Following data processing with Progenesis QI for Proteomics 4.0, the HCPs are identified by a proteome-wide database search. In addition, SONAR MS/MS fragmentation spectra can be assembled into spectral libraries, containing peptide precursors, charge states, and retention times. In the second step of the HCP workflow, additional HCP samples resulted from the purification of the same biopharmaceutical, are analyzed by higher–throughput HCP monitoring assays employing MSE data acquisition with 30 min peptide separations. The LC-MSE dataset is then searched against the spectral library for HCP quantification and monitoring at every step during biopharmaceutical purification. The HCP workflow described in Figure 1 was applied for identification and monitoring of HCPs from the NIST monoclonal antibody.

Figure 1. Two-step HCP identification and quantification workflow.

Experimental

Sample preparation

A highly purified mAb (NIST mAb candidate reference LRM 8670) produced in a murine suspension cell culture was acquired from the National Institute of Standards and Technology (NIST) at a concentration of 100 mg/mL. The NIST mAb was denatured with 0.05% RapiGest surfactant (60 °C, 15 min), reduced with 20 mM DTT (60 °C, 60 min), alkylated with 10 mM IAM (RT, 30 min in the dark) and digested with a mixture of Lys-C and porcine trypsin (Promega, Madison, WI, USA) overnight (16 h, 37 °C). After digestion, the RapiGest surfactant was decomposed by adding 5 µL of formic acid (FA, Sigma-Aldrich, St. Louis, MS, USA) and  the digest was incubated for 30 min at 37 °C and centrifugated (15 min, 4,000 rpm) to separate the insoluble component of RapiGest by precipitation. For the HCP Discovery assay, performed in SONAR mode, three protein digest standards (MIX-3:  ADH – yeast alcohol dehydrogenase, PHO – rabbit phosphorylase b, and BSA – bovine serum albumin) were spiked post-digestion in the NIST mAb digest. For the HCP Monitoring assay, performed in MSE mode, four protein digests (MIX-4: ADH, BSA, PHO, and CLP-B – chaperone E.coli) were spiked post digestion in the NIST mAb at various concentration levels as illustrated in the inset tables of Figure 6. LC-MS-grade organic solvents (acetonitrile-ACN and methanol-MeOH) were purchased from Thermo Fisher Scientific (Waltham, MA).

LC conditions

LC system

ACQUITY UPLC I-Class

Column:

2.1 Å~ 150 mm, packed with 1.7 μm CSH C18 particles (P/N 186005298)

Column temp.:

60 °C

Flow rate:

200 μL/min

Mobile phases:

Solvent A: 0.1% FA in DI water

Solvent B:

0.1% FA in acetonitrile

Gradient tables:

MS conditions

MS system:

Xevo G2-XS QTof Mass Spectrometer

Ionization mode:

ESI(+)

Capillary voltage:

2.8 kV

Cone voltage:

25 V

Source offset:

60 V

Source temp.:

150 °C

Desolvation temp.:

450 °C

Cone gas flow:

50 L/h

Desolvation gas flow:

500 L/hr

Data acquisition software:

MassLynx 4.1 SCN 949

Quantification software:

Progenesis QI for Proteomics 4.0

SONAR (HCP discovery)

MSE (HCP monitoring)

TOF mass range:

50–2000

50–2000

Quad mass range:

400–900

Quadrupole mass window:

50 Da

Scan rates:

0.5 sec

0.3 sec

Low energy CE:

6 V

6 V

High energy CE ramp:

15 to 40 V

15 to 40 V

Results and Discussion

The HCP impurities contained in the NIST mAb (100 mg/mL) has been previously characterized.1-3 The most abundant proteins identified were the A and C aldolase isoforms present in the range of 100–200 ppm. In addition to these two abundant HCPs, the one dimensional LC-MS SONAR HCP Discovery Assay described here was able to identify another two murine HCPs, an order of magnitude below the concentration range mentioned above. These HCPs, present at a concentration level of 10–30 ppm are: low affinity immunoglobulin gamma Fc region receptor (Uniprot accession number P08101) and beta-2-microglobulin (Uniprot accession number P01887). The extracted mass chromatograms of three peptide precursors from these two low-abundant HCPs are displayed in Figure 2. These traces resulted from a 90 min gradient separation of the NIST mAb digest spiked with MIX-3 digest standards (ADH, PHO, and BSA). The CSH Column, specifically designed to maintain good chromatographic resolution under column overloading conditions, provides sharp, symmetrical peak shapes (~10 sec peak with at 10% of peak height) for all low-abundance peptides, despite the high amount of sample loaded on-column (500 µg).

Figure 2. Extracted mass chromatograms of three low-abundance HCP peptides identified in the NIST mAb using SONAR acquisition: (A) SQVQASYTFK peptide (precursor 579.79, +2) from low affinity IgG gamma Fc region receptor protein; (B) TPQIQVYSR (546.30, +2) from beta-2-microglobulin; (C) TVYWDRDM (543.24, +2), also from beta-2-microglobulin.

The 90 minute LC separation was repeated with MSE acquisition, with the same amount of sample loaded (500 µg), and the combined MS/MS spectra acquired for the three HCP peptides were compared, as shown in panels A–C of Figure 3. The high energy SONAR fragmentation spectra (shown at the bottom of panels 3A–C) are significantly less complex than the corresponding MSE spectra (shown at the top of each panel). Unlike MSE, in the SONAR acquisition mode, the quadrupole is isolating precursors of HCP peptides (regardless of their m/z or ESI-MS response), a critical step for obtaining high-quality fragmentation spectra, with reduced spectral complexity, less interferences and lower noise levels. The data processing software (Progenesis QI for Proteomics 4.0) takes full advantage of the MS/MS spectra of reduced complexity and is able to identify all three peptides with at least three fragment ions detected above the noise level. The same three HCP peptide identifications were not obtained after processing the MSE data. Also, the three low-abundance HCP peptide precursors were not selected for MS/MS fragmentation in a DDA experiment performed on the same sample. The SONAR dataset (three replicate injections) was searched against the Uniprot database containing 16,644 mouse proteins, and four HCPs were identified. These HCPs were quantified utilizing the “Hi3” approach,6 based on the PHO digest internal standard spiked post-digestion in the NIST mAb digest. The list of HCPs identified in each of the three replicate SONAR acquisitions is displayed in Table 2. The lowest concentration measured for a NIST mAb HCP using the SONAR Discovery Assay was 11 ppm for beta-2-microglobulin. 

Figure 3. Comparison of high energy MSE and SONAR fragmentation spectra recorded for three low-abundance HCP peptides: (A) SQVQASYTFK peptide; (B) TPQIQVYSR peptide; (C) TVYWDRDM peptide. In all three cases, the SONAR fragmentation spectra are significantly less complex than the corresponding MSE spectra, enabling the Progenesis QI for Proteomics Software to confidently identify two low-level (10–20 ppm) HCPs from NIST mAb: low affinity IgG gamma Fc receptor protein and beta-2-microglobulin.
Table 2. Host cell proteins (HCPs) identified and quantified in the NIST mAb using SONAR acquisition. Three spiked proteins (ADH, PHO, and BSA) along with four HCPs (highlighted in red) were identified each time in three replicate LC-MS injections. The data presented in Figures 2 and 3 is centered on the two low-level (10–20 ppm) HCPs: Low affinity IgG gamma Fc region receptor and beta-2-microglobulin.

In addition, Progenesis QI for Proteomics 4.0 enables the user to add the SONAR MS/MS spectra to a spectral library containing peptide retention times, precursor m/z and charge states. A list of 24 HCP peptides identified by SONAR acquisition in the NIST mAb digest is presented in Table 3. 

Table 3. HCP peptides identified in the NIST mAb using SONAR acquisition. The MS/MS fragmentation spectra of these peptides were assembled in a spectral library. Peptides are sorted in the increasing order of their precursors. Two MS/MS spectra were recorded for four highlighted peptides, following fragmentation of their doubly and triply charged precursors.

As illustrated in Figure 4AB, the library stored MS/MS spectra from two HCP peptides are matched very well against newly acquired MS/MS spectra, indicating the clear utility of the spectral library for low-level HCP identifications. The library searching criteria include precursor and fragment mass tolerance, retention time tolerance and number of matched fragment ions. An example of the library search parameters used for matching these two spectra is displayed in Figure 4C.

Figure 4. Comparison of the acquired fragmentation spectra against the SONAR library spectra for two HCP peptides from beta-2-microglobulin: (A) TPQIQVYSR peptide and (B) TVYWDRDM peptide. The library search parameters from Progenesis QI for Proteomics 4.0 are highlighted in panel C.

In another experiment, simulating an HCP monitoring assay, three protein digests (ADH, BSA, and PHO) were spiked at four different concentration levels in four NIST mAb digests, while one protein digest (CLP-B) was spiked at a constant concentration in all four samples. The LC-MS data was acquired in MSE mode using a 30 min gradient and searched in Progenesis QI for Proteomics 4.0 against a spectral library of 113 SONAR fragmentation spectra of MIX-4 peptides (ADH, BSA, CLB-B, and PHO). Each of the four spiked proteins can be easily tracked down to the lowest spiked levels (~20 ppm) across all five samples (20 LC-MSE runs) as exemplified by panels I–IV from Figure 5. Four samples, identified by letters A–D in this figure, contained different levels of MIX-4 proteins spiked in the NIST mAb digest, while the sample labeled “Blk” corresponded to the non-spiked NIST mAb digest. In addition, individual peptides from each protein were tracked, as shown in Figure 6. Protein measurements (displayed in the inset tables of panels I–IV in Figure 6) were obtained from multiple peptides measurements of each spiked protein (11 ADH peptides, 15 BSA peptides, 14 PHO peptides) against the internal standard (CLP-B digest, 5 peptides) spiked at the same concentration level in all A–D samples (93 ppm). The inset tables shown in Figure 6 indicate that very good correlation was achieved when comparing the known MIX-4 protein concentrations against the measured ones. The relative standard deviations (RSDs, n=4) were under  10% for all measured protein ratios. The HCP Monitoring assay is clearly able to find all the spiked proteins in the NIST mAb digest.

Figure 5. Protein level results of the HCP monitoring assay. Three protein standards (ADH, BSA, and PHO) were spiked at four different concentration levels in four NIST mAb digests, while one protein digest (CLP-B) was spiked at the same concentration in all four samples labeled A–D.
Figure 6. Peptide level results of the HCP monitoring assay. Three protein standards (ADH, BSA, and PHO) were spiked at four different concentration levels in four NIST mAb digests, while one protein digest (CLP-B) was spiked at the same concentration in all four samples labeled A–D (see inset tables for the spiked protein concentrations). Panels I–IV display the Progenesis QI for Proteomics plots observed for each spiked protein across four replicate injections of each sample (A–D). The Blk sample is the non-spiked NIST mAb digest. Protein measurements were obtained from multiple peptides (11 ADH peptides, 15 BSA peptides, 14 PHO peptides, and five CLP-B peptides) and excellent correlation was obtained between the spiked and measured fold changes with RSDs under 10% for all measurements.

Conclusion

  • SONAR acquisition significantly reduced spectral complexity, enabling identification of low-abundant host cell proteins
  • Using SONAR acquisition, three spiked reference proteins, as well as four HCPs from NIST mAb were identified and quantified with an LLOQ of the assay of 10 ppm
  • The MSE (DIA) results show that HCPs can be confidently identified, quantified, and monitored in biopharmaceutical samples using the 1D LC-MS HCP workflow with Progenesis QI for Proteomics software

References

  1. Doneanu CE, Anderson M, Williams BJ, Lauber MA, Chakraborty A, Chen W. Enhanced Detection of Low-Abundance Host-Cell Protein Impurities in High-Purity Monoclonal Antibodies Down to 1 ppm Using ion Mobility Mass Spectrometry Coupled with Multidimensional Liquid Chromatography, Anal Chem, 2015, 87, 10283–10291.
  2. Huang L, Wang N, Mitchell CE, Brownlee T, Maple SR, De Felippis MR. A Novel Sample Preparation for Shotgun Proteomics Characterization of HCPs in Antibodies, Anal Chem, 2017, 89, 5436–5444.
  3. Weibin C, Doneanu CE, Lauber MA, Koza S, Prakash K, Stapels M, Fountain KJ. Improved Identification and Quantification of Host Cell Proteins (HCPs) in Biotherapeutics Using Liquid Chromatography/Mass Spectrometry, book chapter in Technologies for Therapeutic Monoclonal antibody characterization, Vol 3, ACS Symposium Series, 2015, 357–393.
  4. Gethings LA, Richardson K, Wildgoose J, Lennon S, Jarvis S, Bevan CL, Vissers JPC, Langridge JI. Lipid Profiling of Complex Biological Mixtures by Liquid Chromatography/Mass Spectrometry Using a Novel Scanning Quadrupole Data-Independent Acquisition Strategy, Rapid Comm. Mass Spec, 2017, 31, 1599–1606.
  5. Moseley MA, Hughes CJ, Juvvadi PR, Soderblom EJ, Lennon S, Perkins SR, Thompson JW, Steinbach WJ, Geromanos SJ, Wildgoose J, Langridge JI, Richardson K, Vissers JPC. Scanning Quadrupole Data Independent Acquisition – Part A. Qualitative and Quantitative Characterization, J Proteome Res, 2018, 17, 770–779.
  6. Silva JC, Gorenstein MV, Li GZ, Vissers JP, Geromanos SJ. Absolute quantification of proteins by LC-MSE: a virtue of parallel MS acquisition, Mol Cell Proteomics, 2006, 5, 144–156.

720006262, April 2018

Back To Top Back To Top