• Application Note

LC-MS Characterization of mAb Subunits Using a BioResolve RP mAb Columns

LC-MS Characterization of mAb Subunits Using a BioResolve RP mAb Column

  • Nilini Ranbaduge
  • Henry Shion
  • Matthew A. Lauber
  • Ying Qing Yu
  • Waters Corporation

This is an Application Brief and does not contain a detailed Experimental section.

Abstract

In this technical brief, the BioResolve RP mAb Polyphenyl Column is shown to be able to facilitate improved mAb subunit separations. The column is shown to be used with conventional RPLC-MS methodologies to improve the capabilities of subunit-level analysis. With enhanced chromatographic resolution and through careful optimization of mass loads, it has been possible to better clarify sample heterogeneity providing more insight into mAb structure and function.

Benefits

Improved LC-MS analysis of mAb subunits through the use of Waters BioResolve RP mAb Polyphenyl Column.

Introduction

Reversed-phase liquid chromatography (RPLC) coupled to high-resolution mass spectrometry (RPLC-HRMS) is routinely used as a tool to determine the molecular weights of therapeutic monoclonal antibodies (mAbs). In addition to providing accurate mass information, HRMS measurements are appealing because they can reveal information about product impurities and protein modifications. Many of these modifications are considered to be critical quality attributes (CQAs) that can have a significant impact on the safety and efficacy of a mAb. Interestingly, LC-HRMS can also be effectively applied to characterize mAbs in the form of their subunits, which provides a fast and simple analytical method for confirming identity and providing relative abundance information of these domain-specific CQAs that might be required to ensure product quality.1–2

Figure 1. Total ion chromatograms (TICs) obtained with BioResolve RP mAb Polyphenyl  Column and a leading C4 column for the Waters mAb Subunit Standard (P/N: 186008927), which is derived from a reduced, IdeS digested sample of NIST mAb Reference Material 8671. Peaks corresponding to the Fc/2, LC, and Fd’ subunits are labeled along with several minor peaks (1–6). Analyses were performed with an ACQUITY UPLC H-Class Bio System coupled to a SYNAPT G2-Si HDMS, a 2.1 x 50 mm column, 10 min gradients ranging from 15 to 55% acetonitrile, a flow rate of 0.4 mL/min, column temperature of 80 ˚C, and mobile phases modified with (A) 0.1% formic acid or (B) 0.02% trifluoroacetic acid (TFA). 

The above-mentioned identity determination relies on the extraction of deconvoluted masses from LC-MS data in which MS signal from low-level CQA species can often be suppressed by more dominant ions. Reliable detection of lower abundance species can therefore be a challenge. For that reason, an RPLC column that enhances chromatographic resolution can make a positive impact on the overall capability of a subunit based LC-MS analysis. Furthermore, improvements in chromatography make it possible to reduce run times and help to simplify data analysis.

Results and Discussion

In this study, we used an ACQUITY UPLC H-Class Bio System coupled to a SYNAPT G2-Si for mAb subunit characterization. This application demonstrates the benefit of using the BioResolve RP mAb Polyphenyl Column which was purposefully designed and contains solid core, silica-based particles surrounded by a porous layer (i.e., SCP) that reduces intra particle diffusion distances of the chromatographed proteins to decrease peak band broadening compared to what is frequently seen using fully-porous particles. 450Å pores are contained within the coated particle and the total particle size is 2.7 µm. These attributes contribute to the packed column’s ability to deliver outstanding intact mAb and mAb subunit component resolution, recovery, and low injection-to-injection carryover.3-4

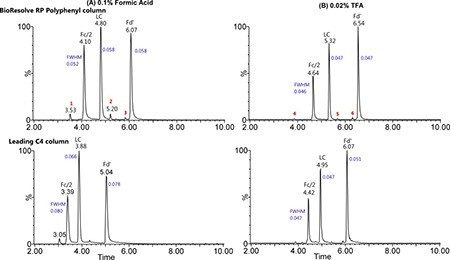
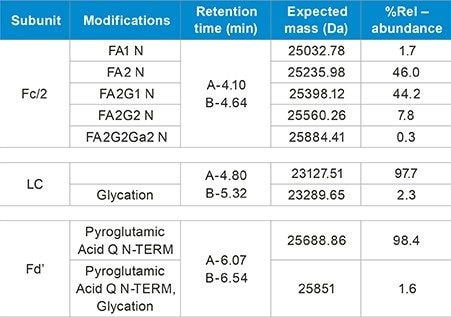
Chromatographic examples are shown for the Waters® mAb Subunit Standard (P/N: 186008927), a new material that is manufactured from reduced, IdeS-digested NIST mAb and available for use as a benchmarking, proficiency testing, or system suitability tool.  The respective theoretical masses for the Fc/2, LC, and Fd’ fragments in this standard are 23790.81 Da, 23127.51 Da, and 25705.89 Da. It was found that each of these three subunits could be baseline resolved using a 10 minute gradient (Figure 1), and a 2.1 x 50 mm column (BioResolve RP) or 1.7 x 50 mm column (leading C4). As shown in Figure 1, the BioResolve RP mAb Polyphenyl Column was capable of yielding favorable chromatographic separations using two different MS-friendly mobile phases: one based on 0.1% formic acid and another on 0.02% TFA. The enhanced resolution provided by the BioResolve RP mAb Polyphenyl Column, resulted in improved peak widths and baseline resolved impurity-peaks compared to the leading C4 column used in the analysis.

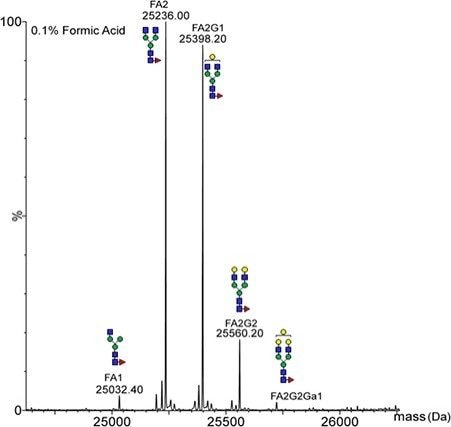
To achieve these exemplary results, care was given to optimize the mass load of the analysis at a level of 0.5 µg. Separate experimentation has shown that the recommended on-column loading for the employed 2.1 mm I.D. column is between 0.05 and 2.50 µg and that it is important to consider this variable to reach optimal performance for detecting low-level species without saturating the MS detector. With these conditions, extracted ion chromatograms for each subunit yielded narrow, baseline-resolved peaks; the peak widths at half height reported in Figure 1 corroborate this observation. These sharp chromatographic peaks yielded high quality deconvoluted mass spectra, such as the one corresponding to the Fc/2 peak (Figure 2). Applying this analysis to the entire chromatographic profile led to the generation of a detailed view of the sample along with a list of masses and relative abundance information for the most abundant protein modifications of the Waters mAb Subunit Standard (Table 1).

The chromatographic resolution of these example assays also revealed several additional, low abundance peaks, which have been labeled as 1 through 6 in Figure 1 for the BioResolve RP mAb Polyphenyl Column. It is from the resolution afforded by the BioResolve RP mAb Polyphenyl Column that a baseline separation could be achieved to support the identification of MS-based ‘product-related’ impurities. For instance, peaks 2 and 5 can be attributed to a fragment of the Fd’ subunit (PQ[1-88]D)  that is present in the standard and represented by an average mass of 9832.2 Da.5

Figure 2. An example spectrum shows the MaxEnt 1 charge deconvoluted scFc fragment.  Major glycoforms with their MW are labeled.  
Table 1. The neutral mass of each subunit and its respective protein modifications are provided. The %relative abundance of each modification is calculated with respect to the total MS response of all modifications per subunit as given in the table.

Conclusion

Through its purposefully-designed attributes, the BioResolve RP mAb Polyphenyl Column is able to facilitate improved mAb subunit separations. Here, it has been shown that this column can indeed be used with conventional RPLC-MS methodologies to improve the capabilities of subunit-level analysis. With enhanced chromatographic resolution and through careful optimization of mass loads, it has been possible to better clarify sample heterogeneity providing more INSIGHT into mAb structure and function. 

References

  1.  Sokolowska, I.; Mo, J.; Dong, J.; Lewis, M. J.; Hu, P. Subunit mass analysis for monitoring antibody oxidation. mAbs 2017, 9 (3), 498–505.
  2. Ranbaduge, N.; Shion, H.; Yu, Y. Q. Automated Protein Modification Characterization of the Intact and Subunit NIST Monoclonal Antibody Reference Standard with Waters UNIFI Scientific Information System 2017. 720006085EN.
  3. Nguyen, J., et al. Designing a New Particle Technology for Reversed Phase Protein Separations Through the Optimization of Diffusion Properties, Waters Application Note, 720006168EN, Jan 2018.
  4. Nguyen, J., et al. A Novel Phenyl Bonded Phase for Improved Protein Reversed Phase Separation, Waters Application Note, 720006169EN, Jan 2018.
  5. Formolo, T.; Ly, M.; Levy, M.; Kilpatrick, L.; Lute, S.; Phinney, K.; Marzilli, L.; Brorson, K.; Boyne, M.; Davis, D.; Schiel, J. Determination of the NISTmAb Primary Structure. In State-of-the-Art and Emerging Technologies for Therapeutic Monoclonal Antibody Characterization Volume 2. Biopharmaceutical Characterization: The NISTmAb Case Study, American Chemical Society: 2015; Vol. 1201, pp 1–62.

720006199, April 2018

Back To Top Back To Top