• Application Note

Bioanalytical LC-MS Quantification of Itaconic Acid: A Potential Metabolic Biomarker of Inflammation

Bioanalytical LC-MS Quantification of Itaconic Acid: A Potential Metabolic Biomarker of Inflammation

  • Kathryn Brennan
  • Mary E. Lame
  • Jonathan P. Danaceau
  • Chris Henry
  • Paul D. Rainville
  • Waters Corporation

For research use only. Not for use in diagnostic procedures.

Abstract

The work described herein incorporates a fast and simple pass-through sample preparation, robust and reliable UPLC-RP separation with a sub-2-μm C18 column designed specifically for retention and separation of polar compounds coupled to a high sensitivity tandem quadrupole MS. This method achieves high sensitivity and accuracy, with a lower limit of quantification (LLOQ) of 0.5 ng/mL from extracted human plasma.

Benefits

  • Generic, fast, and simple sample cleanup using Ostro Pass-through Sample Preparation Products for protein and phospholipid removal.
  • Use of ACQUITY UPLC HSS T3 Column for robust and reliable reversed-phase retention and separation of polar compounds.
  • Retention and chromatographic resolution of the isobaric structural isomer, aconitic acid.
  • High sensitivity and accuracy using UPLC separation and the Xevo TQ-XS Mass Spectrometer.
  • Robust and reliable quantification of endogenous levels of itaconic acid in plasma.

Introduction

Itaconic acid (MW 130.099 g/mol) is a dicarboxylic acid derived from succinic acid.1 Its structure is highlighted in Figure 1. While itaconic acid is more commonly known as a precursor for polymer synthesis in industrial processes, recent research has discussed its biological relevance as part of the mammalian metabolic tricarboxylic acid (TCA) cycle pathway.2-4 In support of drug development and clinical research, there is great interest in assessing its utility as a potential metabolic biomarker for various medical conditions associated with inflammation and/or infection, such as sepsis, rheumatoid arthritis, and gestational diabetes mellitus (GDM).5 While endogenous serum levels in healthy individuals are relatively low, generally between 1.25–12.5 ng/mL (0.1–1 μM), levels present in diseased patients can be 10× elevated.

Figure 1. Itaconic acid structure.

Development of targeted assays of small polar ionic acids, such as itaconic acid, from biomatrices is a persistent challenge due to the need for high sensitivity, selectivity, and accurate quantification across a diverse dynamic range, whilst still maintaining fast sample analysis times. There are numerous methods reported for the analysis of ionic acids using various chromatographic techniques: gas chromatography (GC), ion-exchange (IE), reversed-phase (RP), and hydrophilic interaction (HILIC) liquid chromatography (LC) often coupled to a mass spectrometer (MS) detector to achieve the required sensitivity. While HILIC-LC/MS is increasingly becoming the technique of choice for challenging polar analyte separation, RP-LC is still the preferred approach due to its robustness and overall utility.

The work described herein incorporates a fast and simple pass-through sample preparation, robust and reliable UPLC-RP separation with a sub-2-μm C18 column designed specifically for retention and separation of polar compounds coupled to a high sensitivity tandem quadrupole MS. This method achieves high sensitivity and accuracy, with a lower limit of quantification (LLOQ) of 0.5 ng/mL from extracted human plasma.

Experimental

Preparation of samples, calibration standards, and QC samples

Itaconic acid was obtained from Sigma-Aldrich (St. Louis, MO) and isotopically labeled itaconic acid (13C5,d4), used as an internal standard (ISTD), was purchased from Toronto Research Chemicals (Ontario, Canada). Human plasma (K2EDTA treated, non-stripped) was purchased from BIOIVT (New York, NY). Concentrated stock solutions of itaconic acid (10 μg/mL) and the ISTD (250 μg/mL) were prepared in a 1:1 solution of MilliQ water (18 Ω):acetonitrile. Two working stock solutions, 0.25 and 5.0 μg/mL, were used to prepare the calibration curve and quality control (QC) plasma samples. Concentrations prepared in plasma ranged from 0.5–100 ng/mL. An ISTD working solution (0.625 ng/mL) was prepared in the extraction solvent acetonitrile containing 1% formic acid. Plasma calibration curve standards were prepared in duplicate, while QC and blank (non-spiked) plasma samples were prepared in quadruplicate. To assess inter-day precision and accuracy, samples were prepared on five different days, using five individual lots of plasma.

Ostro pass-through 96-well sample preparation

Sample preparation was performed using the standard protocol included with the Ostro 96-well Sample Preparation Plate. A 200 μL aliquot of prepared plasma was added to the Ostro plate, followed by the addition of 800 μL of acetonitrile containing 1% formic acid and ISTD. Samples were mixed by pipet aspiration. Vacuum was then applied to collect the sample eluate into a 2 mL, 96-well collection plate. Samples were evaporated to dryness using a warm nitrogen stream (35 °C) and reconstituted with 50 μL of a 10:90 methanol:water solution containing 2% formic acid. The reconstituted sample was then injected for LC-MS analysis using the LC-MS conditions described in the experimental section. During method development, Ostro sample extraction effectiveness was compared to traditional protein precipitation (PPT) extraction by assessing differences in analyte recovery, matrix effects, and phospholipid removal between the two techniques.

LC-MS analysis and quantification

LC-MS quantification of itaconic acid in the extracted plasma was performed using an ACQUITY UPLC I-Class System coupled to the Xevo TQ-XS Tandem Quadrupole Mass Spectrometer. Reversed-phase chromatographic separation of itaconic acid was performed with an ACQUITY UPLC HSS T3 Column (1.8 μm, 2.1 × 100 mm) maintained at 50 °C, at a flow rate of 0.6 mL/min using a linear gradient (Table 1). The column effluent was monitored by negative ion electrospray (ESI-) using multiple reaction monitoring (MRM). The primary and confirmatory MRM transitions used for itaconic acid and its ISTD, with their respective optimized settings, are listed in Table 2. Phospholipids were monitored by incorporating a parent ion scan (PIC) of 184, corresponding to the universal polar head group common to phospholipids, within the MS method.

For itaconic acid quantification, peak area ratios (PARs) of the analyte peak area to the ISTD peak were calculated. The calibration curve, prepared in human plasma, was constructed using PARs of the calibration samples by applying a one/concentration weighting (1/x) linear regression model. All QC sample concentrations were then calculated from their PARs against the calibration curve. Due to the presence of endogenous itaconic acid, the method of standard addition was used.

LC-MS conditions

System:

ACQUITY UPLC I-Class (FTN)

Detection:

Xevo TQ-XS Tandem Quadrupole Mass Spectrometer, ESI-

Column:

ACQUITY UPLC HSS T3, 100 Å, 1.8 μm, 2.1 × 100 mm (p/n: 186003539)

Temp.:

50 °C

Sample temp.:

10 °C

Injection volume:

2 μL

Mobile phase A:

0.1% formic acid in water

Mobile phase B:

0.1% formic acid in acetonitrile

Purge solvent:

10% methanol in water

Wash solvent:

0.1% formic acid in 95:5 water:acetonitrile

Gradient

Table 1. UPLC gradient conditions for itaconic acid analysis.

MS conditions

Capillary:

2.0 kV

Source offset:

30 V

Source temp.:

150 °C

Desolvation temp:

500 °C

Cone gas flow:

150 L/Hr

Desolvation gas flow:

1000 L/Hr

Collision gas flow:

0.15 mL/min

Nebulizer gas flow:

7 Bar

Table 2. MS conditions for itaconic acid and its isotopically labeled ISTD, including precursor and fragment ions.

Data management

Instrument control software:

MassLynx v4.2

Quantification software:

TargetLynx

Results and Discussion

Chromatography

Representative chromatograms of itaconic acid and its ISTD using an ACQUITY UPLC HSS T3 Column are shown in Figure 2. During method development, both reversed-phase and HILIC LC columns were evaluated for overall chromatographic performance (e.g., assessment of retention, peak shape, influence of diluent composition, area counts, and signal-to-noise). While the ACQUITY UPLC BEH Amide HILIC Column provided adequate retention and best overall MS signal (data not shown), it was the least robust; shape and retention time drift were greatly influenced by sample diluent composition, injection volume, and mobile phase buffer concentration. Focusing on RP-LC column evaluation, the best overall chromatographic performance was achieved using the ACQUITY UPLC HSS T3 Column, which provided significantly better retention and toleration of the various diluent compositions compared to the ACQUITY UPLC BEH C18 Column (data not shown). Additionally, the ACQUITY UPLC HSS T3 Column resolved the isobaric compound aconitic acid, an intermediate in the TCA cycle, and itaconic acid. This is highlighted in Figure 3.

Figure 2. UPLC separation of itaconic acid and its isotopically labeled internal standard (ISTD), using a 2.1 × 100 mm ACQUITY UPLC HSS T3 Column.
Figure 3. Representative chromatogram highlighting chromatographic resolution of itaconic acid from the isobar, aconitic acid using a 2.1 mm × 100 mm ACQUITY HSS T3 Column.

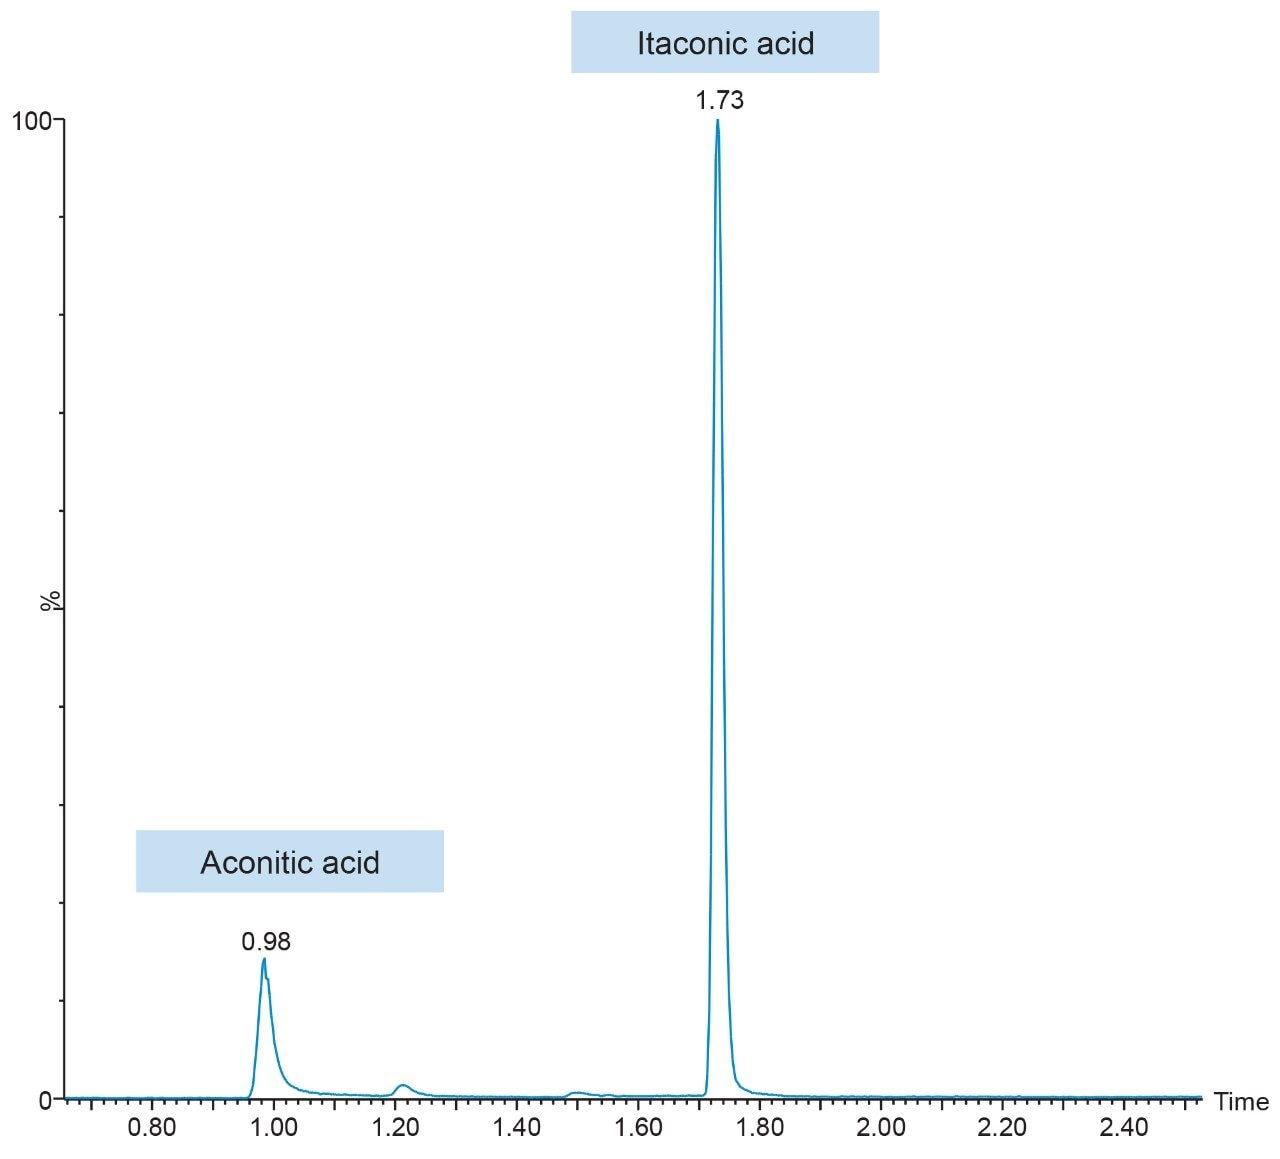
Extraction of itaconic acid from human plasma (200 μL) was performed using an Ostro 96-well Sample Preparation Plate and the supplied one-step extraction protocol. The recommended protocol is specifically designed to provide high analyte recovery, while removing highly abundant phospholipids and proteins present in serum and plasma samples.

Following extraction, samples were evaporated and reconstituted with 50 μL of a 90:10 solution of water:methanol containing 2% formic acid, providing a four-fold increase in sample concentration for added method sensitivity.

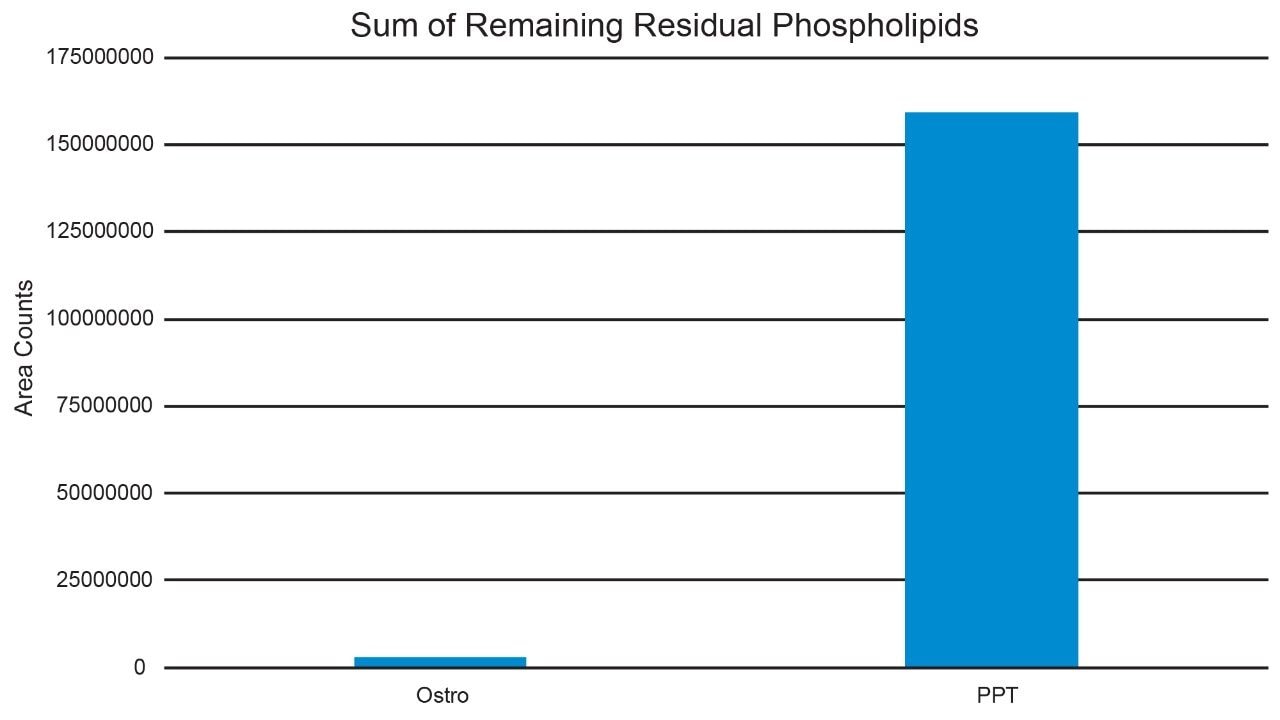
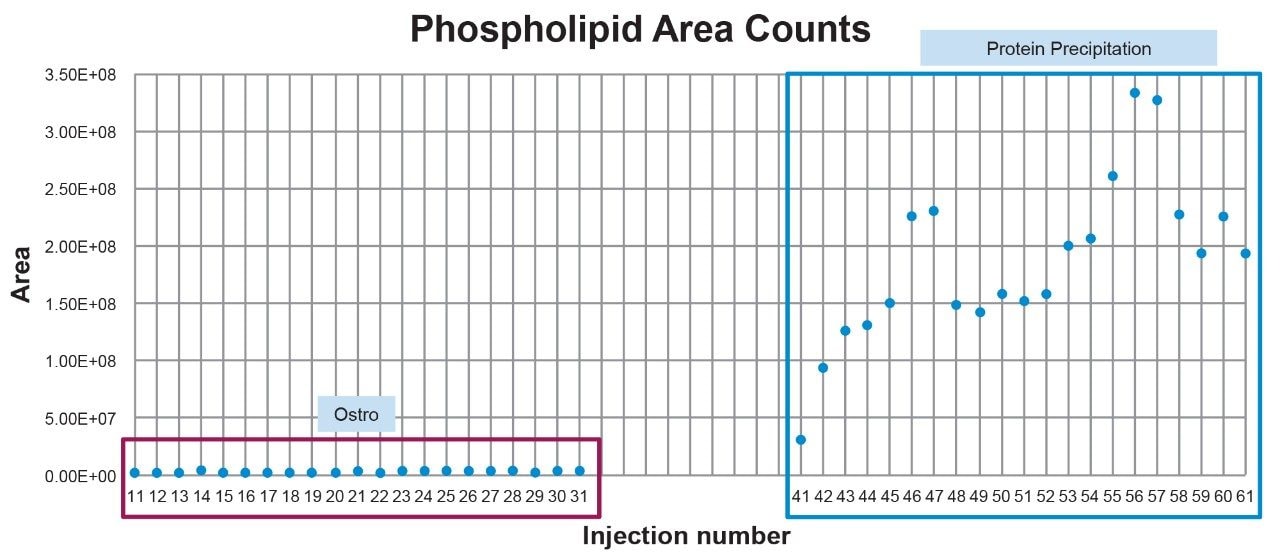
While itaconic acid recovery and matrix effect (ME) results using Ostro and traditional PPT extraction were similar, with >85% recovery and MEs <5%, effectiveness of phospholipid removal was quite different. Compared to PPT extraction, our results showed that extraction with Ostro effectively removed >95% phospholipids (Figure 4). Eliminating phospholipids from samples prior to analysis is highly beneficial, improving method robustness, maintaining overall system health and instrument up-time. A visual demonstration of the remaining level of residual phospholipids over subsequent injections using the Ostro compared to traditional PPT extraction is shown in Figure 5. When the Ostro sample extraction method is used, the phospholipid levels are negligible, and no buildup occurs. However, when traditional PPT extraction is employed, a significant number of phospholipids are present and accumulate throughout the run.

Figure 4. Comparison of phospholipids remaining after traditional PPT vs. Ostro plasma extraction.
Figure 5. Accumulation of phospholipids over subsequent injections after cleanup using Ostro vs. traditional PPT extraction of plasma samples using the LC method listed in Table 1.

Quantitative Performance

The quantitative performance using this sample preparation and LC-MS method was excellent, achieving a LLOQ of 0.5 ng/mL for itaconic acid. Calibration curves were linear (r2 > 0.999) from 0.5–100 ng/mL with accuracies between 85–115% with CVs <15% for all points on the curve (Figure 6). Additionally, both intra-day and inter-day (five individual lots, with five different analysis days) assay accuracy and precision met recommended bioanalytical method validation guidelines.

Figure 6. Representative matrix matched itaconic acid calibration curve (Day 4) demonstrating linearity and accuracy from 0.5–100 ng/mL.

Representative QC performance is highlighted in Table 3, while chromatographic performance is illustrated in Figure 7. Mean endogenous levels of itaconic acid across the five lots of plasma are highlighted in Table 4. Inter-day %CVs for endogenous itaconic acid plasma concentrations were ≤8%, indicating a robust and reproducible method.

Table 3. Intra-day (Panel A) and inter-day (Panel B) QC quantitative performance for itaconic acid.
Figure 7. Representative QC chromatograms (Day 4) for itaconic acid extracted from plasma using Ostro phospholipid removal.
Table 4. Mean endogenous itaconic acid levels in five individual lots of plasma determined over five days.

Conclusion

This application highlights the successful extraction and quantification of itaconic acid from plasma. The method combined selective and sensitive UPLC-MS/MS analysis with a simple and straightforward sample extraction using the Ostro 96-well Sample Preparation Plate. Ostro sample cleanup provided high recovery and low matrix effects, while effectively removing phospholipids and proteins from the sample. Additionally, the sub-2-μm ACQUITY UPLC HSS T3 Column provided necessary retention and resolution itaconic acid from its isobaric structural isomer, aconitic acid. The analytical sensitivity (0.5 ng/mL) and excellent reproducibility of the method described, reliably measures endogenous and elevated plasma levels of itaconic acid.

References

  1. Itaconic Acid Structure from U.S. National Library of Medicine. Retrieved 4 June, 2019 from https://pubchem.ncbi.nlm.nih.gov/compound/ Itaconic-acid.
  2. 2. Michelucci, A.; Hiller, K.; Cordes, T. Itaconic Acid: The Surprising Role of an Industrial Compound as a Mammalian Antimicrobial Metabolite. Annual Review of Nutrition 2015, 35 (1), 451–473.
  3. 3. Meiser, J.; Kraemer, L.; Jaeger, C.; et al. Itaconic Acid Indicates Cellular but Not Systemic Immune System Activation; Oncotarget. 2018, 9 (63), 32098–32107. doi:10.18632/oncotarget.25956.
  4. 4. Michopoulos, F.; Karagianni, N.; Whalley, N.M.; et al. Targeted Metabolic Profiling of the Tg197 Mouse Model Reveals Itaconic Acid as a Marker of Rheumatoid Arthritis; J. Proteome Res. 2016, 15 (12), 4579–4590. https://doi.org/10.1021/acs. jproteome.6b00654.
  5. 5. de Seymour, J.; Conlon, C.; Sulek, K.; et al. Early Pregnancy Metabolite Profiling Discovers a Potential Biomarker for the Subsequent Development of Gestational Diabetes Mellitus; Acta Diabetol 2014, 51, 887. https://doi.org/10.1007/ s00592-014-0626.

720006683, October 2019

Back To Top Back To Top